Renovated Two-Unit
For Sale
$717,500
303 Boyce Street Santa, Santa Rosa, CA 95401
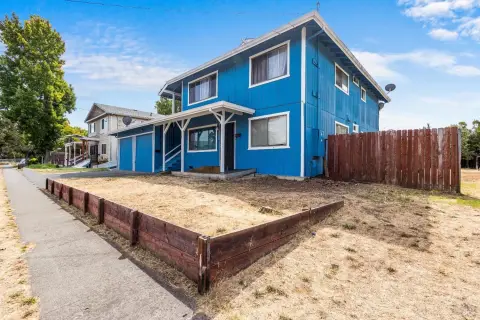
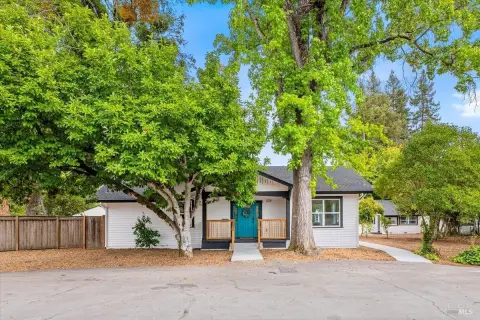
Side-by-side residences offer separate meters, attached garages, dedicated parking, and laundry hookups.
Property Size1,450 SF
Days on Market246
Property Features for 303 Boyce Street Santa
General Information
Standard status
Active
Size
1,450 SF
Property subtype
Duplex
Amenities
Ceiling Fan(s)
Wall Furnace
Dishwasher
Free-Standing Gas Range
Free-Standing Refrigerator
Deck, Patio, Porch, City, Shingle
Building Details
Building Size
1,450 SF
Year Built
1962
Listing Agency:
Casa Keys Real Estate
Listed By:
Martha Hernandez
4777168
Source:
Kw
Added: Feb 14
Changed: Oct 16
Last Checked: Oct 16 at 6:00AM
Displayed information is deemed reliable but is not guaranteed and should be independently verified. All listing content including descriptions, pricing, images are the copyrighted material of Casa Keys Real Estate

Ask AI about this property
Review the available facts, identify missing information and prepare questions for the agent.
Investment Insights
Based on property information with market context.
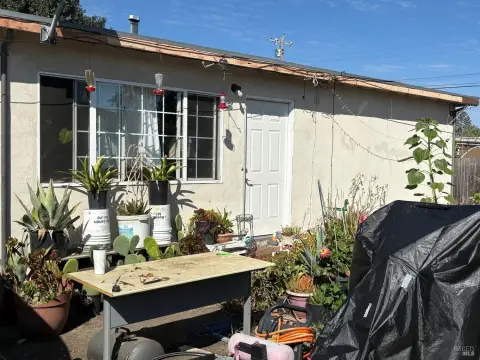
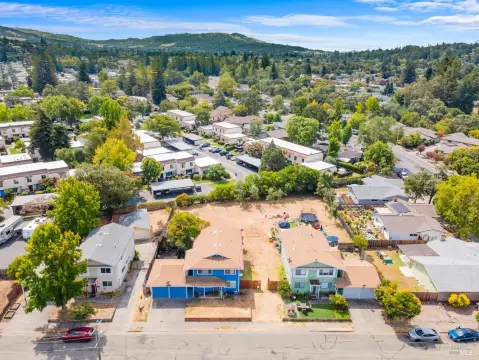
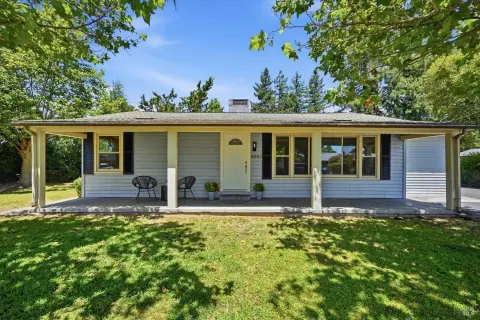
This side-by-side duplex contains two matching residences, each with 2 bedrooms, one bathroom, an attached 1-car garage, and a designated parking space. Separate meters serve the units, while laundry hookups are available in both. Refrigerators, washers, and dryers are included. Interior improvements completed 6 years ago include kitchen cabinets, countertops, gas ranges, dishwashers, flooring, and electrical panels, along with a new roof and exterior paint. The rear unit also features a large deck.
Built in 1962, the property includes low-maintenance landscaping and residential outdoor areas. Its Santa Rosa setting places the duplex a few blocks from historic Railroad Square, with shopping, dining, and local amenities nearby.
Built in 1962, the property includes low-maintenance landscaping and residential outdoor areas. Its Santa Rosa setting places the duplex a few blocks from historic Railroad Square, with shopping, dining, and local amenities nearby.
Key Highlights
- Two 2‑bedroom, one‑bathroom units in a side‑by‑side duplex
- Separate meters for both units
- Each residence includes an attached 1‑car garage and designated parking
Financial Insights
Estimated NOI and Cap Rate
NOI / Yr
$28,200
Cap Rate
3.93%
Suggested Prices Based on Cap Rates
Cap Rate 5%
$564,000
$564.0K
Cap Rate 7%
$402,857
$402.9K
Cap Rate 9%
$313,333
$313.3K
Market Conditions
NOI Build-Up for 1,450 SF
Gross rent
$42.6K $29.40/SF
− Vacancy
−$2.3K −$1.62/SF
EGI
$40.3K $27.78/SF
− OpEx
−$12.1K −$8.33/SF
NOI
$28.2K $19.45/SF
Area
Santa Rosa, CA
Vacancy
5.50%
Lease Rate
$29.40 /SF/Yr
Expense Ratio
30.00%
Simulate Cap Rate and NOI
Suggested Prices Based on Cap Rates
Cap Rate 5%
$564,000
Cap Rate 7%
$402,857
Cap Rate 9%
$313,333
Alternative Uses
Best Use
Multifamily LT 5
$402.9K
$352.5K – $470.0K
NOI $28,200 @ 7.0% cap · market cap 3.93%
Second Best
Apartment 5plus
$361.8K
$316.6K – $422.1K
NOI $25,328 @ 7.0% cap · market cap 3.53%
Theoretical Best
—
—
same as Best Use
Zoning and permitted uses should be independently verified with authorities.
How Realmo checks its estimates
Property Analytics
Unlock full access to Insights
Subscribe to Realmo Intelligence
Open Analytics
Current Use
Location Intelligence
Trade Area within ½ mile
1,980
Businesses Nearby
Explore this area
Business Placement
Demographics for 95401, CA
37,272
Population
14,281
Households
2.6
Avg Household Size
38
Median Age
28%
College-Educated
80%
High-School Grad
20.9 sq mi
ZIP Area
1,783
Density / Sq Mi
$93,513
Median Household Income
$45,630
Median Earnings
$1,978
Median Rent
$628,900
Median Home Value
Check the figures for this property
Cap Rate, Value Estimation, Potential NOI and more
View Realmo Analytics
Market
Vacancy Rate% for Multifamily in West region


Frequently Asked Questions
What type of property is this?
Duplex - Side-by-side residences offer separate meters, attached garages, dedicated parking, and laundry hookups.
Where is this duplex located?
The property is located at 303 Boyce Street Santa Santa Rosa, CA.
What is the asking price?
The asking price for this property is $717,500.
What are key features of this property?
This property features: Two 2‑bedroom, one‑bathroom units in a side‑by‑side duplex; Separate meters for both units; Each residence includes an attached 1‑car garage and designated parking


