Dual-Leased Mixed-Use Income
For Sale
$545,000
3021 Spartanburg Highway, East Flat Rock, NC 28726
Commercial Sale, East Flat Rock, NC
Property Size2,480 SF
Lot Size0.59 Acres
Price / SF$219.76
Days on Market229
Property Features for 3021 Spartanburg Highway
General Information
Property type
Commercial Sale
Property subtype
Other
Zoning
CC
Zoning description
CC
Directions
Hwy 176, on right directly across from General Electric.
Standard status
Active
APN
102514
Lot size
0.59 Acres
Taxes and HOA fees
Tax Description
US176 ON
Legal Description
US176 ON
Utilities
Heating system
Ductless (Heating), Heat Pump (Heating)
Cooling system
Ductless
Building Details
Year built
1992
Listing Agency:
BluAxis Realty
(828) 233-5447
Listed By:
Johnny Duncan · License #256746
(828) 606-5546
Added: Feb 19
Changed: Oct 5
Last Checked: Oct 6 at 8:06AM
MLS# 4349060
Copyright © 2026 Canopy MLS. All rights reserved. All information provided by the listing agent/broker is deemed reliable but is not guaranteed and should be independently verified.
Investment Insights
Based on property information with market context.
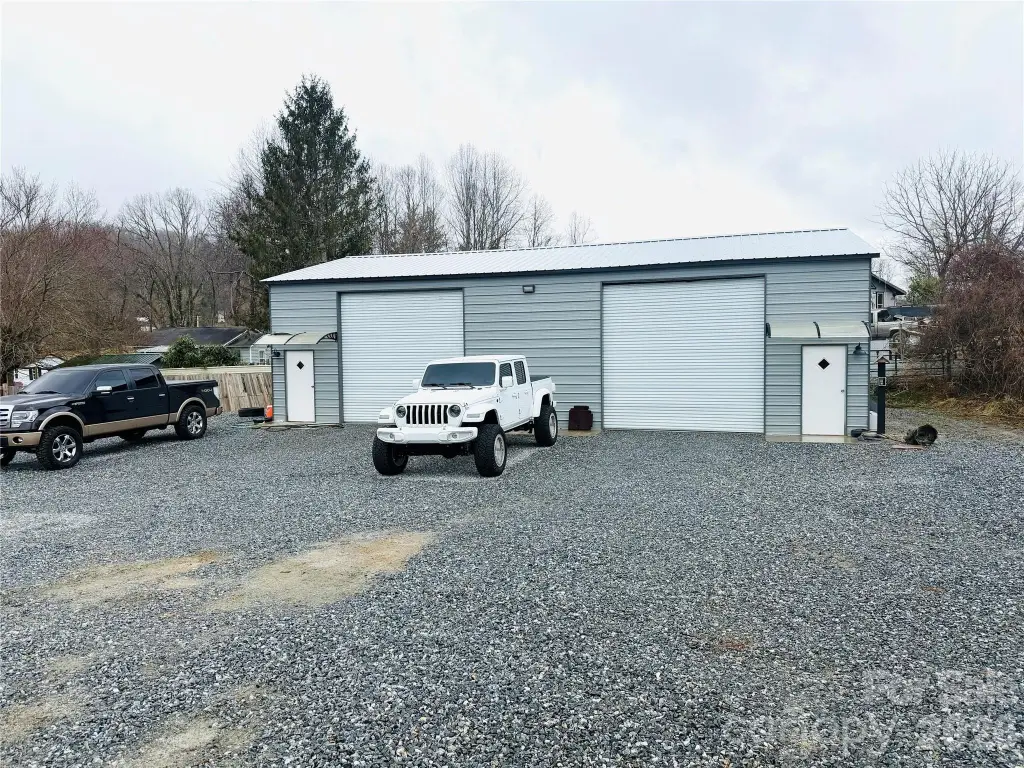
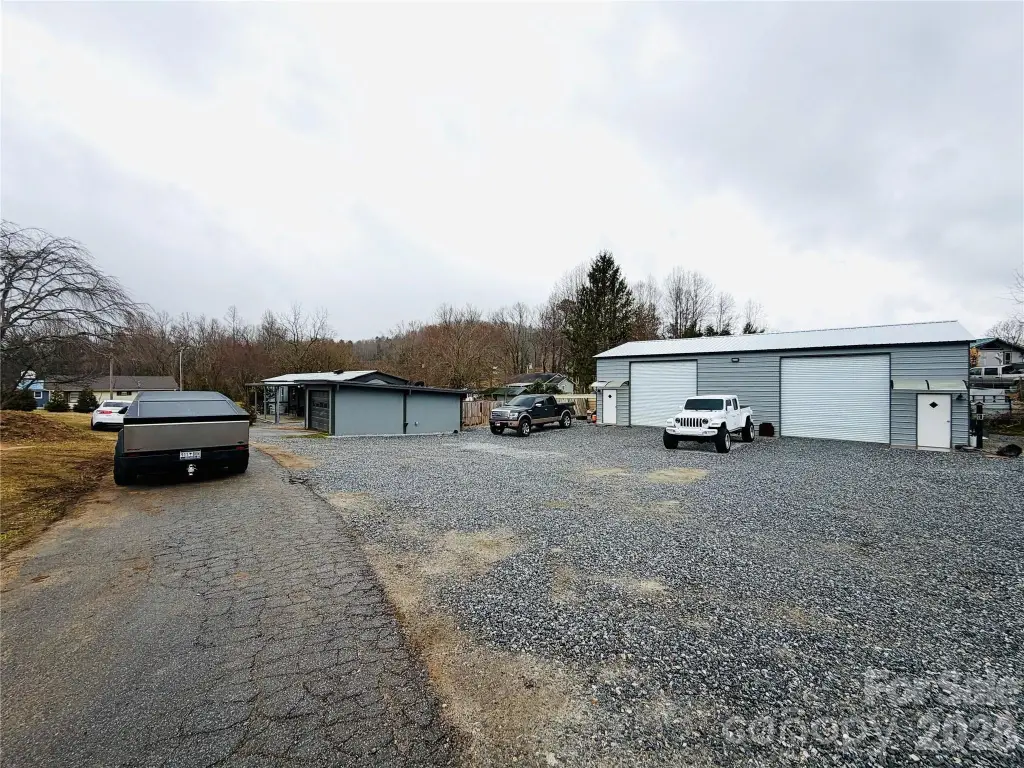
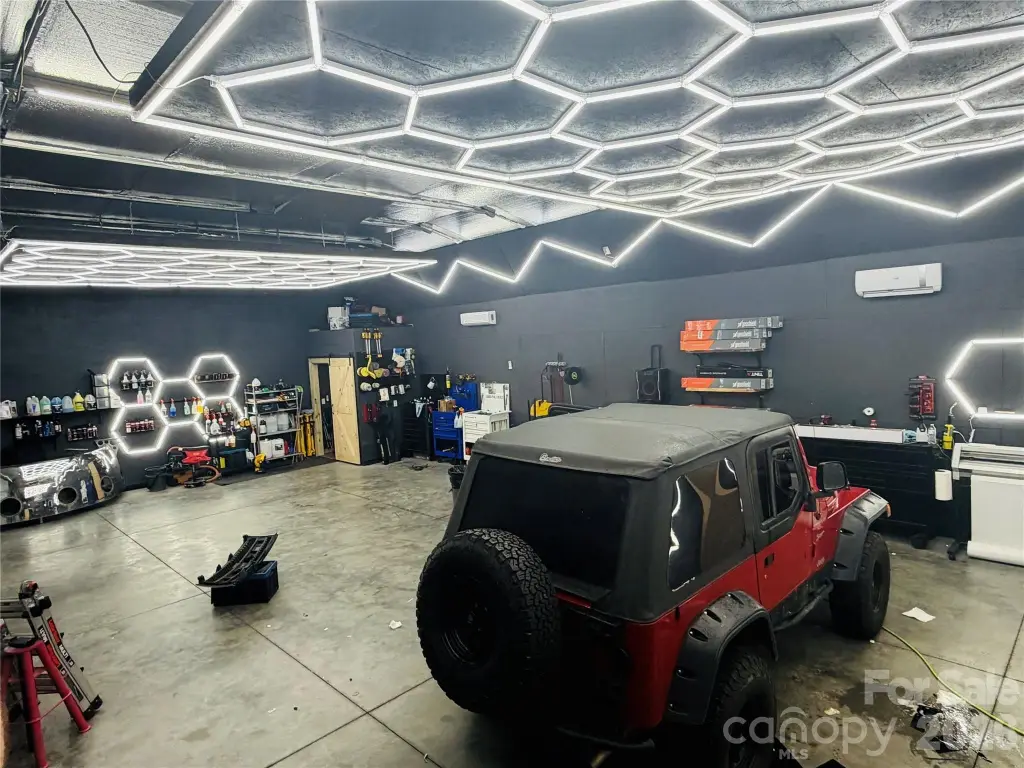
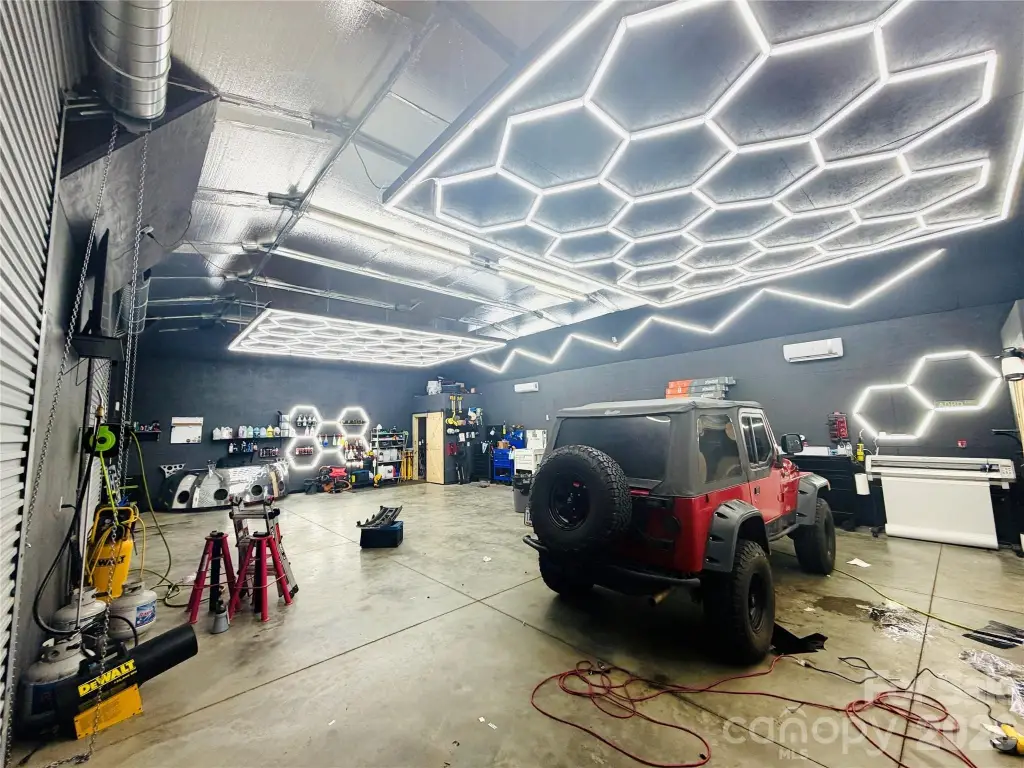
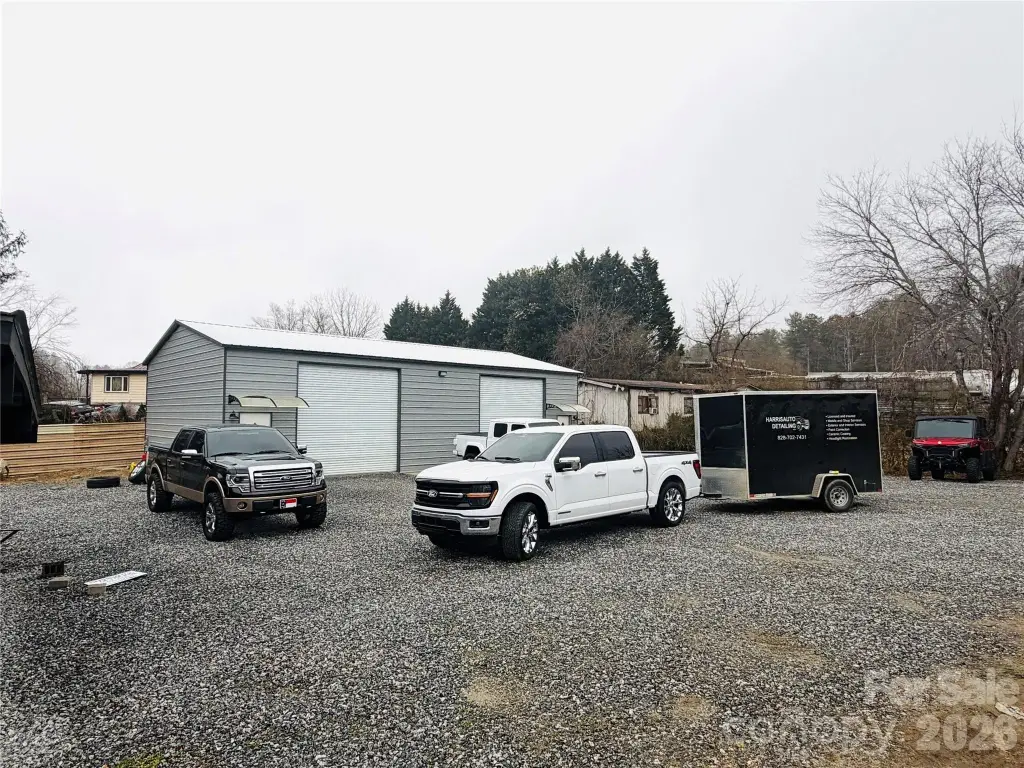
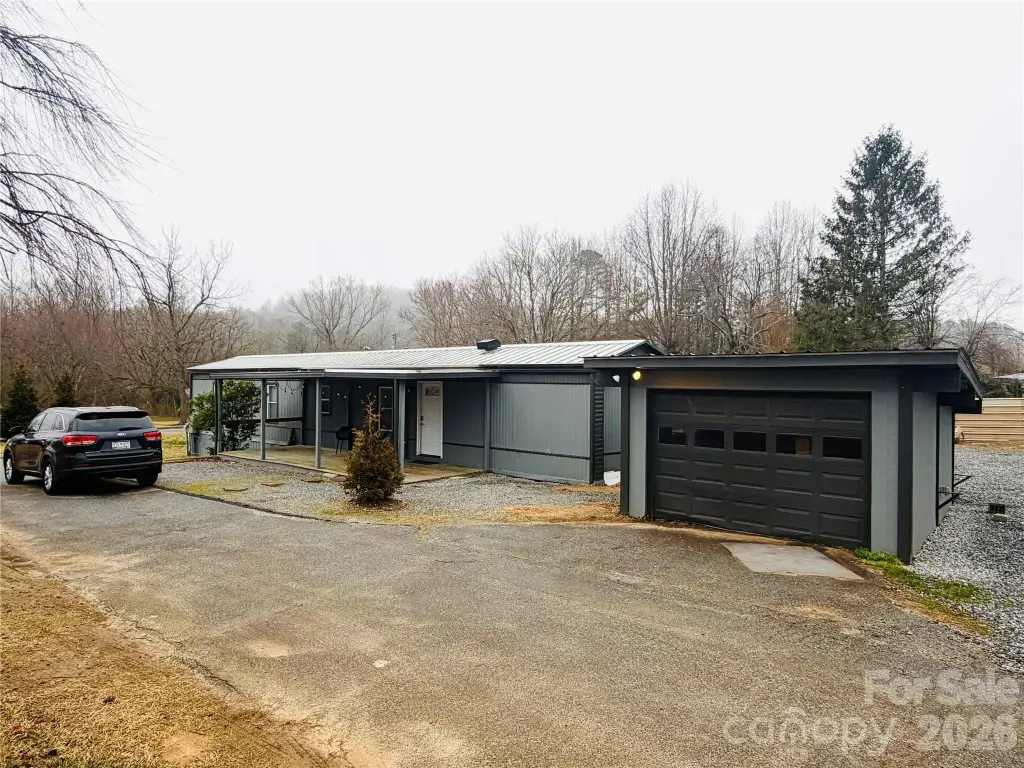
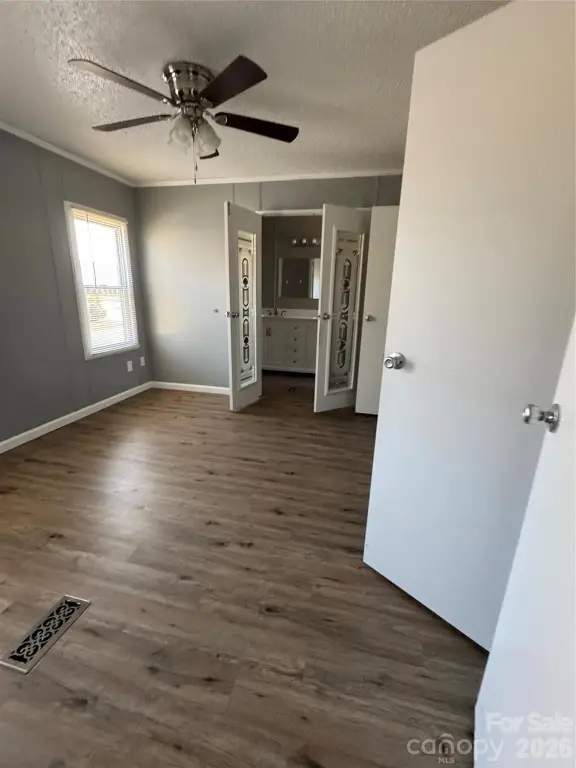
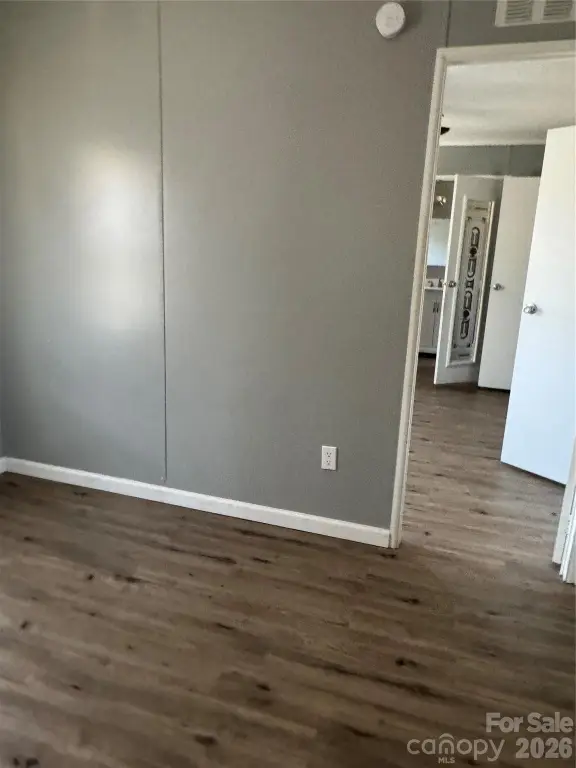
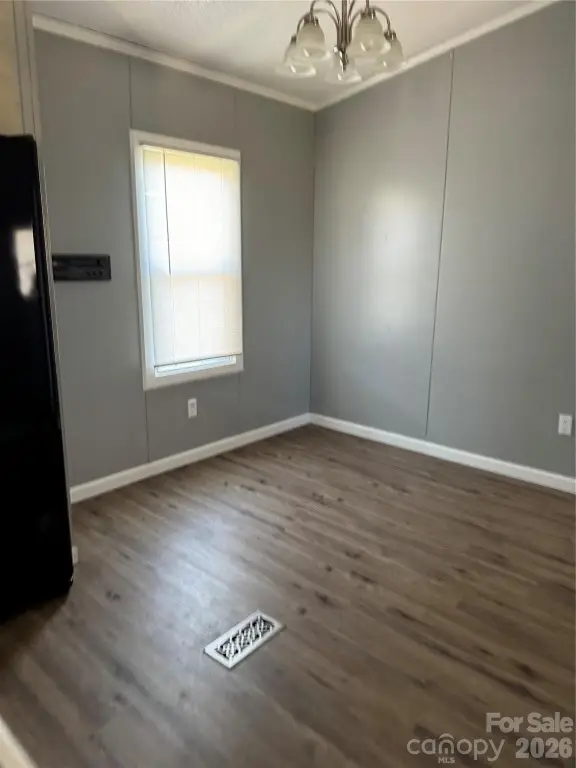
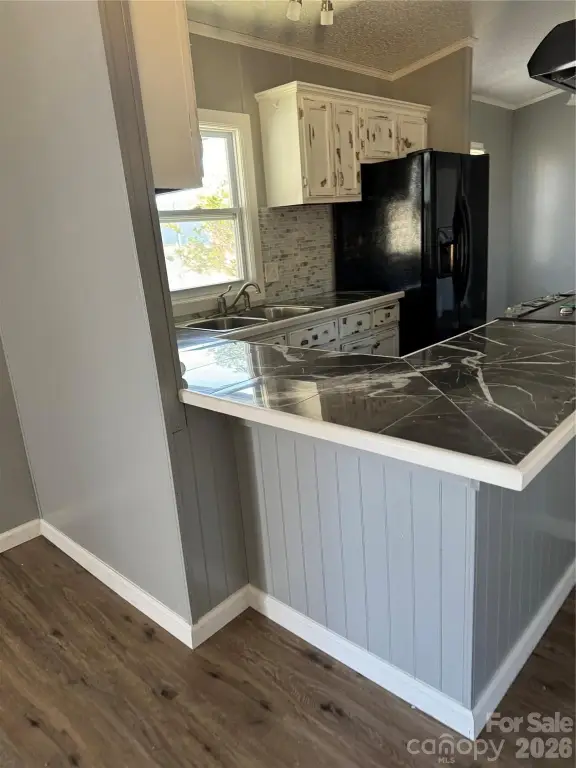
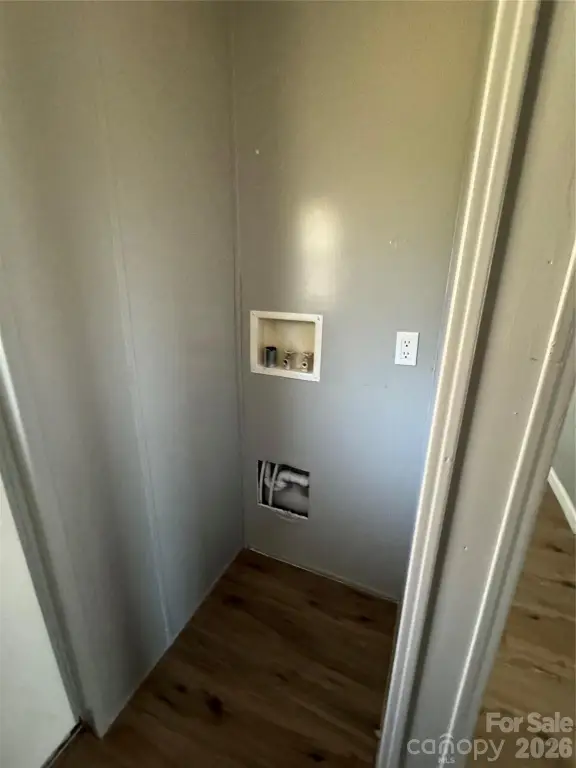
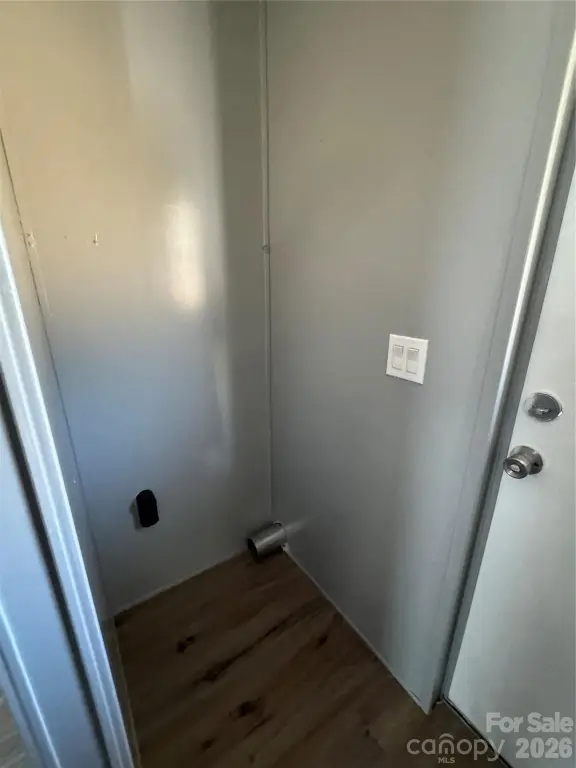
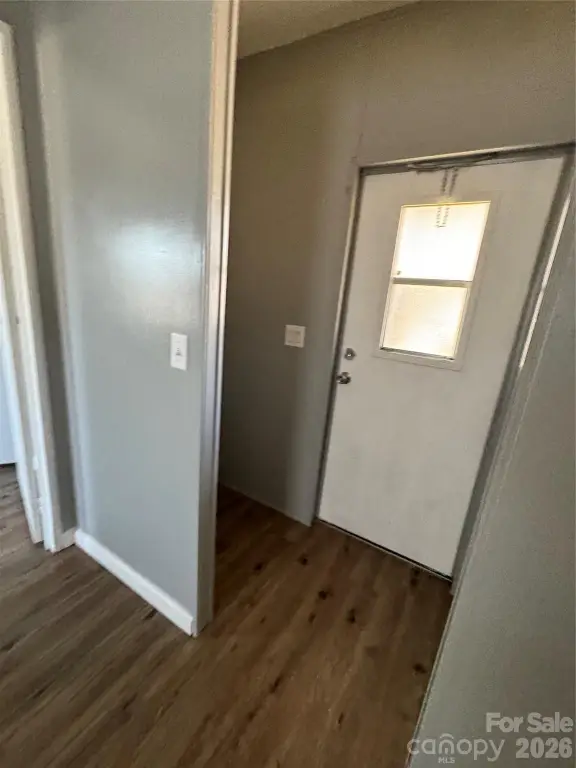
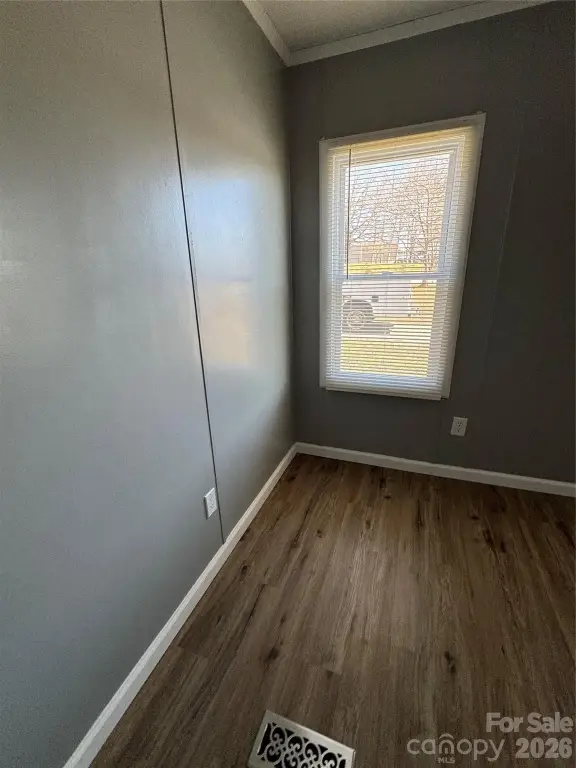
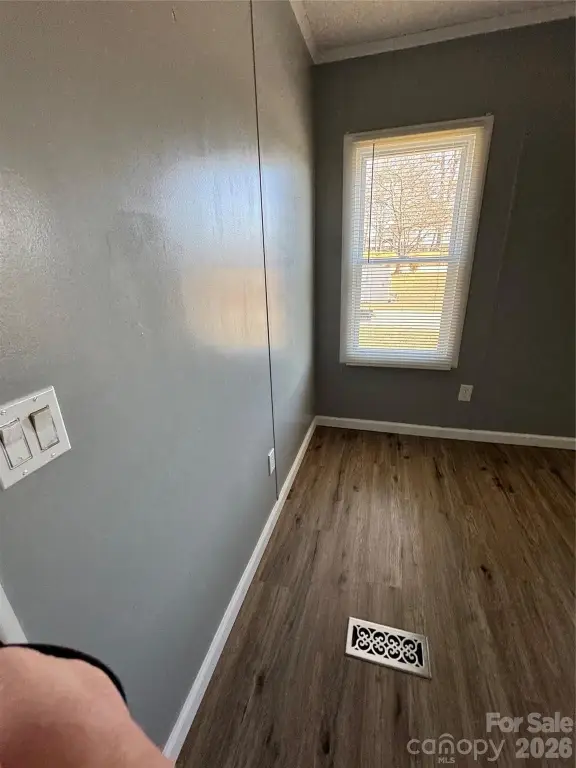
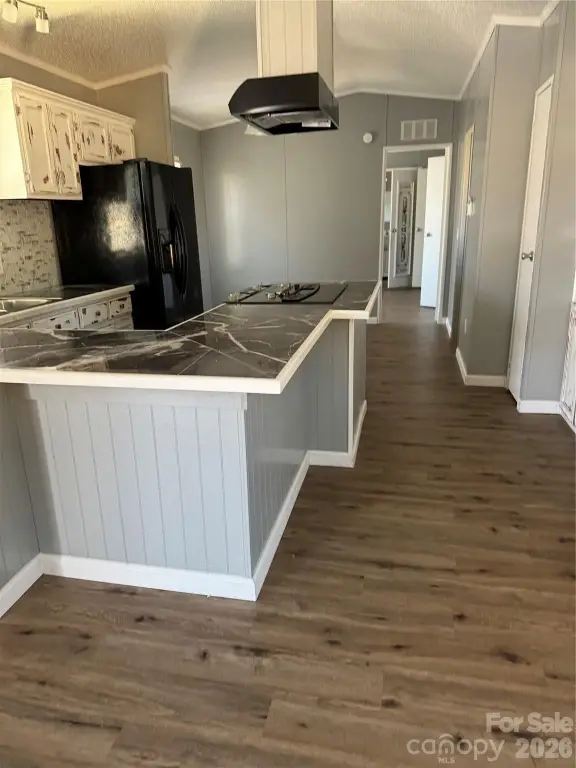
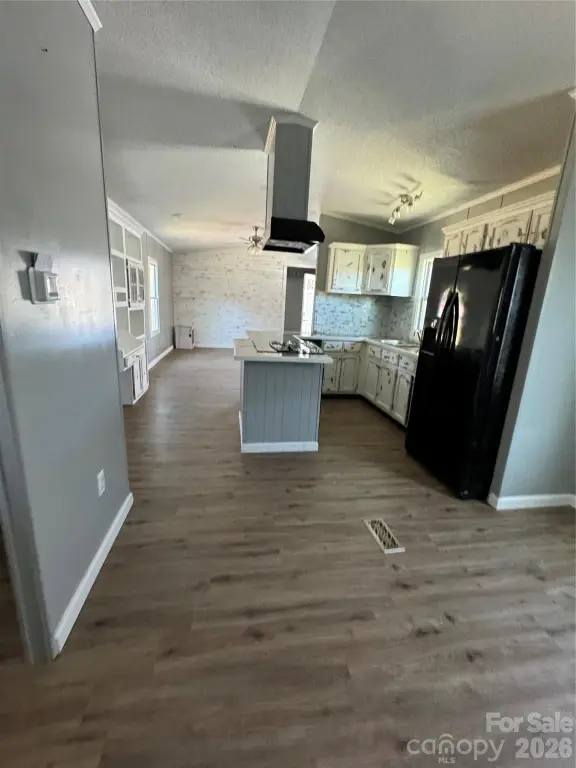
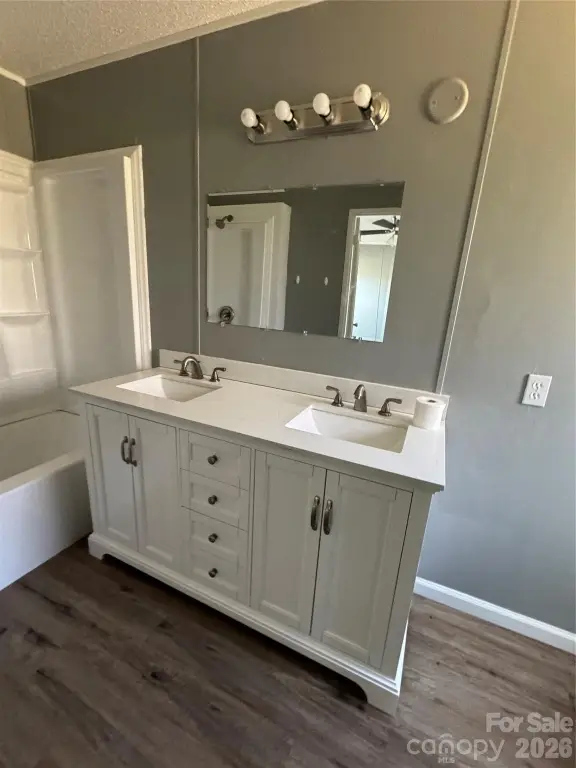
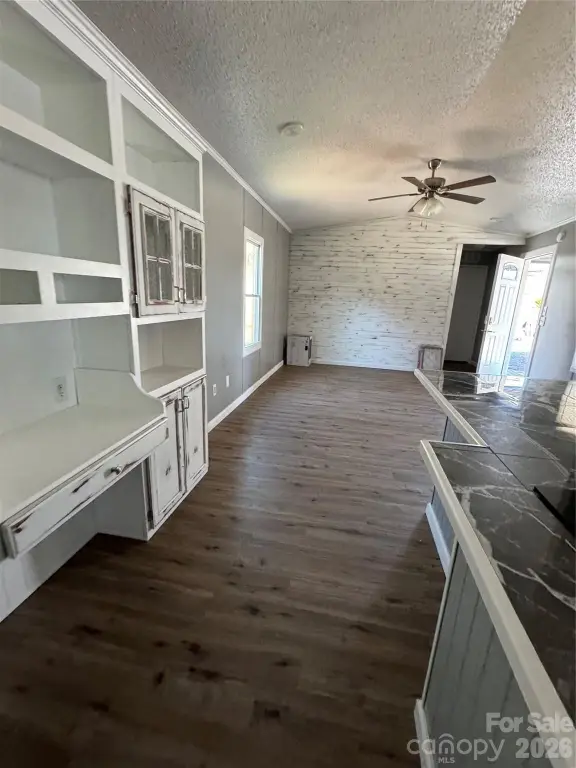
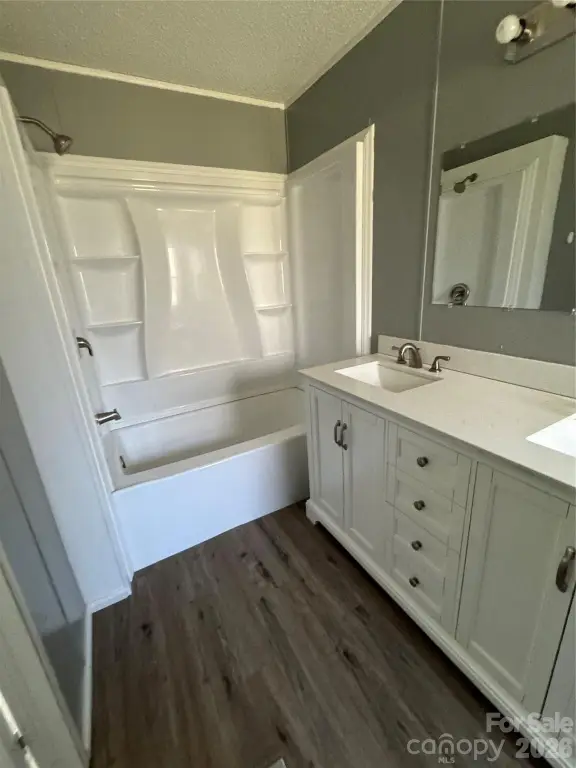
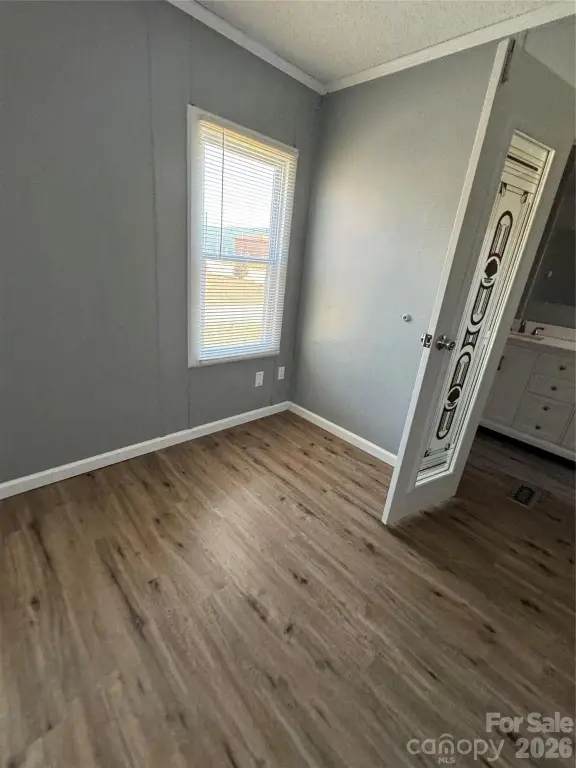
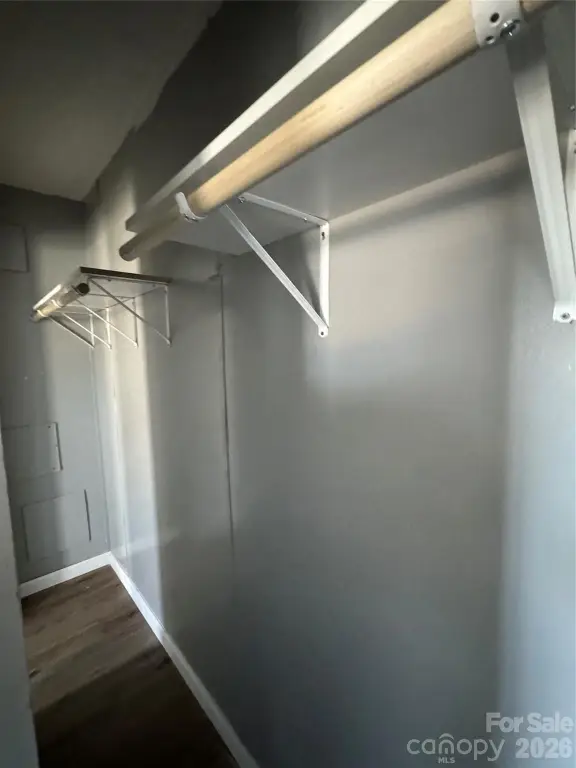
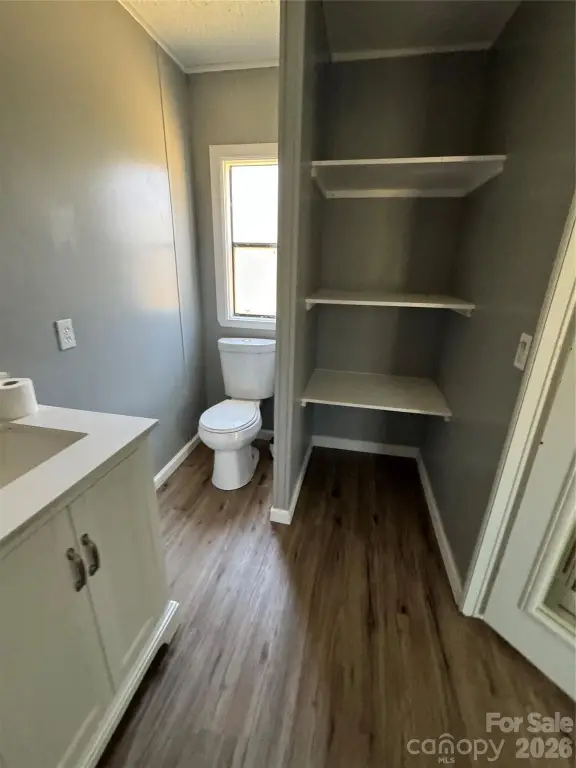
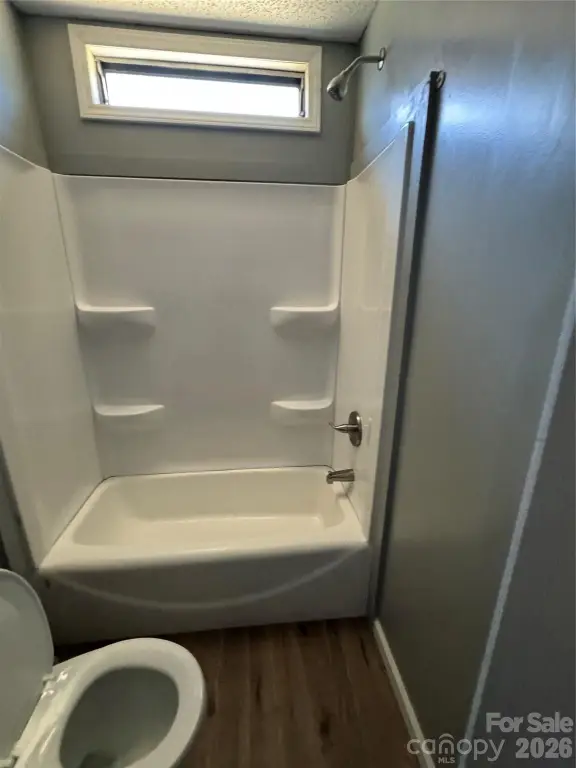
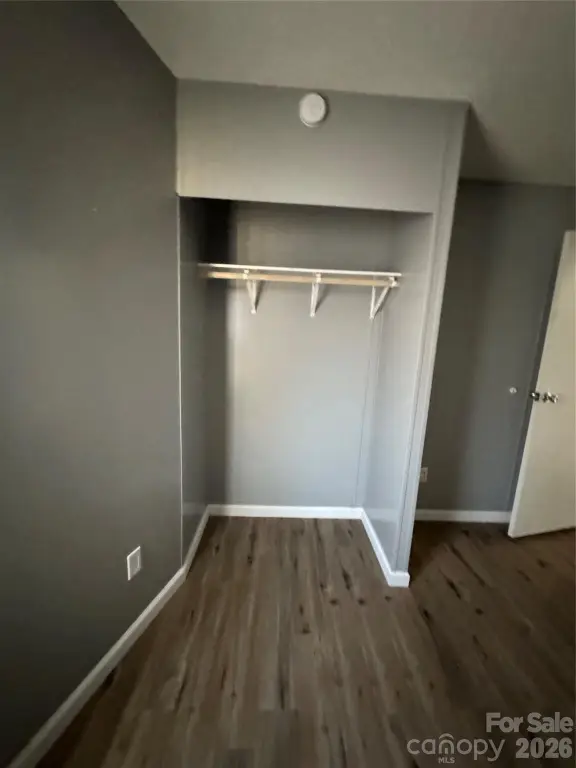
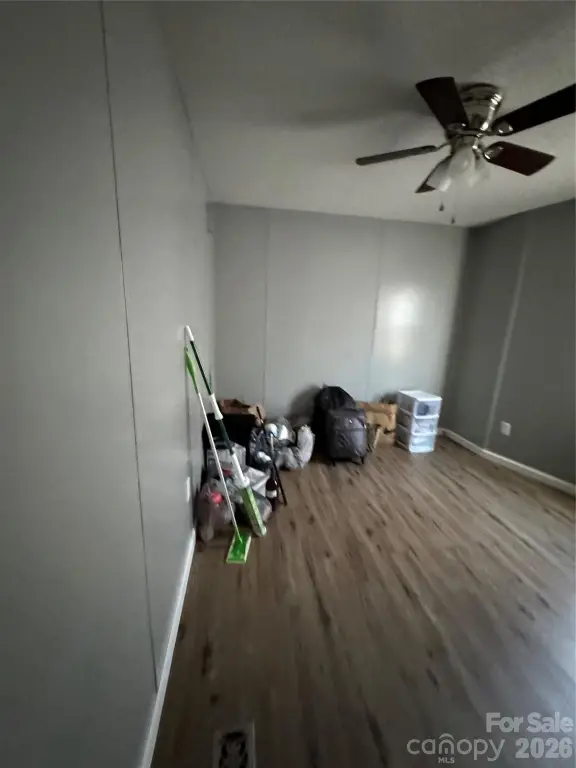
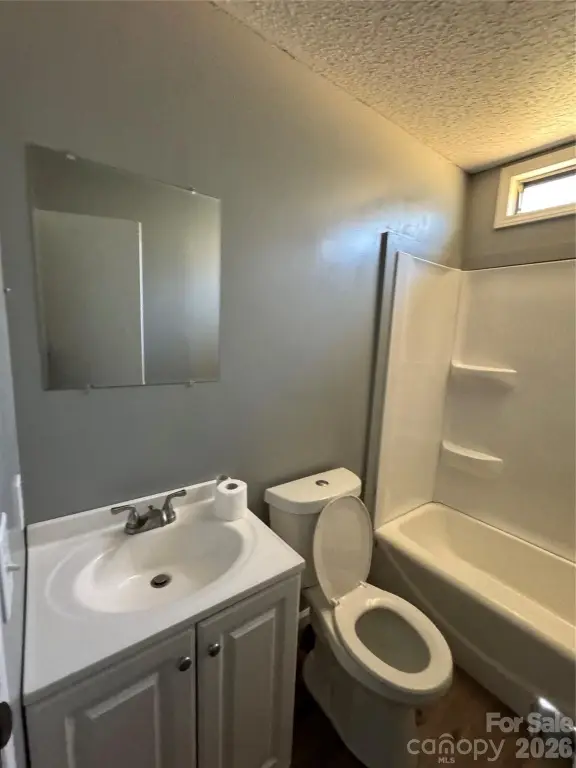
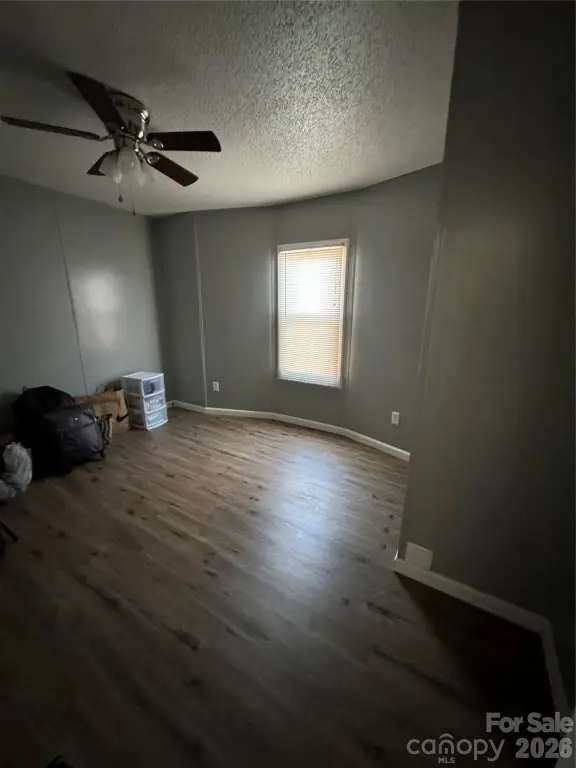
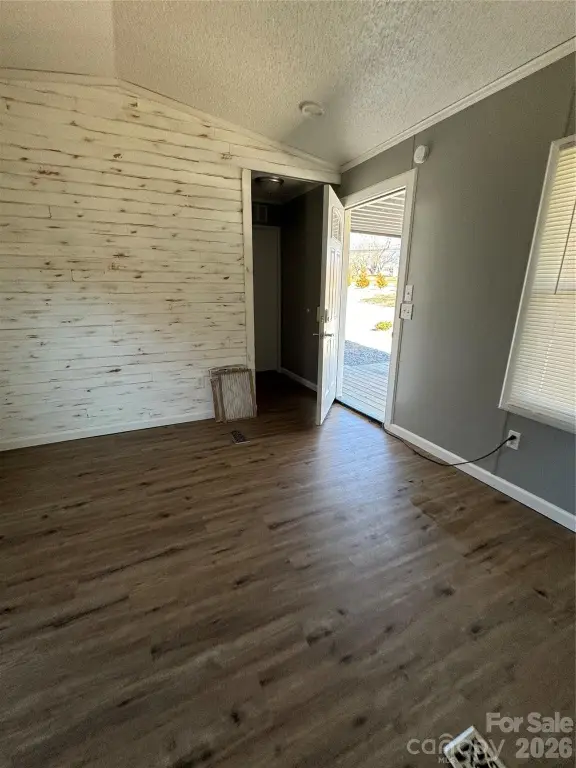
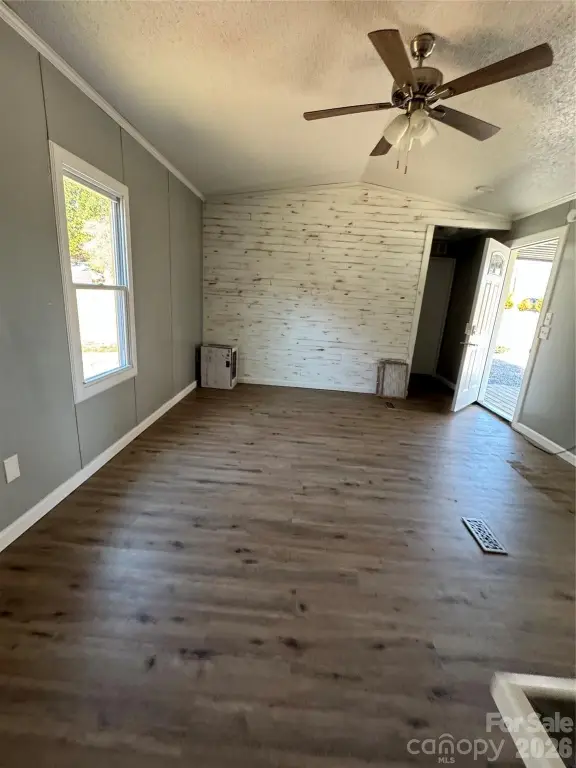
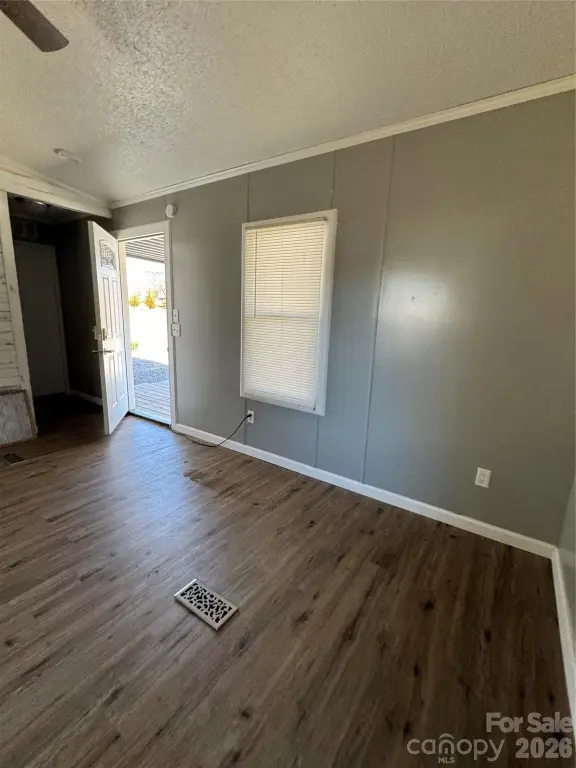
This mixed-use income property includes two fully leased units on a single parcel. The residential component is a remodeled 1992 manufactured home with two bedrooms and two bathrooms (14' x 70'), currently occupied by a tenant and designed with an updated, functional interior layout. The commercial component is a climate-controlled building that contains a dedicated office area, two bathrooms, and two large bays, providing a flexible indoor setup for a range of service, storage, workshop, retail, or professional uses.
Located at 3021 Spartanburg Highway in East Flat Rock, the property is zoned Community Commercial (CC) and offers road frontage along US Highway 176. The highway setting supports customer and tenant access for commercial activity, while also maintaining convenient day-to-day access for the residential unit.
For investors and owner-operators, the primary value is the turnkey, dual-income structure with both units currently leased. The property allows an operator to market the residential unit as income-producing housing while maintaining a separate, purpose-built commercial space with climate control and sizable bay areas for businesses that need indoor work or storage. As Community Commercial zoning is in place, the parcel may also support future use changes or expansion consistent with local requirements.
Located at 3021 Spartanburg Highway in East Flat Rock, the property is zoned Community Commercial (CC) and offers road frontage along US Highway 176. The highway setting supports customer and tenant access for commercial activity, while also maintaining convenient day-to-day access for the residential unit.
For investors and owner-operators, the primary value is the turnkey, dual-income structure with both units currently leased. The property allows an operator to market the residential unit as income-producing housing while maintaining a separate, purpose-built commercial space with climate control and sizable bay areas for businesses that need indoor work or storage. As Community Commercial zoning is in place, the parcel may also support future use changes or expansion consistent with local requirements.
Key Highlights
- Dual Income Streams: Remodeled 2‑bedroom residential unit and a 1,500 sq ft climate‑controlled commercial building provide immediate and reliable revenue.
- Prime Location: High‑traffic frontage on US Highway 176 (Spartanburg Highway) offers excellent visibility and accessibility.
- Community Commercial Zoning: Provides flexibility for various business uses, expansions, or owner‑occupied scenarios.
Financial Insights
Estimated NOI and Cap Rate
NOI / Yr
$30,654
Cap Rate
5.62%
Suggested Prices Based on Cap Rates
Cap Rate 5%
$613,080
$613.1K
Cap Rate 7%
$437,914
$437.9K
Cap Rate 9%
$340,600
$340.6K
Market Conditions
NOI Build-Up for 2,480 SF
Gross rent
$44.6K $18.00/SF
− Vacancy
−$848 −$0.34/SF
EGI
$43.8K $17.66/SF
− OpEx
−$13.1K −$5.30/SF
NOI
$30.7K $12.36/SF
Area
Henderson County, NC
Vacancy
1.90%
Lease Rate
$18.00 /SF/Yr
Expense Ratio
30.00%
Simulate Cap Rate and NOI
Suggested Prices Based on Cap Rates
Cap Rate 5%
$613,080
Cap Rate 7%
$437,914
Cap Rate 9%
$340,600
Alternative Uses
Best Use
Retail
$437.9K
$383.2K – $510.9K
NOI $30,654 @ 7.0% cap · market cap 5.62%
Second Best
Mixed Use
$281.7K
$246.5K – $328.6K
NOI $19,716 @ 7.0% cap · market cap 3.62%
Theoretical Best
Office A
$826.5K
$723.2K – $964.2K
NOI $57,853 @ 7.0% cap · market cap 10.62%
Zoning and permitted uses should be independently verified with authorities.
Property Analytics
Unlock full access to Insights
Subscribe to Realmo Intelligence
Open Analytics
Current Use
Lease Details
100%
Occupancy
Multi-tenant
Tenancy
Turnkey business
Opportunity
Yes
Highway access
Location Intelligence
Trade Area within ½ mile
118
Businesses Nearby
Explore this area
Business Placement
Demographics for 28726, NC
3,787
Population
1,450
Households
2.6
Avg Household Size
35
Median Age
9%
College-Educated
79%
High-School Grad
2.5 sq mi
ZIP Area
1,515
Density / Sq Mi
$56,638
Median Household Income
$31,139
Median Earnings
$945
Median Rent
$178,600
Median Home Value
Check the figures for this property
Cap Rate, Value Estimation, Potential NOI and more
View Realmo Analytics
Market
Vacancy Rate% for Industrial in South region

Questions? Ask Rey
Realmo’s AI knows this listing — price, zoning, demand, history. Ask anything.


Frequently Asked Questions
What type of property is this?
Mixed-use property - Two currently leased units combine a remodeled manufactured home and a climate-controlled commercial building with large bays.
Where is this mixed-use property located?
The property is located at 3021 Spartanburg Highway East Flat Rock, NC.
What is the asking price?
The asking price for this property is $545,000.
What are key features of this property?
This property features: Dual Income Streams: Remodeled 2‑bedroom residential unit and a 1,500 sq ft climate‑controlled commercial building provide immediate and reliable revenue.; Prime Location: High‑traffic frontage on US Highway 176 (Spartanburg Highway) offers excellent visibility and accessibility.; Community Commercial Zoning: Provides flexibility for various business uses, expansions, or owner‑occupied scenarios.