Class A Office
For Sale
$1,100,000
301 N Jackson St, Jackson, MI 49201
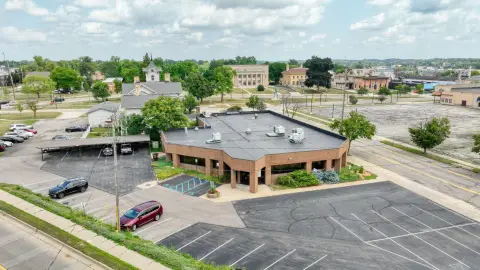
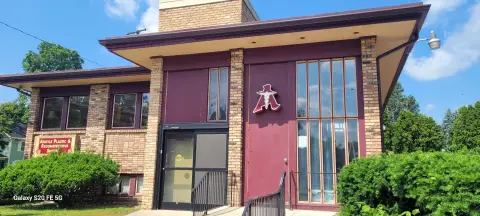
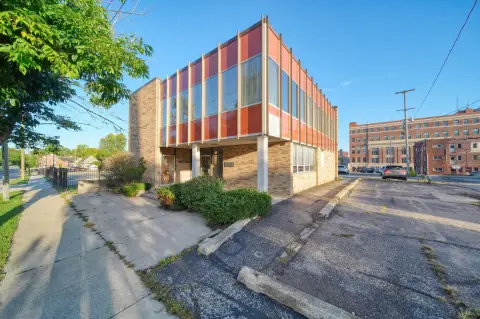
2021 office property combines a leased bank suite with a separate office suite available at closing.
Property Size7,280 SF
Price / SF$151.10
Days on Market197
Property Features for 301 N Jackson St
General Information
Standard status
Active
Size
7,280 SF
Net Rentable
4,057 SF
Class
Class A
Total Parking Spaces
52
Property subtype
Commercial
Amenities
building signage
Building Details
Year Built
2021
Tenancy
Multi
Listing Agency:
NAI Wisinski of West Michigan
Listed By:
Jodi K Milks · License #6506044331
(269) 353-0311
Source:
Vmrealestatemichigan
Added: Apr 2
Changed: Oct 1
Last Checked: Oct 14 at 11:51PM
Displayed information is deemed reliable but is not guaranteed and should be independently verified. All listing content including descriptions, pricing, images are the copyrighted material of NAI Wisinski of West Michigan
Investment Insights
Based on property information with market context.
Completed in 2021, this 7,280 SF Class A office building was originally developed as a bank branch and is structured for both occupancy and investment. Fifth Third Bank is expected to lease 4,057 RSF under a new 10-year term, while the remaining 3,223 RSF front office suite will be available upon closing. The configuration supports an owner-user seeking additional income or an investor acquiring a partially leased asset.
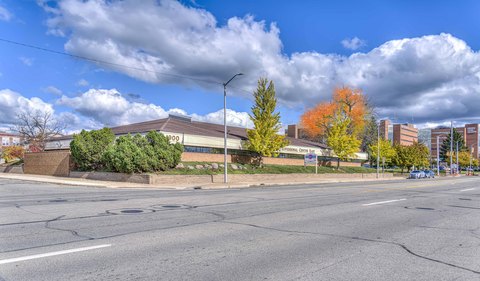
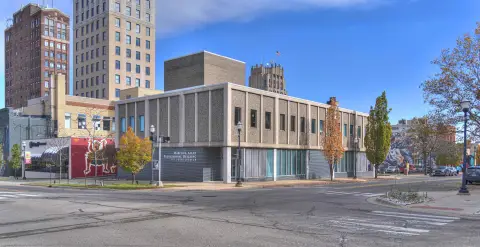
The property provides 52 on-site parking spaces, supplemental public street parking, and signage opportunities for both occupants. Its downtown Jackson setting places the building near Consumers Energy headquarters, Jackson County offices, Henry Ford Health, and Jackson College. The space is suited to professional office, medical, and service-oriented operations.
The property provides 52 on-site parking spaces, supplemental public street parking, and signage opportunities for both occupants. Its downtown Jackson setting places the building near Consumers Energy headquarters, Jackson County offices, Henry Ford Health, and Jackson College. The space is suited to professional office, medical, and service-oriented operations.
Key Highlights
- 7,280 SF Class A office building constructed in 2021
- Fifth Third Bank lease planned for 4,057 RSF with a new 10‑year term
- 3,223 RSF front office suite available upon closing
Financial Insights
Estimated NOI and Cap Rate
NOI / Yr
$69,169
Cap Rate
6.29%
Suggested Prices Based on Cap Rates
Cap Rate 5%
$1,383,380
$1.4M
Cap Rate 7%
$988,129
$988.1K
Cap Rate 9%
$768,544
$768.5K
Market Conditions
NOI Build-Up for 7,280 SF
Gross rent
$100.5K $13.80/SF
− Vacancy
−$8.2K −$1.13/SF
EGI
$92.2K $12.67/SF
− OpEx
−$23.1K −$3.17/SF
NOI
$69.2K $9.50/SF
Area
Jackson County, MI
Vacancy
8.20%
Lease Rate
$13.80 /SF/Yr
Expense Ratio
25.00%
Simulate Cap Rate and NOI
Suggested Prices Based on Cap Rates
Cap Rate 5%
$1,383,380
Cap Rate 7%
$988,129
Cap Rate 9%
$768,544
Alternative Uses
Best Use
Specialty Retail
$988.1K
$864.6K – $1.15M
NOI $69,169 @ 7.0% cap · market cap 6.29%
Second Best
Office B
$871.6K
$762.7K – $1.02M
NOI $61,012 @ 7.0% cap · market cap 5.55%
Theoretical Best
Office A
$1.16M
$1.02M – $1.36M
NOI $81,350 @ 7.0% cap · market cap 7.40%
Zoning and permitted uses should be independently verified with authorities.
How Realmo checks its estimates
Property Analytics
Unlock full access to Insights
Subscribe to Realmo Intelligence
Open Analytics
Current Use
Lease Details
Multi-tenant
Tenancy
Location Intelligence
Trade Area within ½ mile
1,485
Businesses Nearby
Explore this area
Business Placement
Demographics for 49201, MI
47,747
Population
18,102
Households
2.6
Avg Household Size
41
Median Age
23%
College-Educated
92%
High-School Grad
155.0 sq mi
ZIP Area
308
Density / Sq Mi
$71,714
Median Household Income
$36,390
Median Earnings
$945
Median Rent
$202,900
Median Home Value
Check the figures for this property
Cap Rate, Value Estimation, Potential NOI and more
View Realmo Analytics
Market
Vacancy Rate% for Office in Midwest region

Questions? Ask Rey
Realmo’s AI knows this listing — price, zoning, demand, history. Ask anything.


Frequently Asked Questions
What type of property is this?
Office building - 2021 office property combines a leased bank suite with a separate office suite available at closing.
Where is this office building located?
The property is located at 301 N Jackson St Jackson, MI.
What is the asking price?
The asking price for this property is $1,100,000.
What are key features of this property?
This property features: 7,280 SF Class A office building constructed in 2021; Fifth Third Bank lease planned for 4,057 RSF with a new 10‑year term; 3,223 RSF front office suite available upon closing


