Historic Mixed-Use




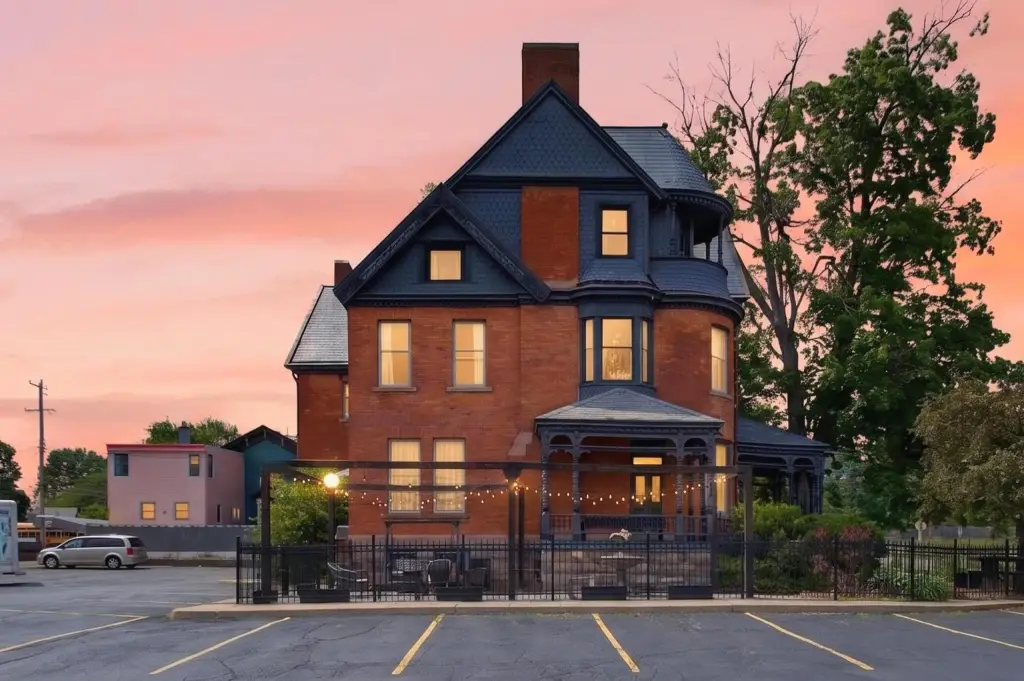
For Sale
$525,000
505 Wildwood Avenue, Jackson, MI 49201
Commercial Sale, Jackson, MI
Property Size6,357 SF
Lot Size0.30 Acres
Price / SF$82.59
Days on Market113
Property Features for 505 Wildwood Avenue
General Information
Property type
Commercial Sale
Property subtype
Office
Bathrooms
5
Full bathrooms
5
Rooms
Bathroom 5, Basement, Bathroom 4, Bathroom 3, Bathroom 2, Bathroom 1
Parking
19
Interior features
Broadband
Elementary school district
Jackson
Middle school district
Jackson
High school district
Jackson
Directions
At the southeast corner across from the intersection where Wildwood and Steward Ave. meet.
Standard status
Active
APN
2-005700000
Size
6,357 SF
Lot size
0.30 Acres
Taxes and HOA fees
Tax Year
2025
Tax Description
BEG AT NW COR OF LOT 6 TH SE ALG S LN OF WILDWOOD AVE 92.94 FT TH S20(DEGREES)30' E 74.26 FT TH S69(DEGREES)05'E 20.65 F
Tax Annual Amount
13875
Legal Description
BEG AT NW COR OF LOT 6 TH SE ALG S LN OF WILDWOOD AVE 92.94 FT TH S20(DEGREES)30' E 74.26 FT TH S69(DEGREES)05'E 20.65 F
Utilities
Heating system
Forced Air
Cooling system
Central Air
Building Details
Year built
1900
Floors in Building
4
Number of units
1
Building materials
Brick
Roof type
Slate
Listing Agency:
Sproat Realty Professionals-J
(517) 589-9677
Listed By:
SUSAN M MOHLMAN · License #6502111869
(517) 206-3332
Added: Jun 5
Changed: Sep 16
Last Checked: Sep 25 at 7:06AM
MLS# 26027481
Copyright © 2026 Michigan Regional Information Center, LLC. All rights reserved. All information provided by the listing agent/broker is deemed reliable but is not guaranteed and should be independently verified.
Investment Insights
Based on property information with market context.
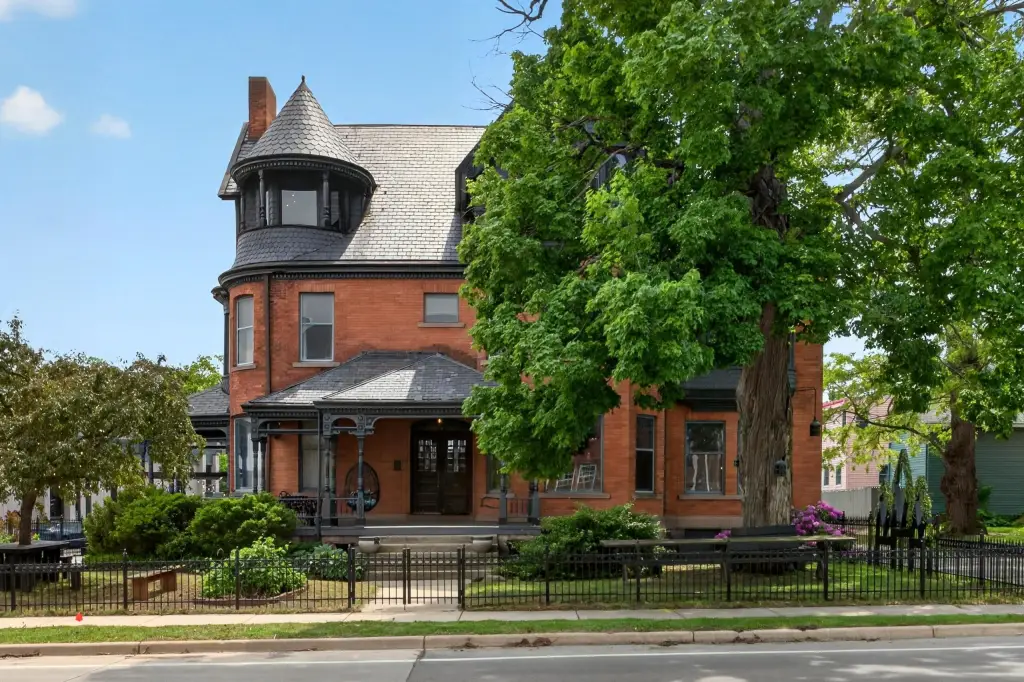
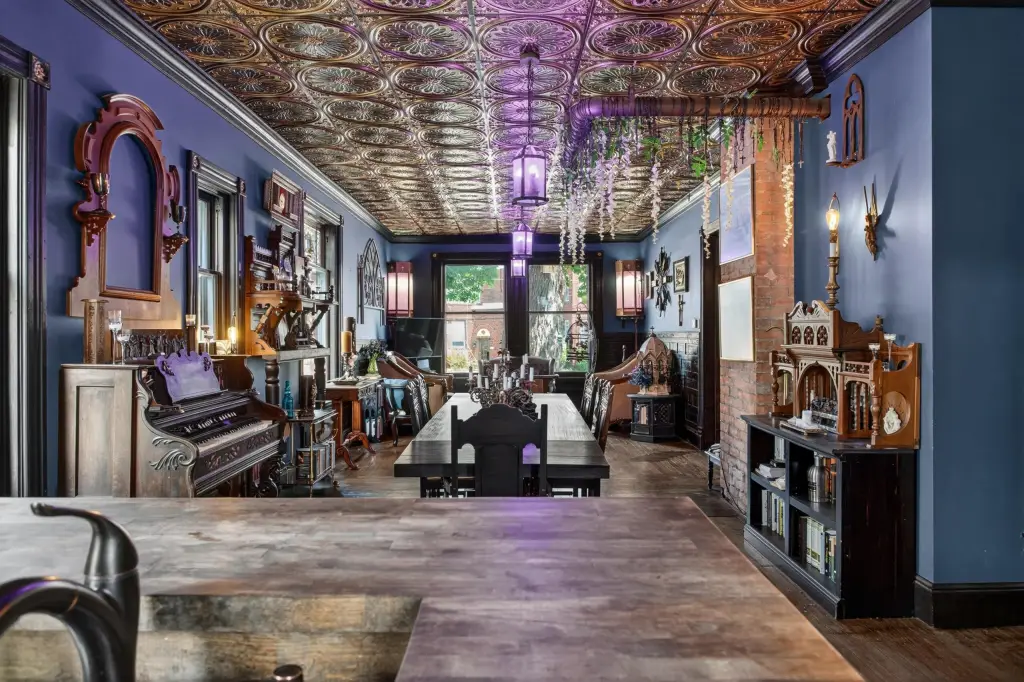
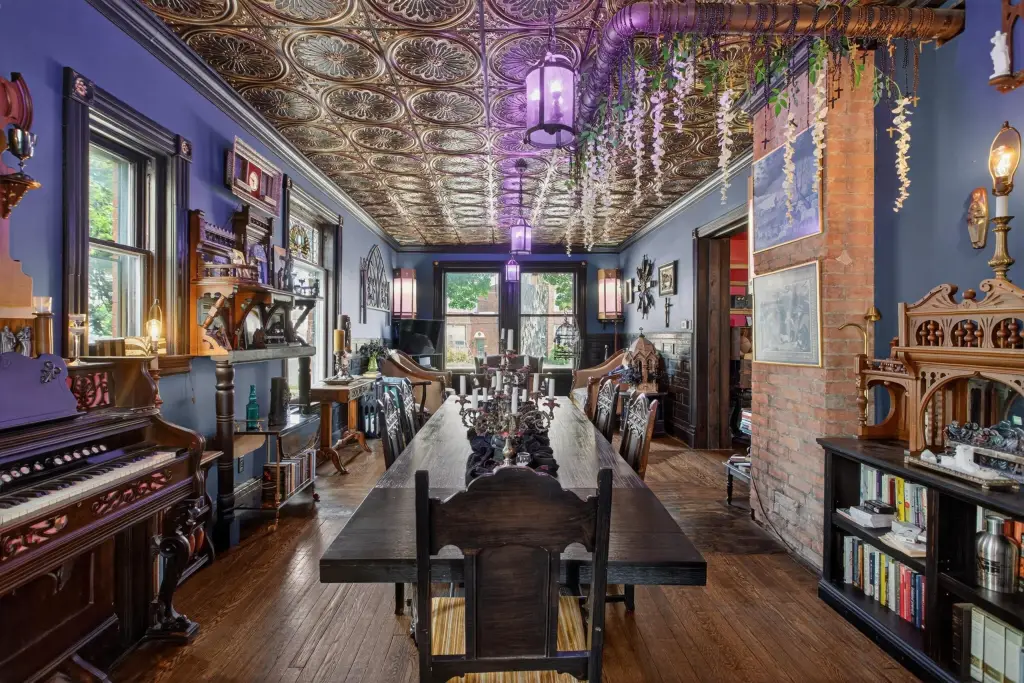
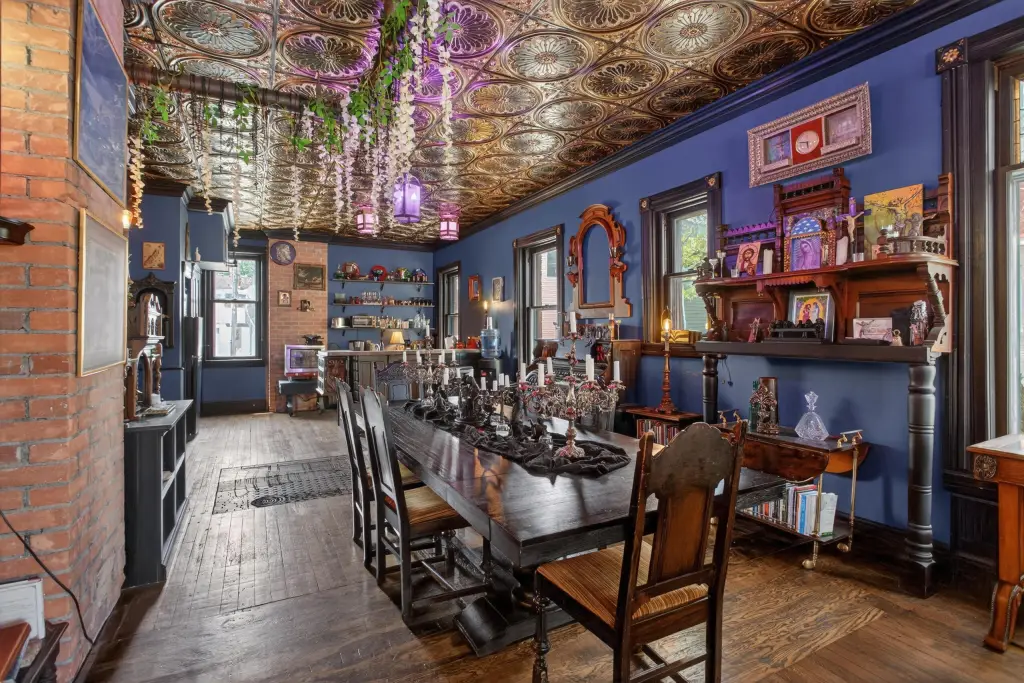
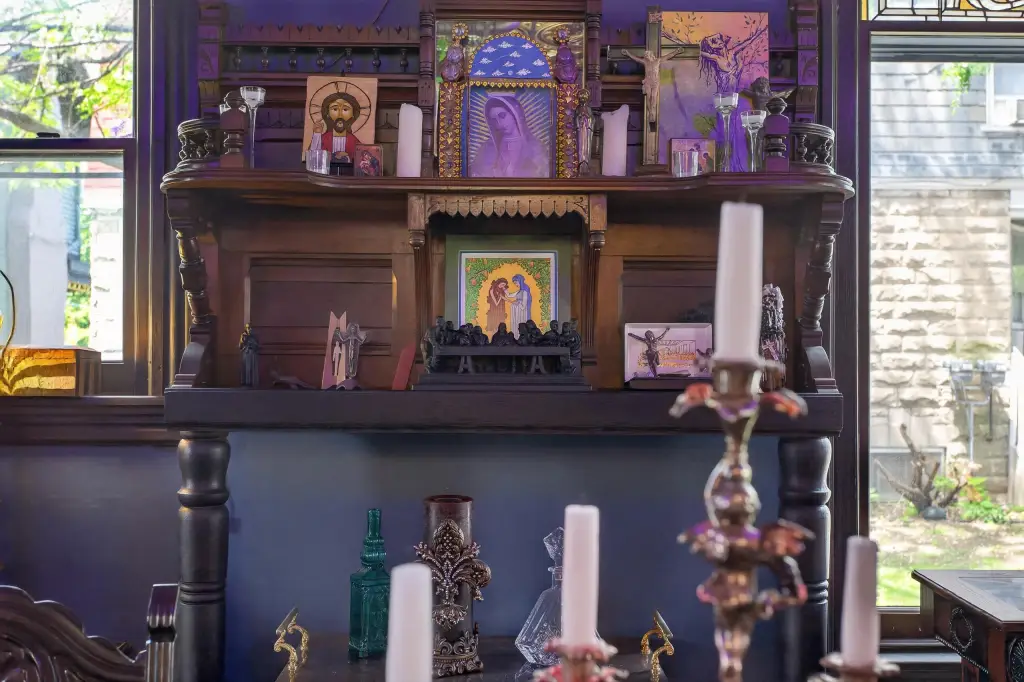
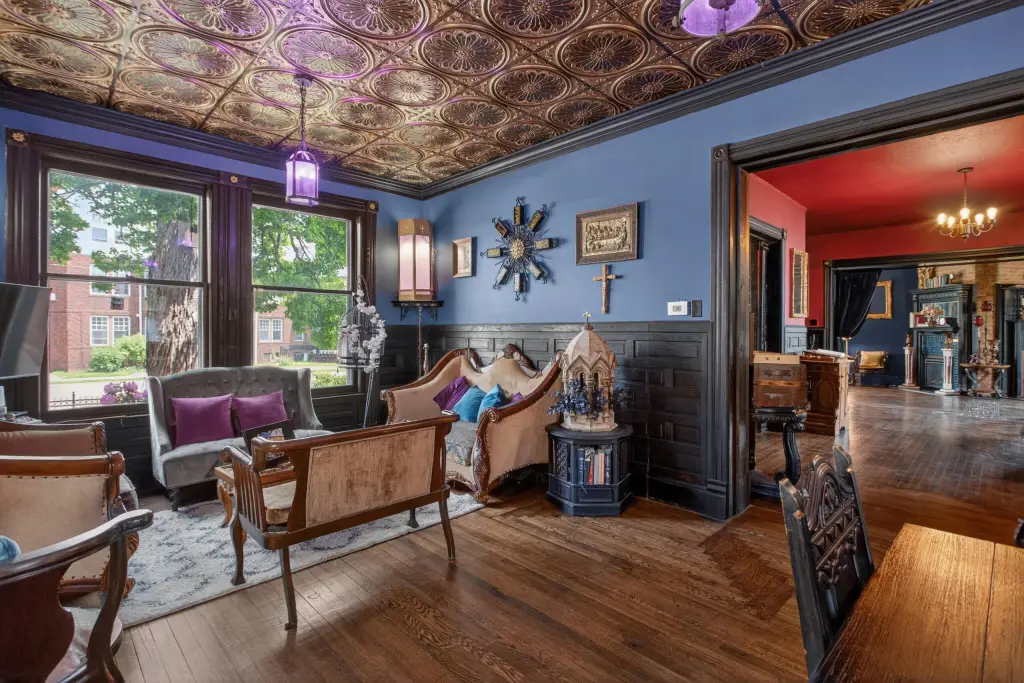
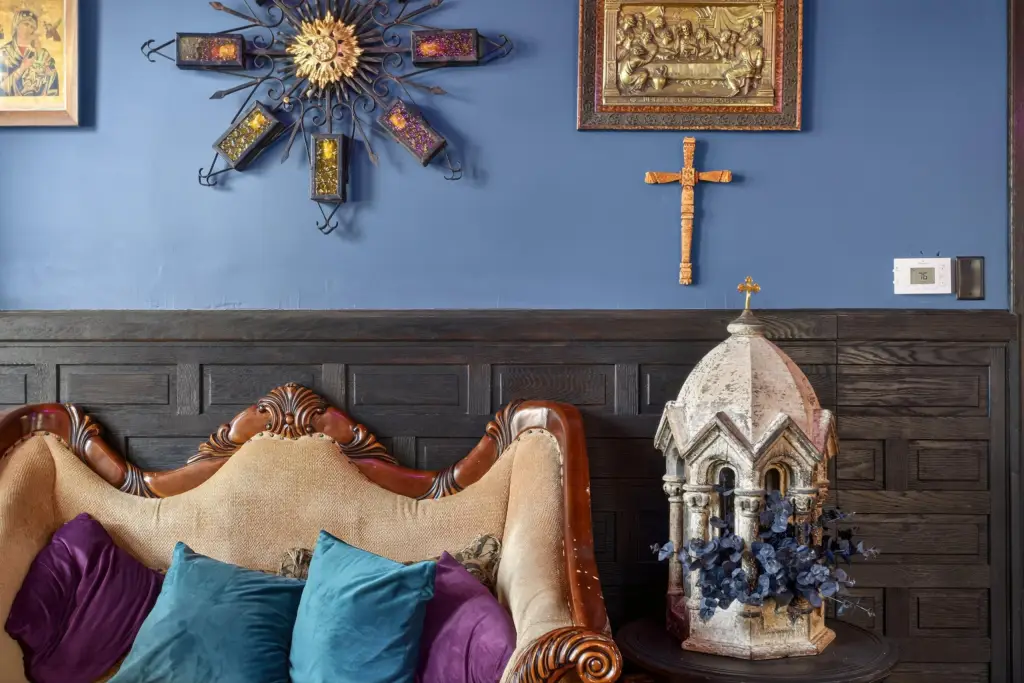
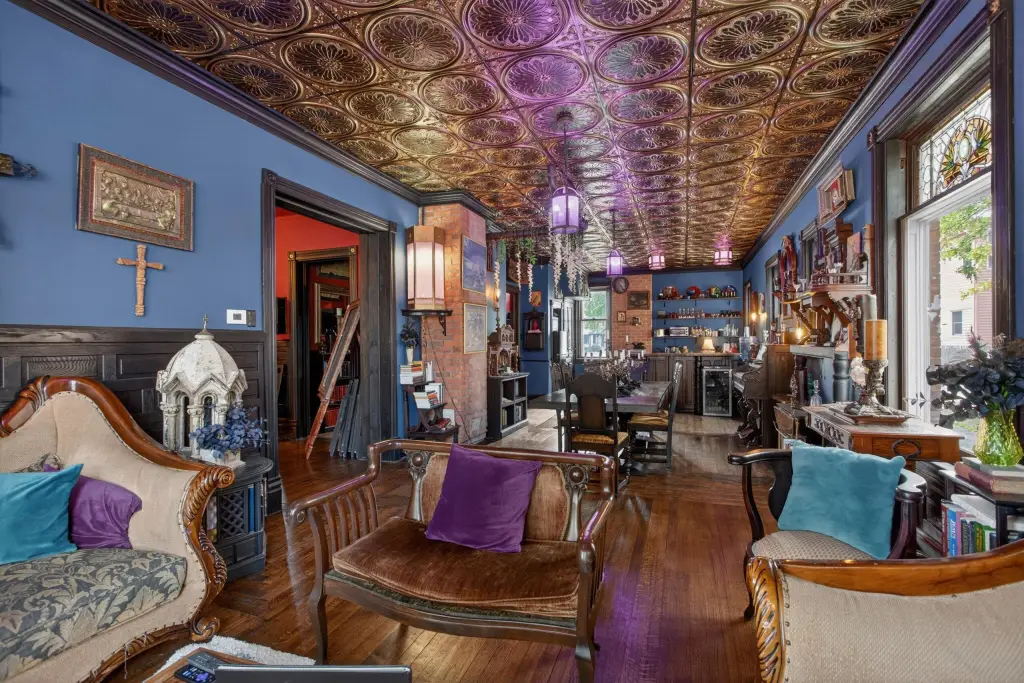
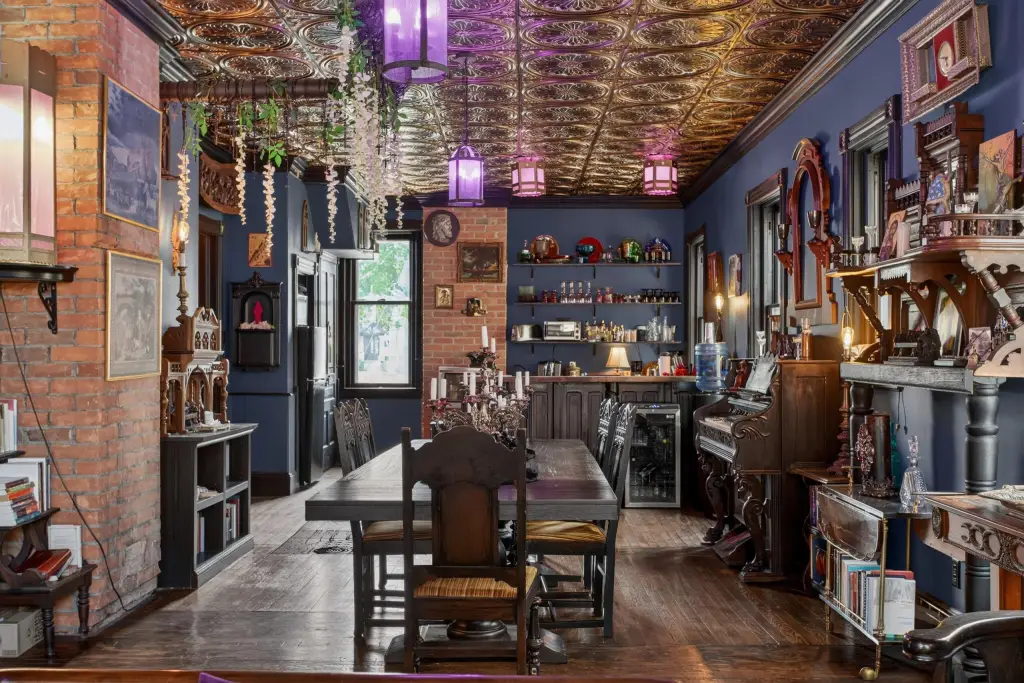
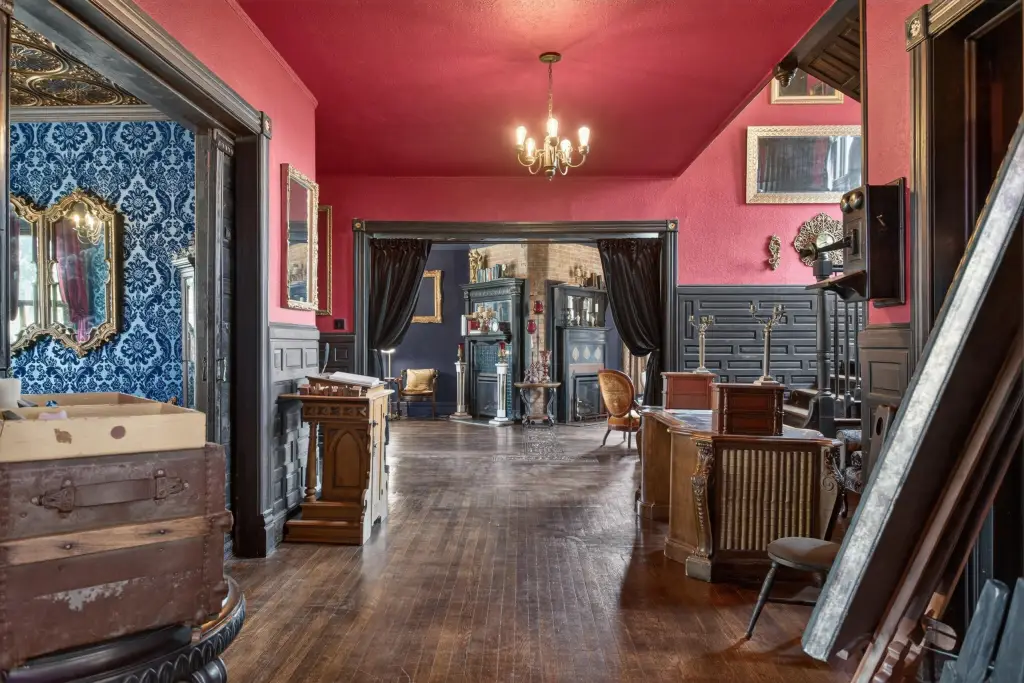
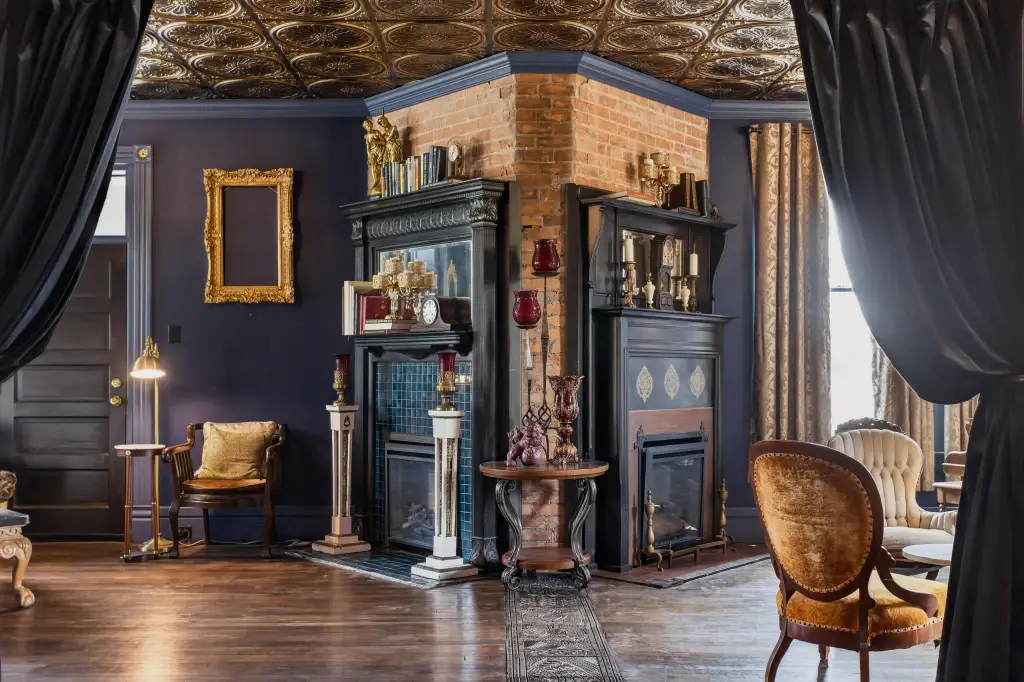
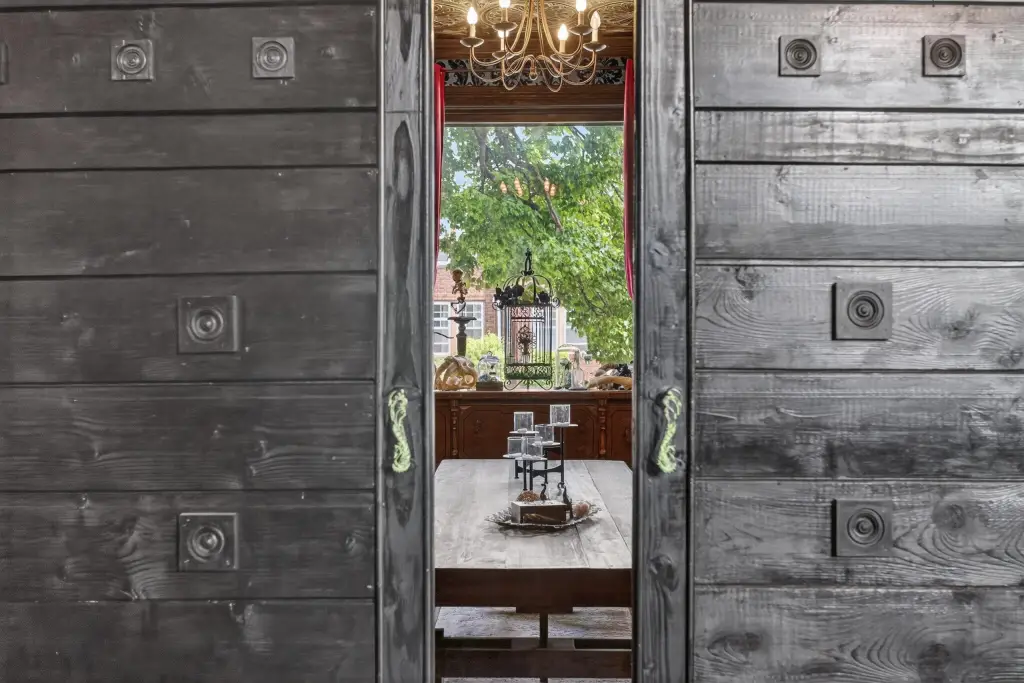
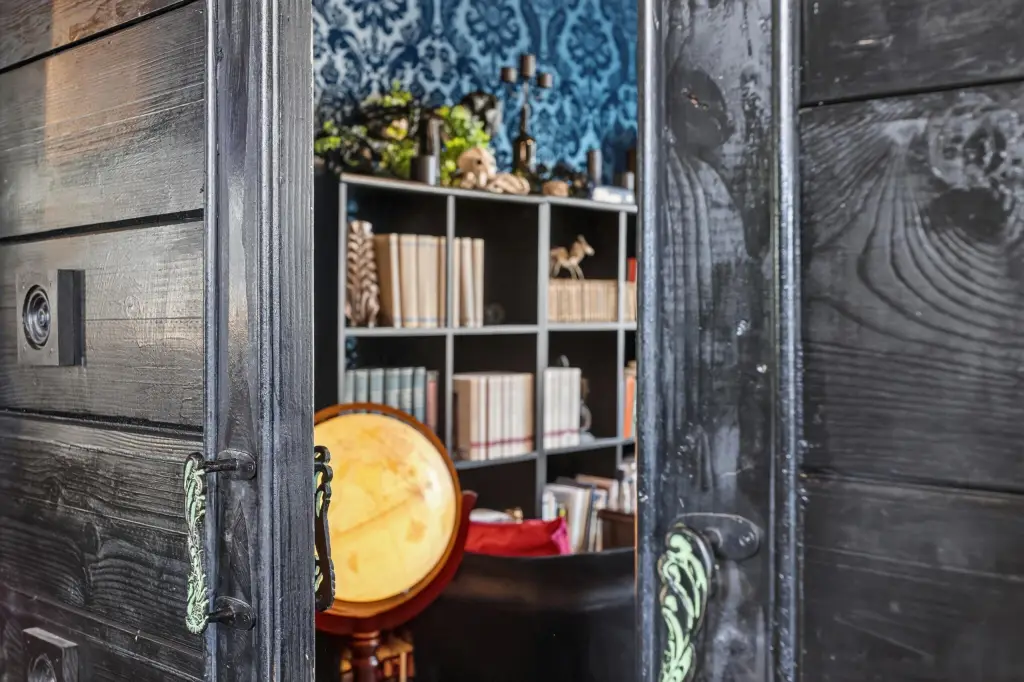
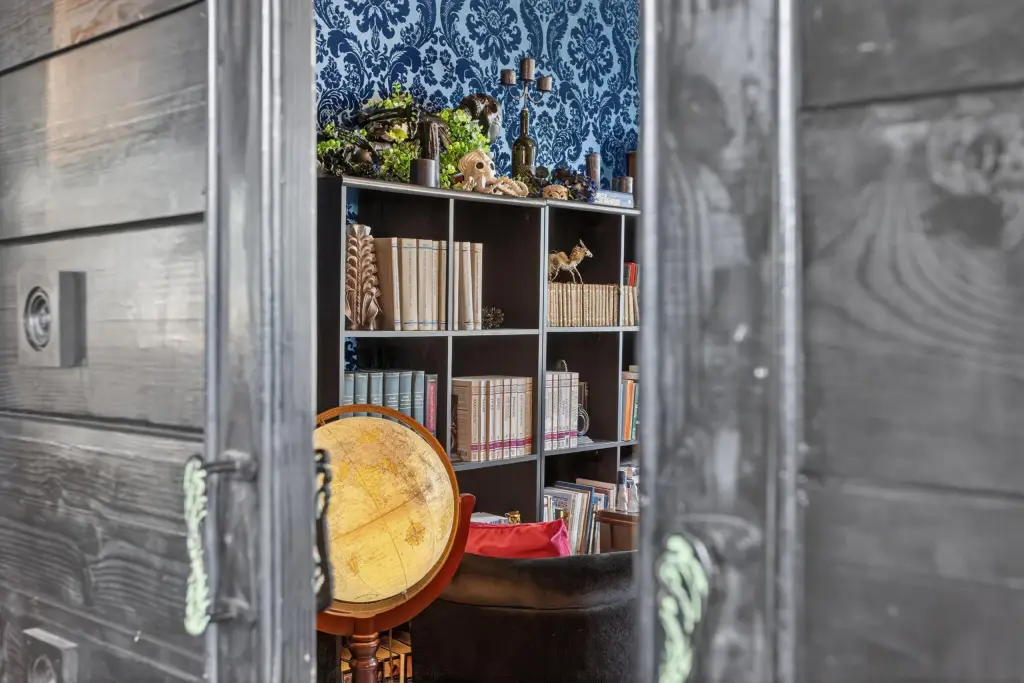
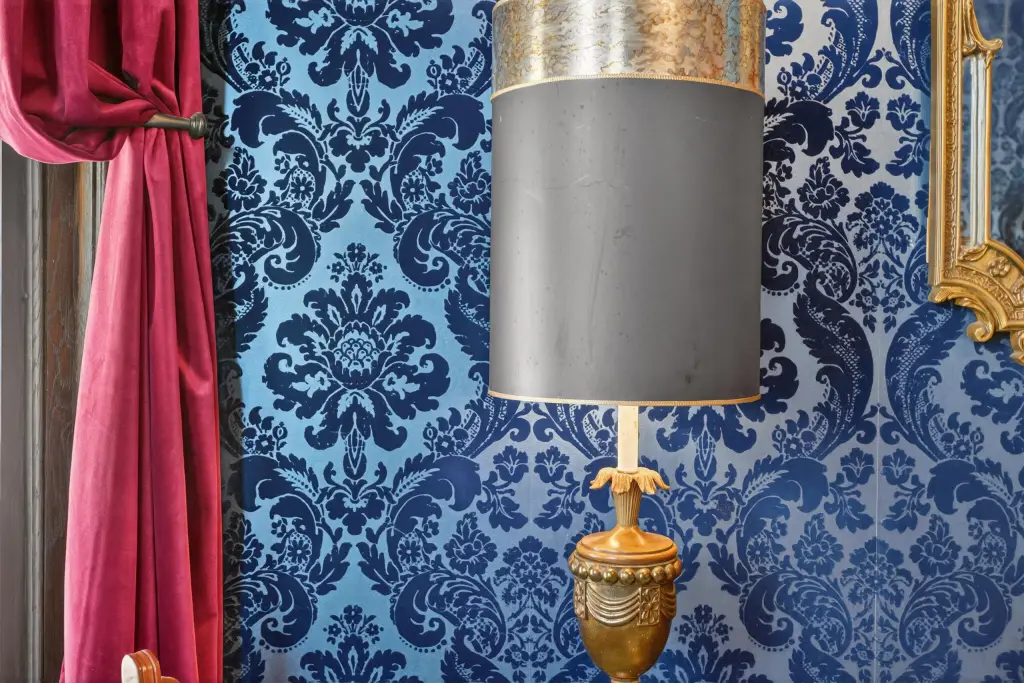
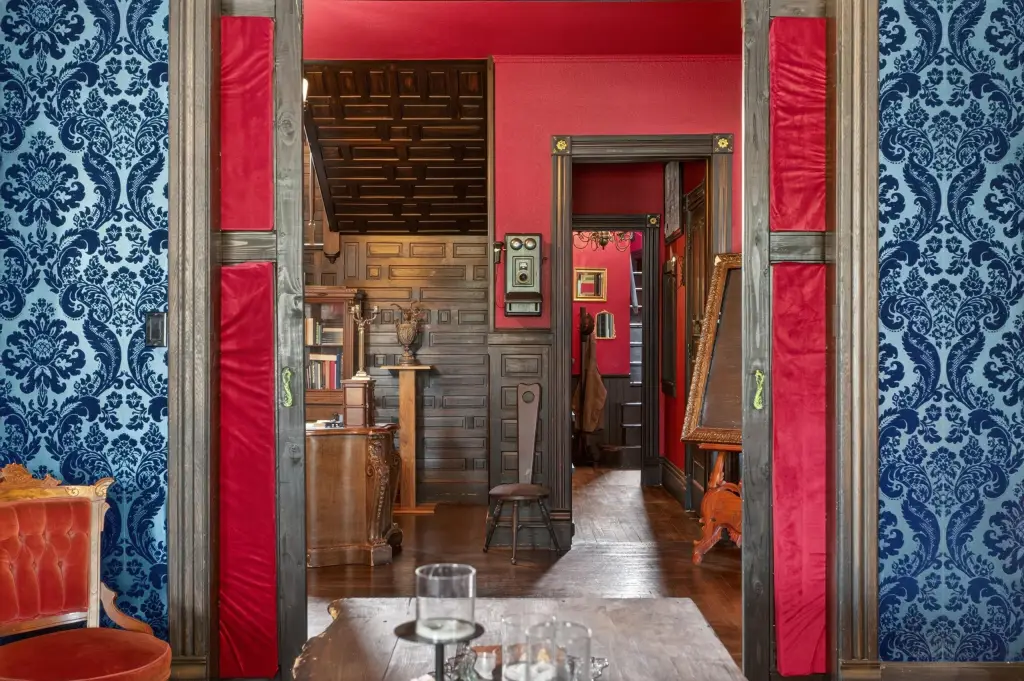
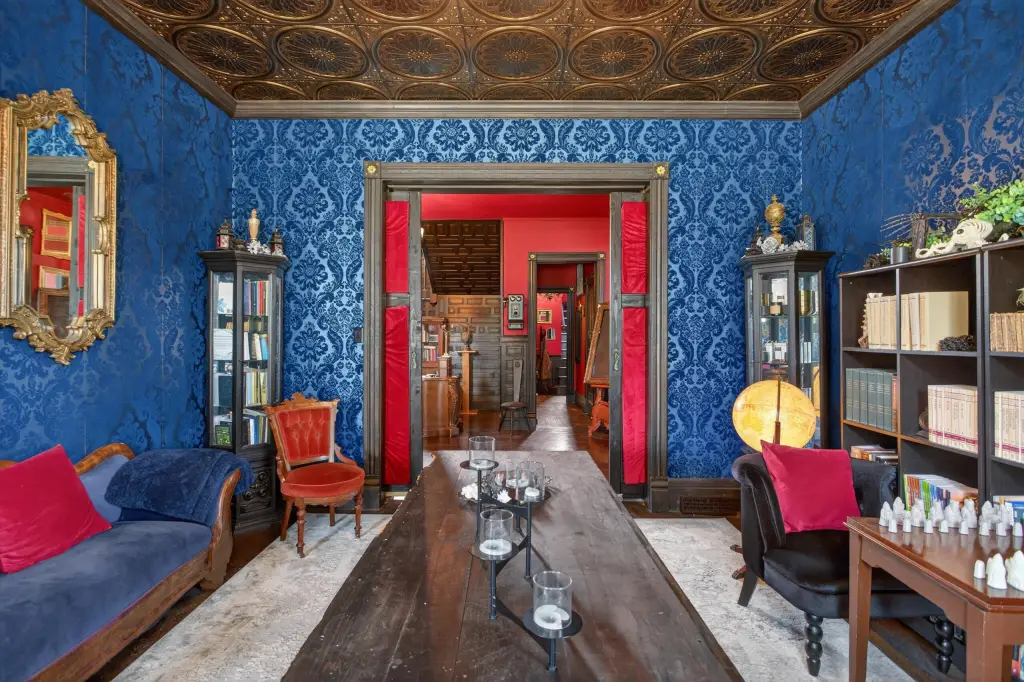
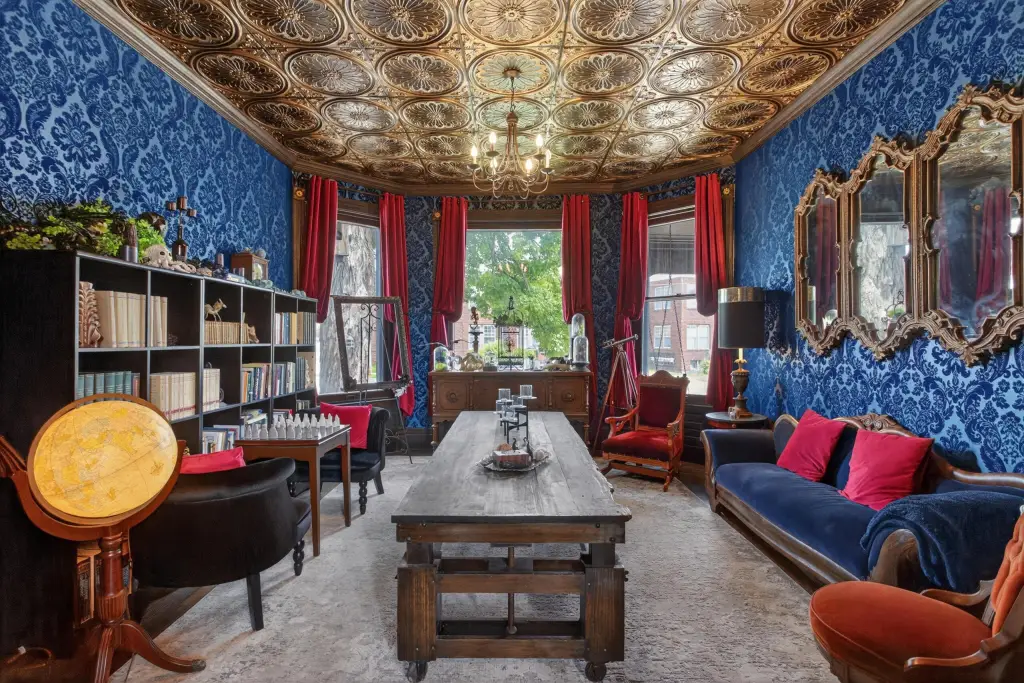
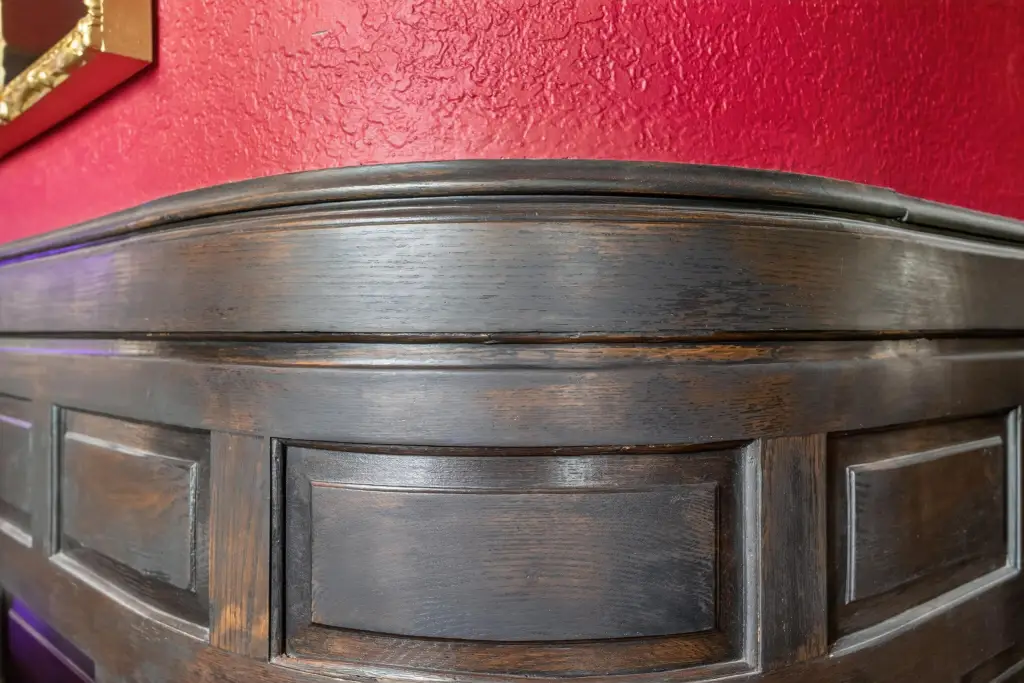
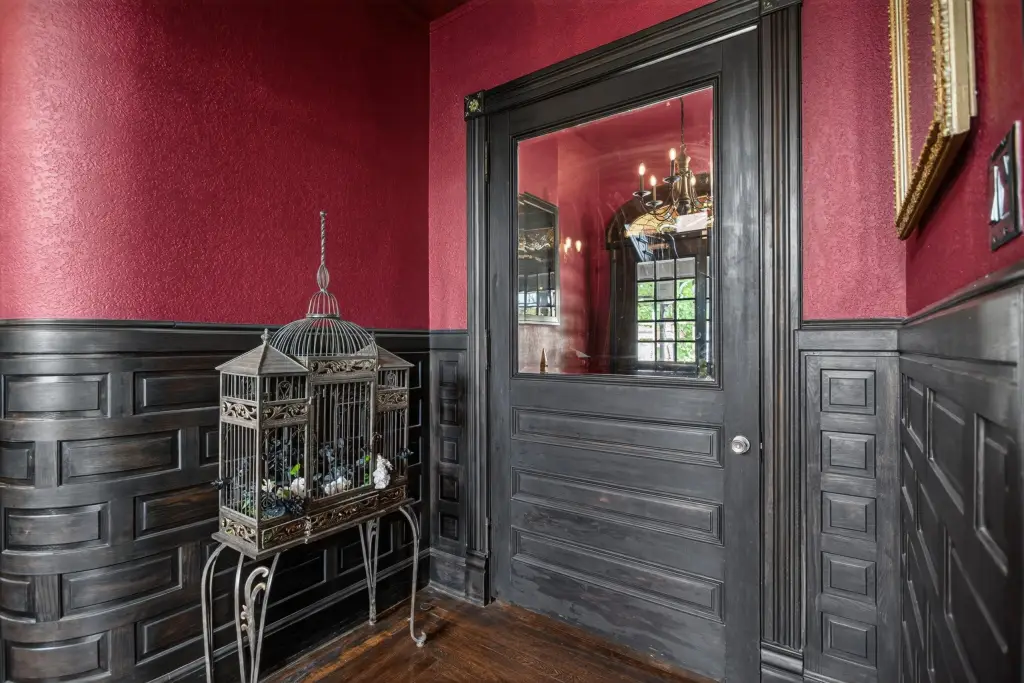
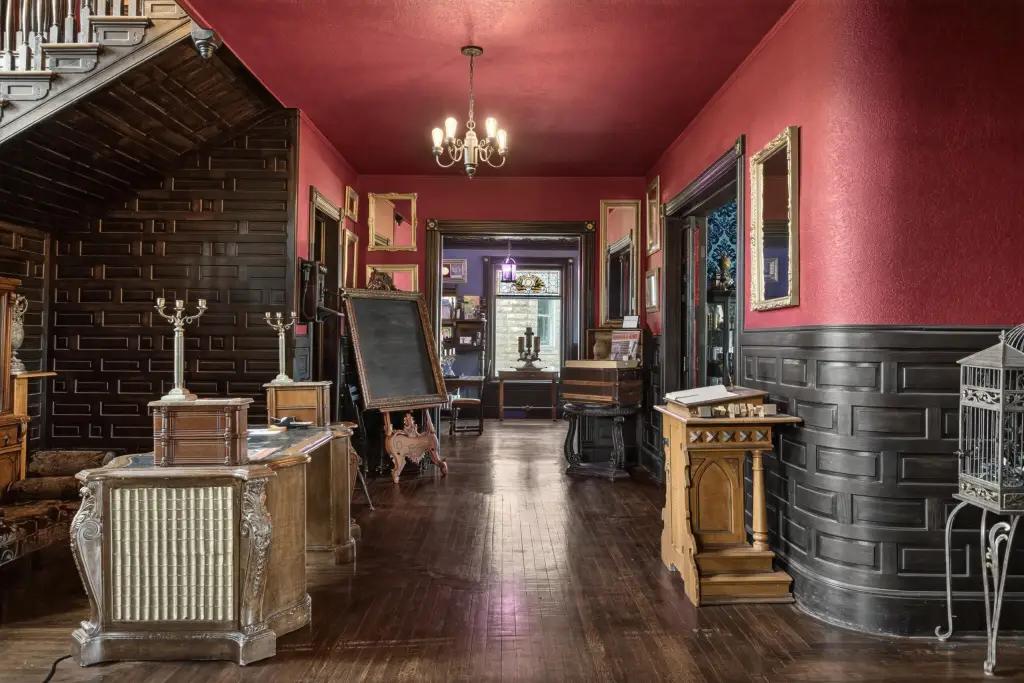
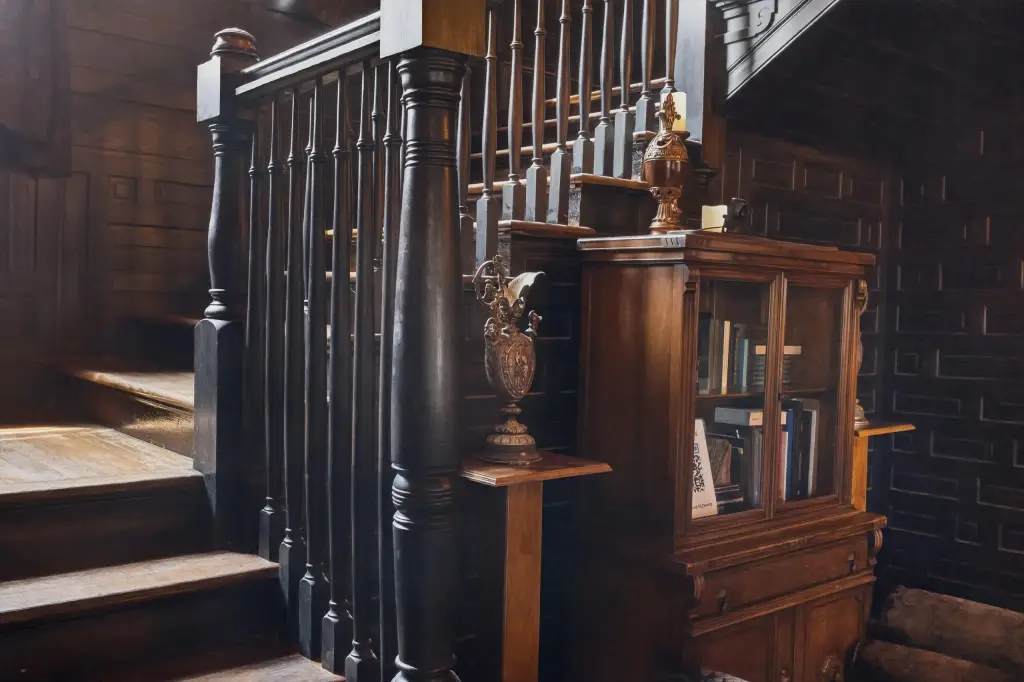
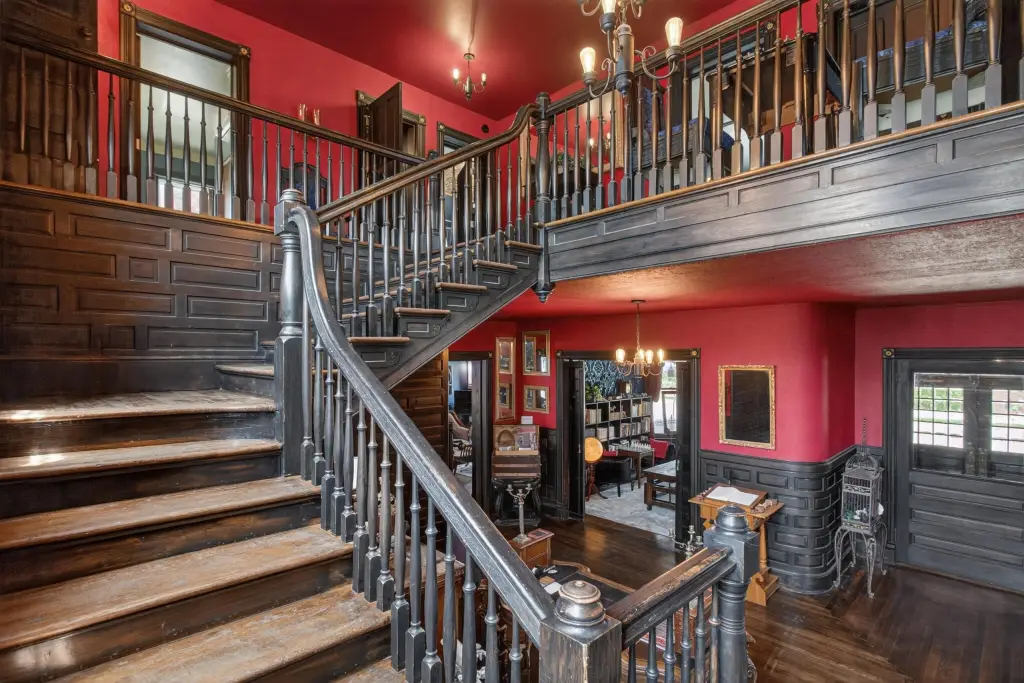
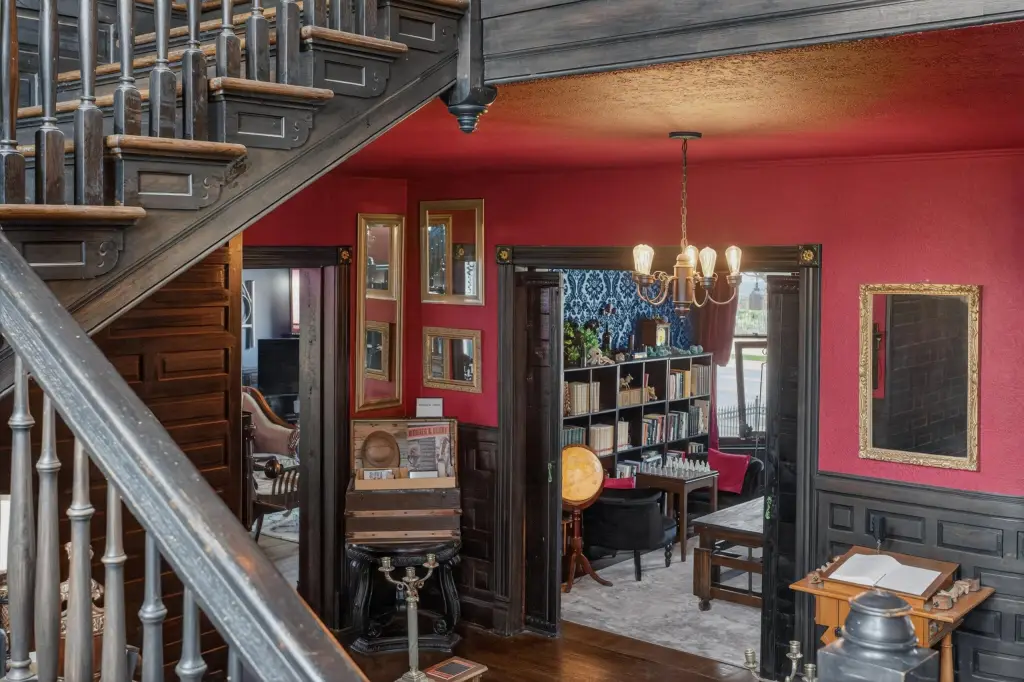
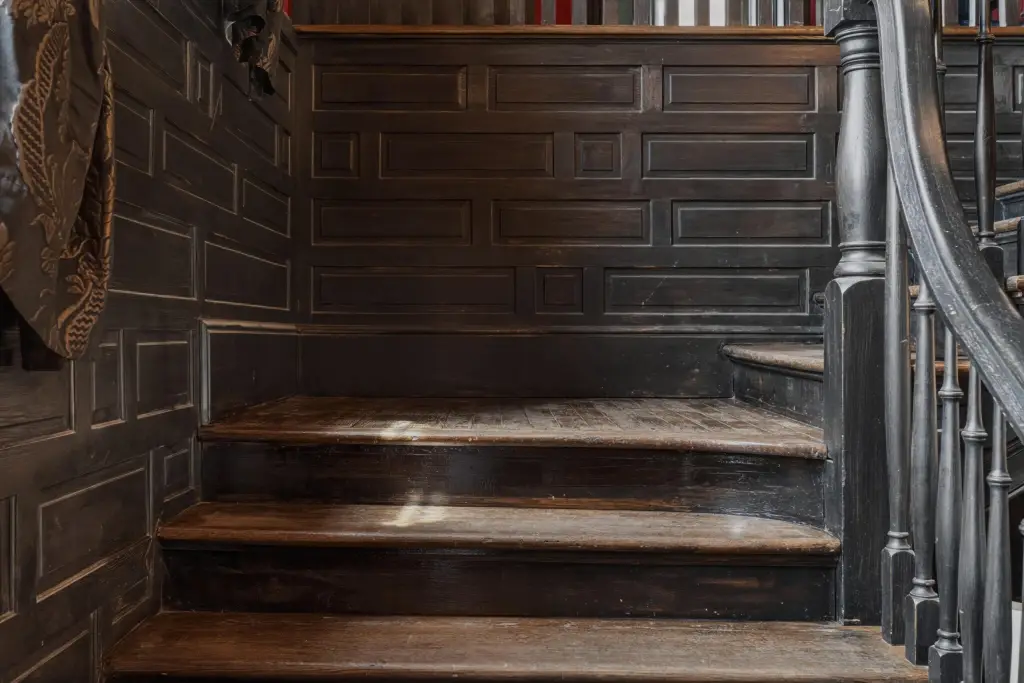
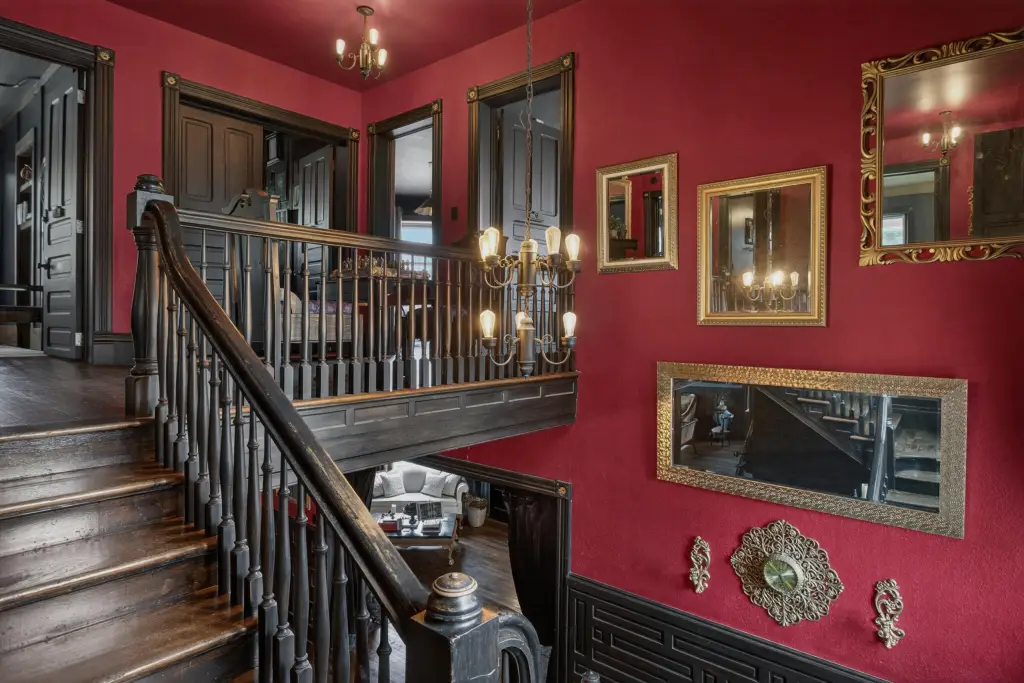
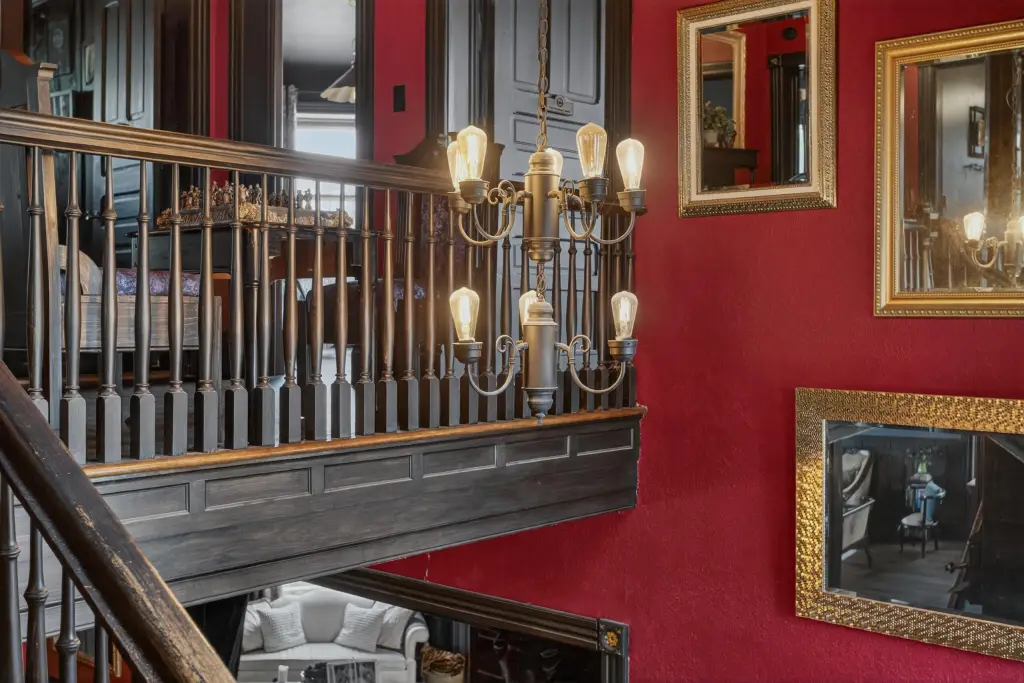
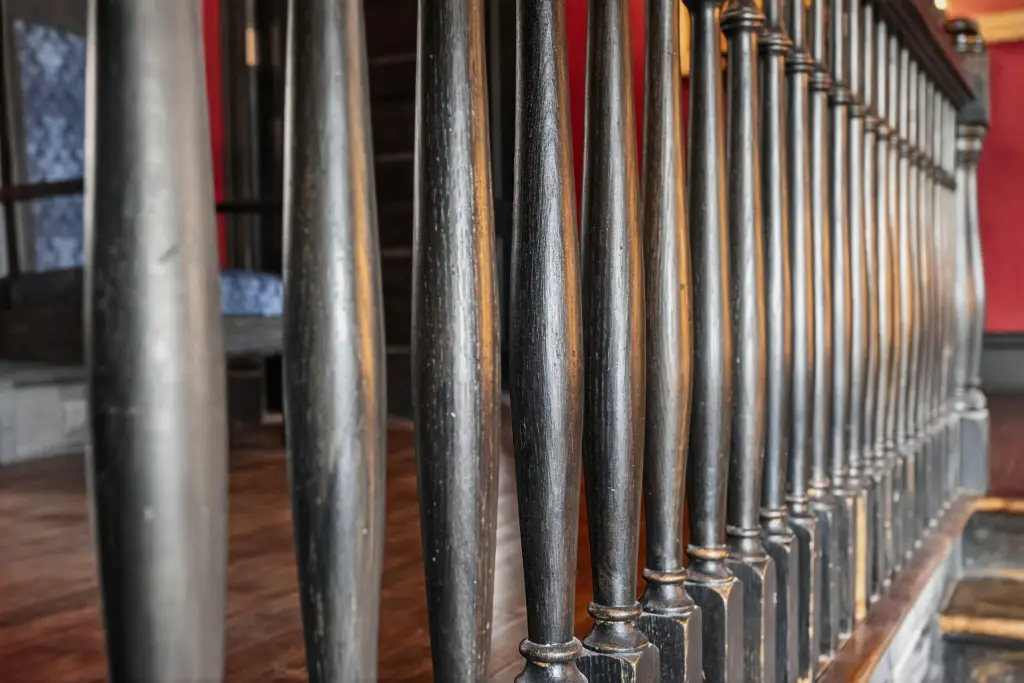
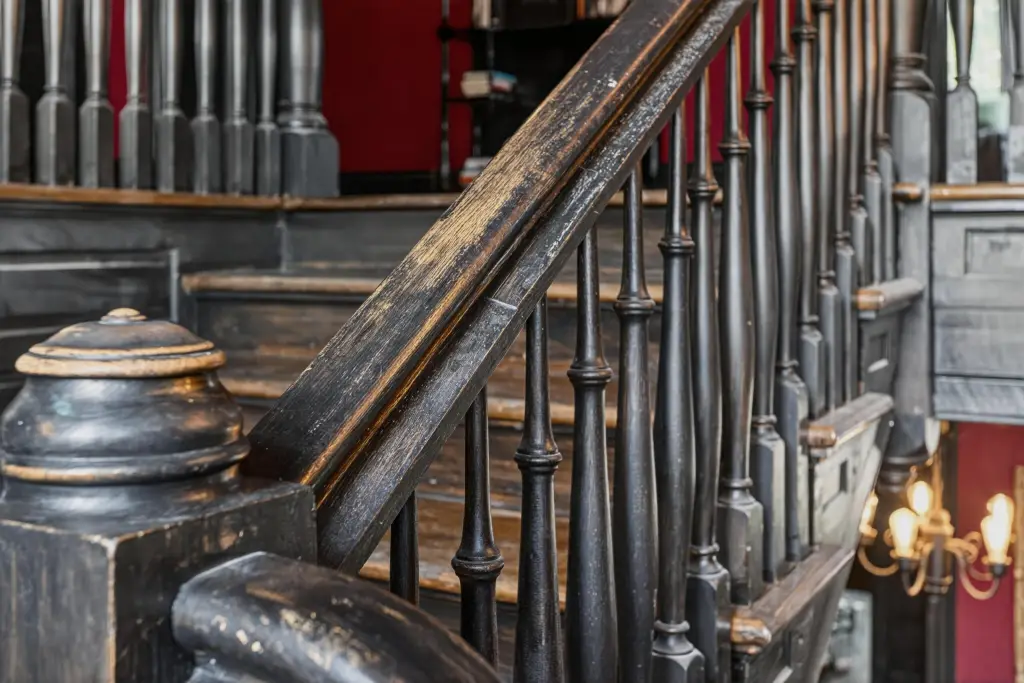
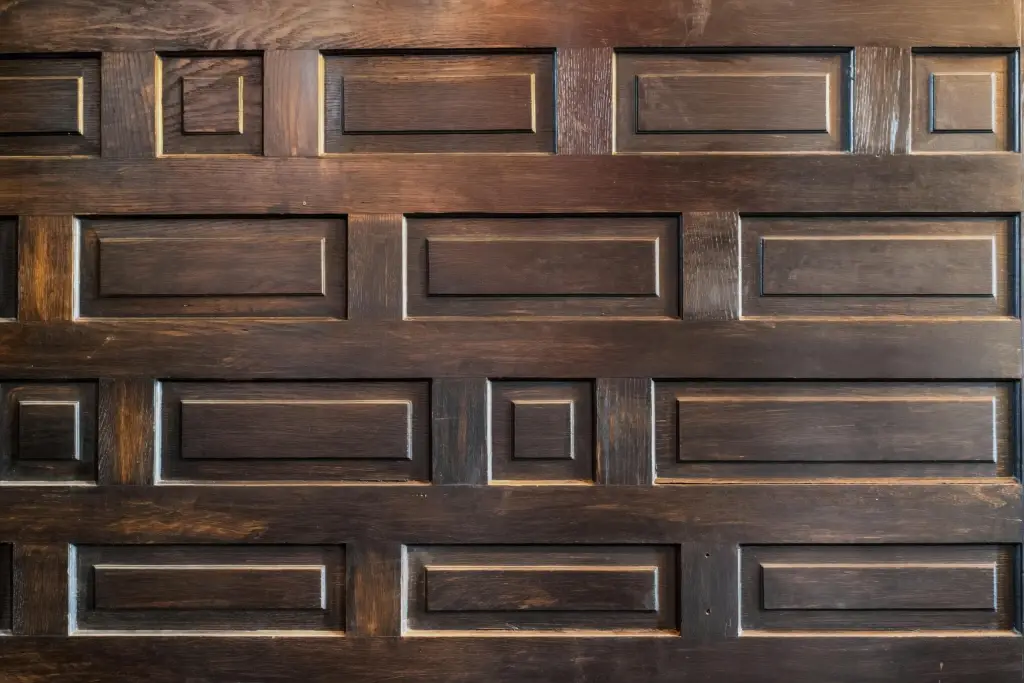
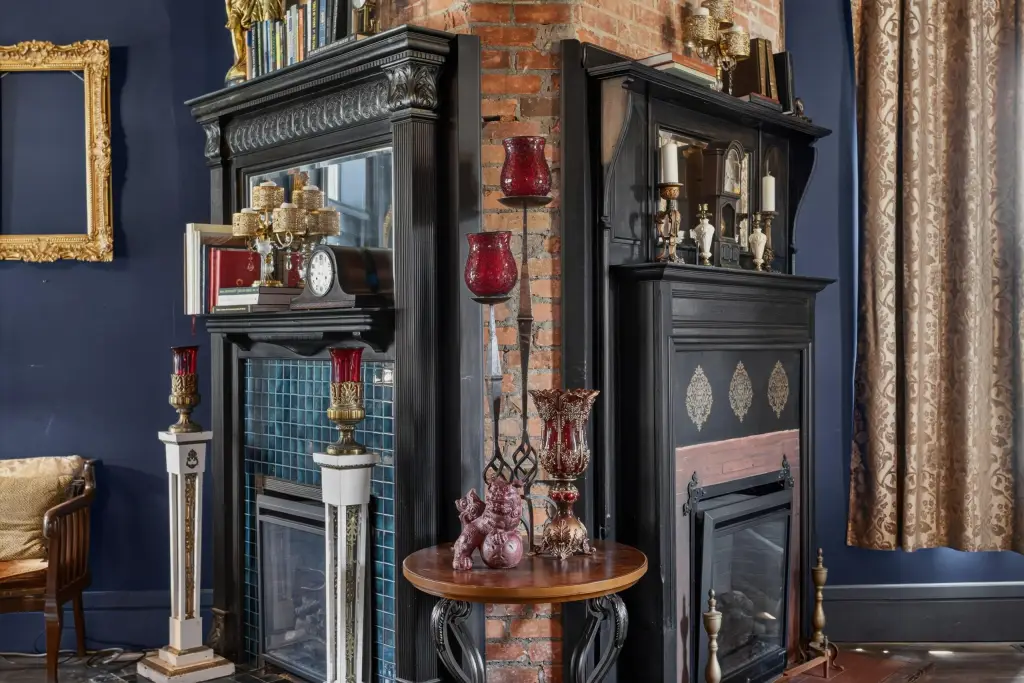
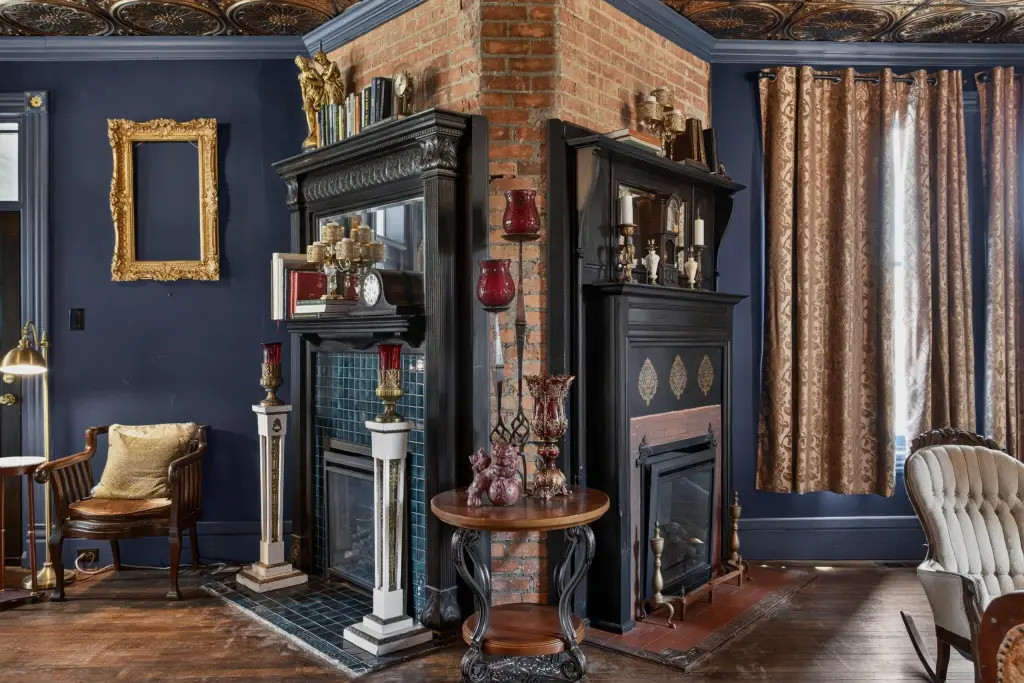
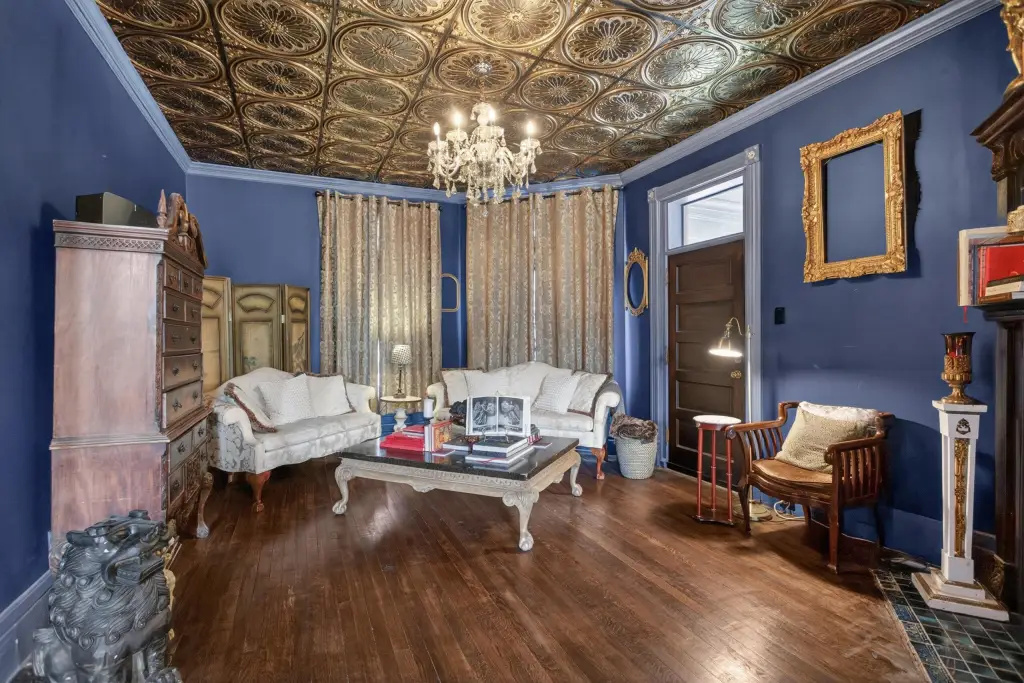
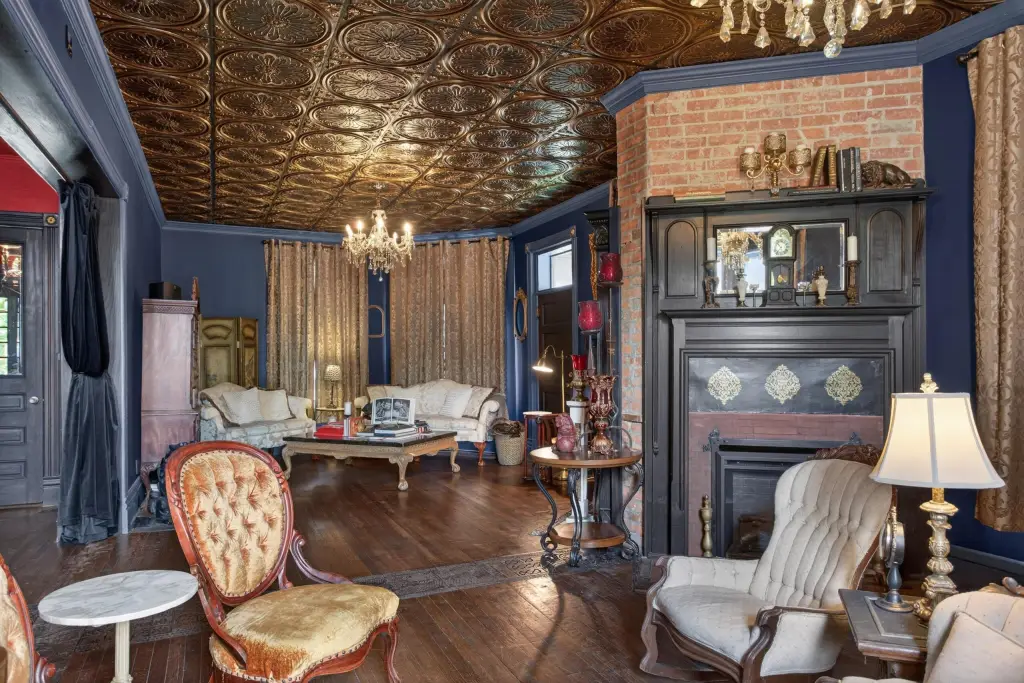
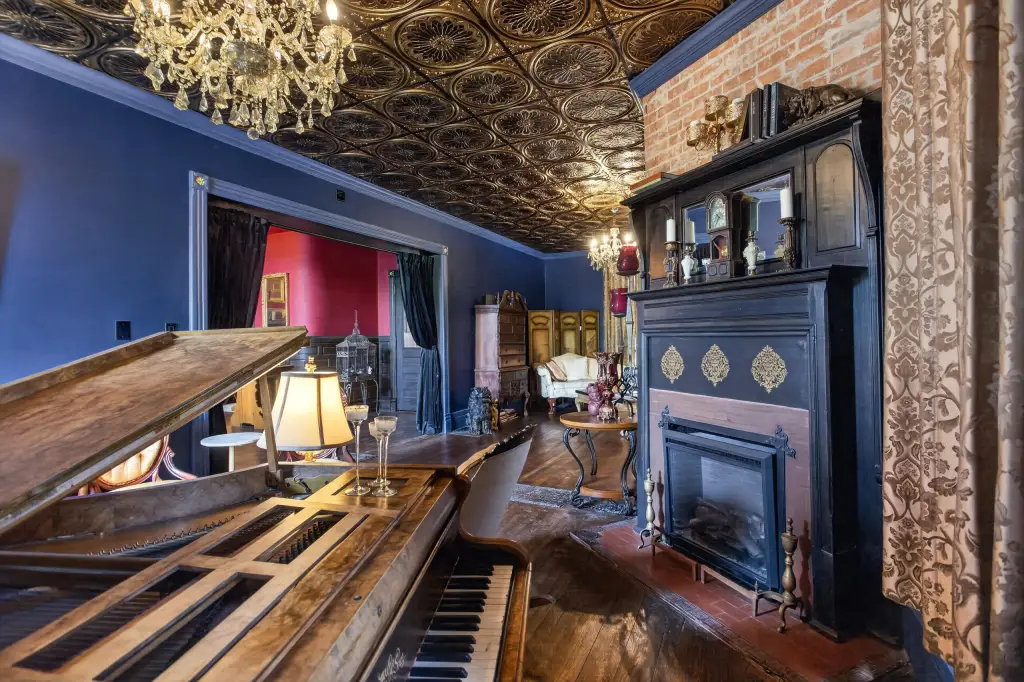
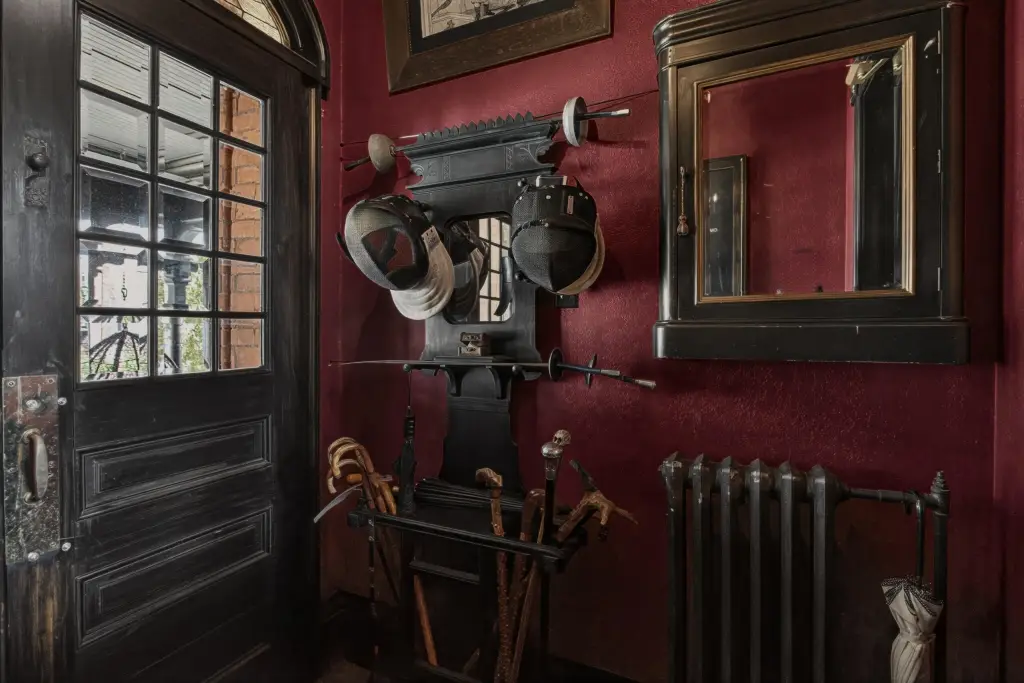
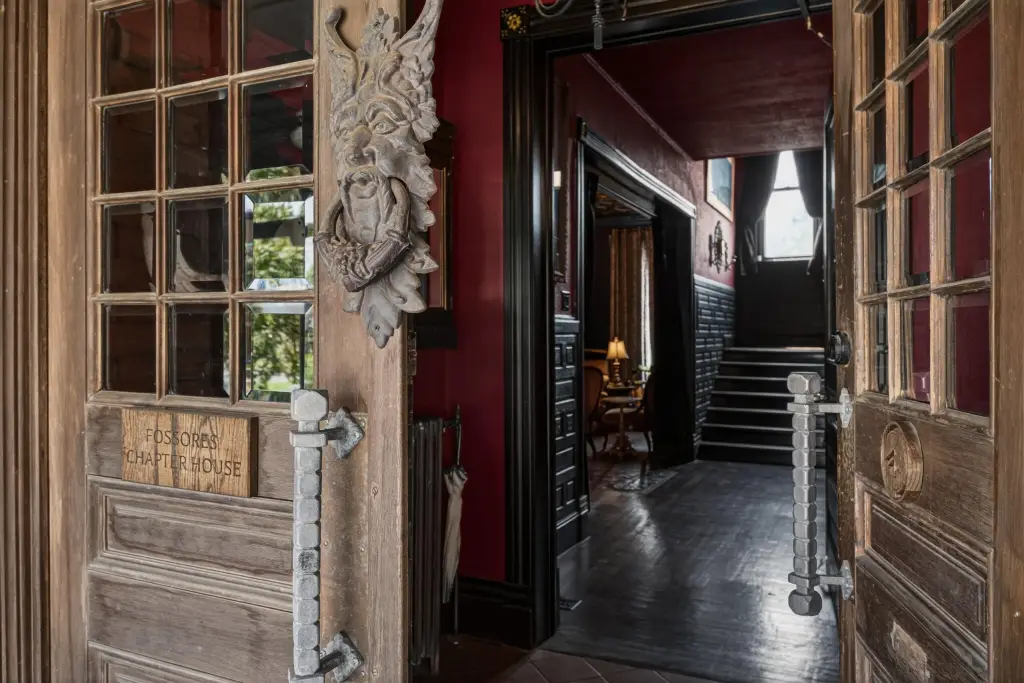
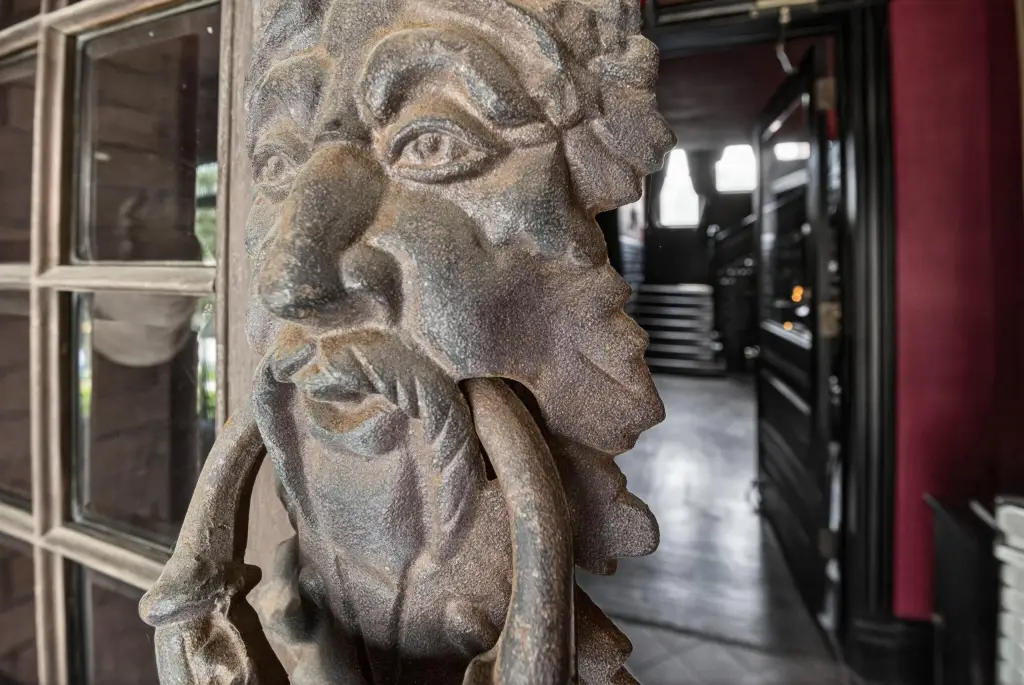
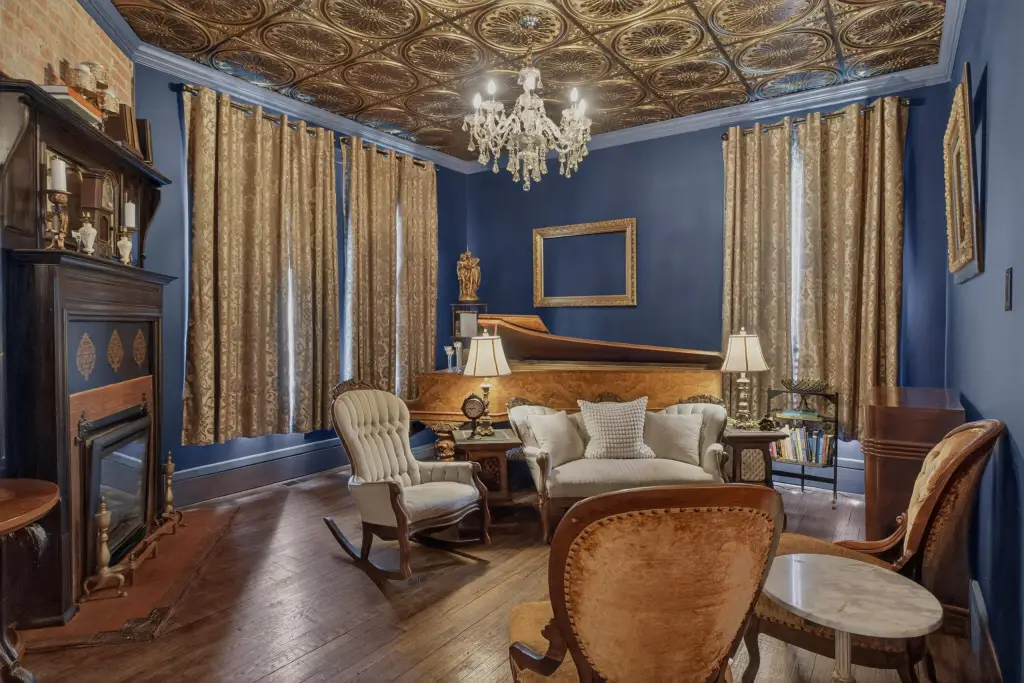
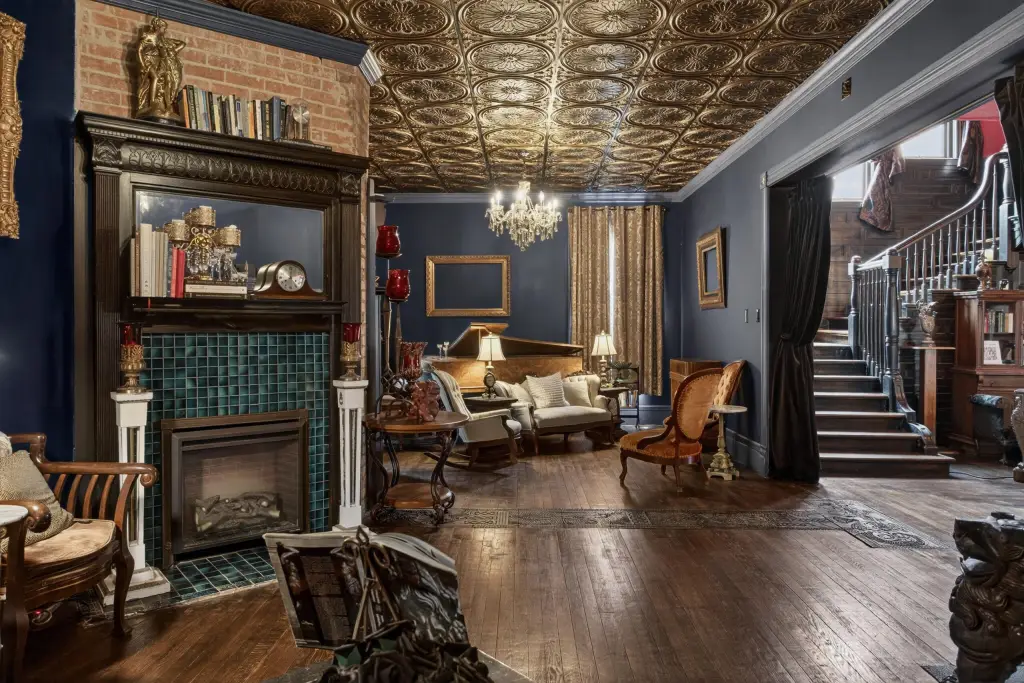
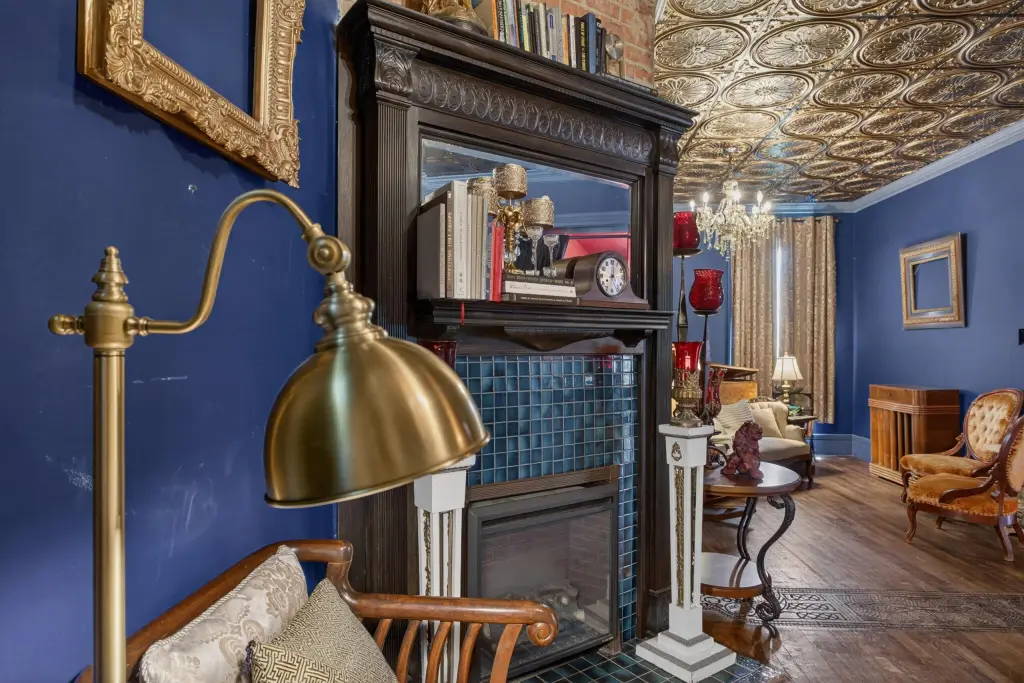
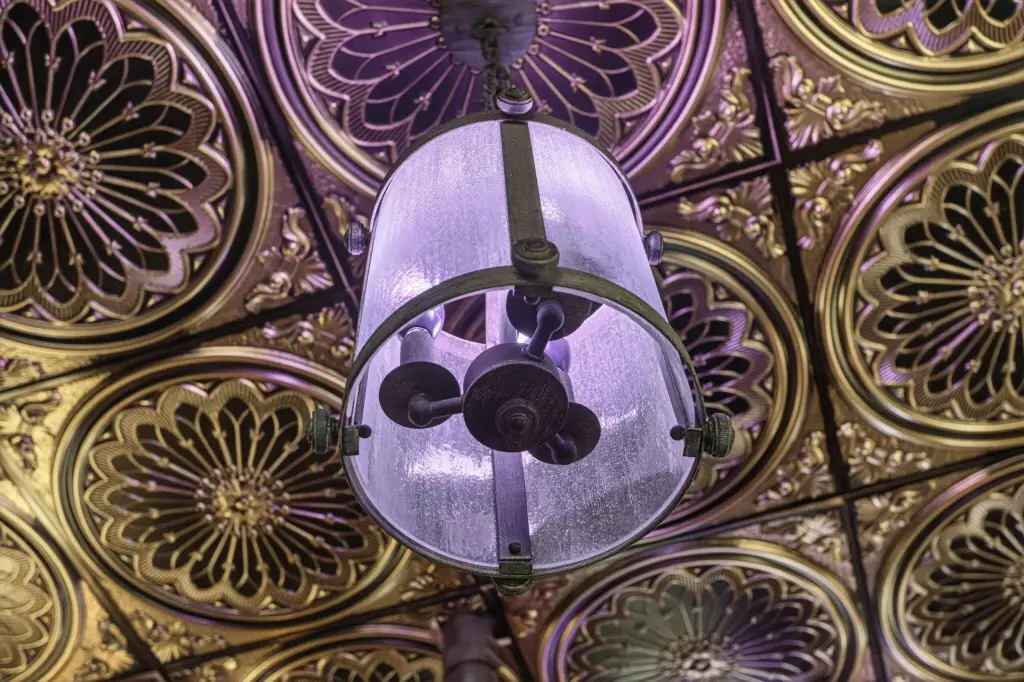
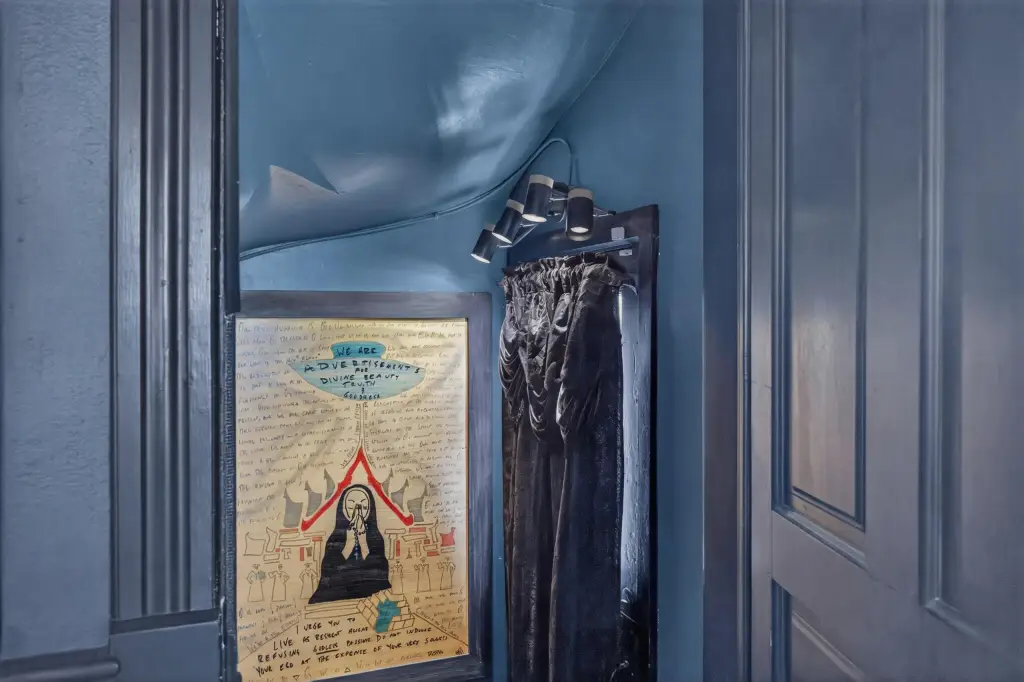
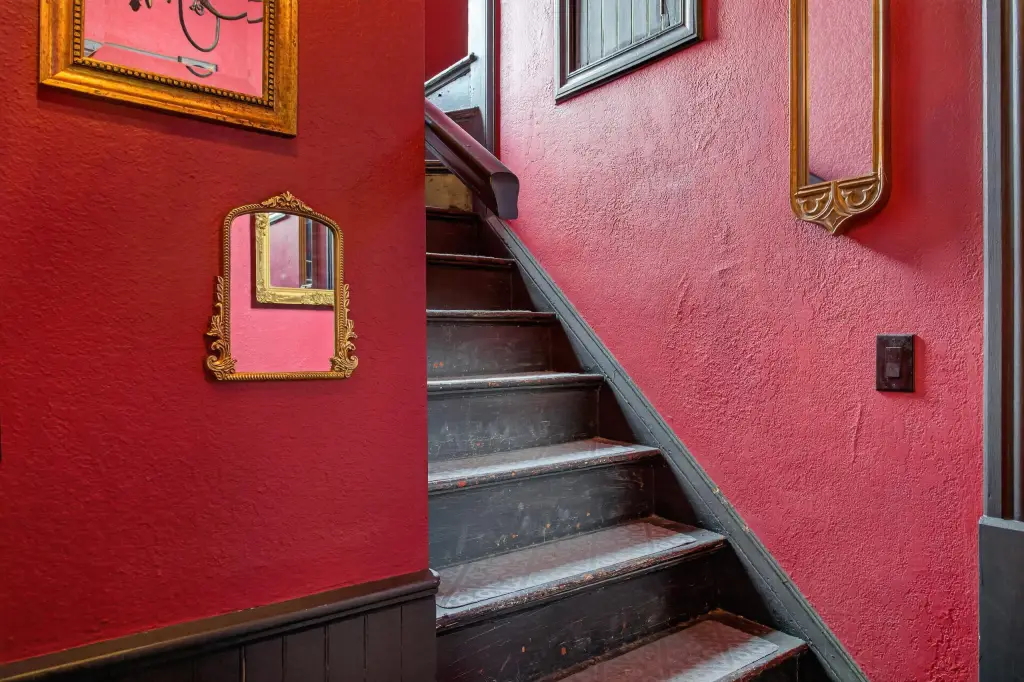
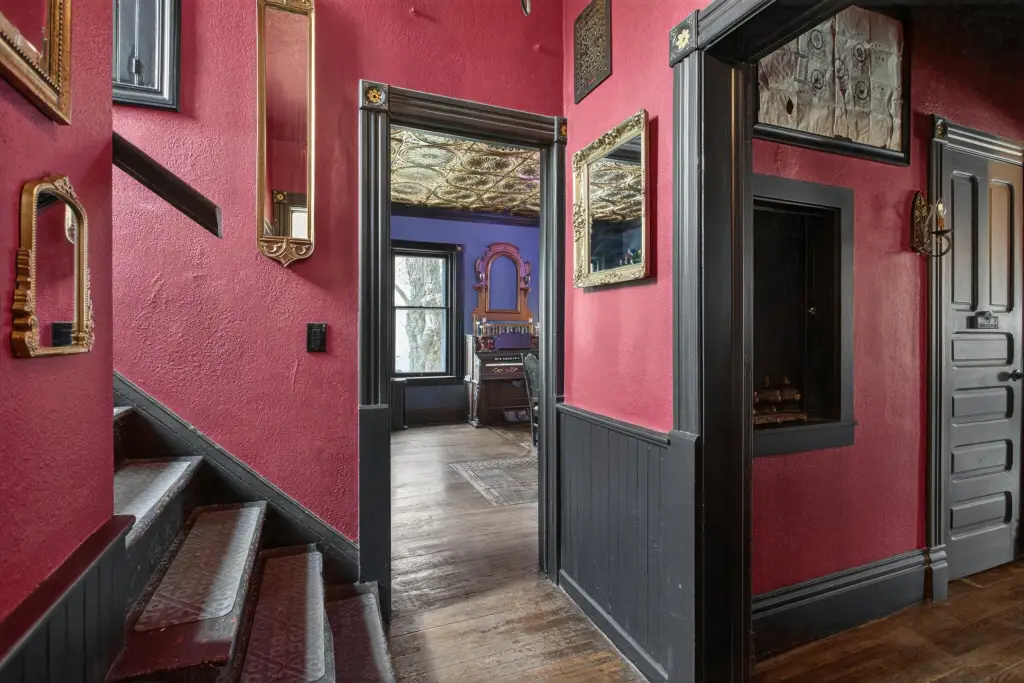
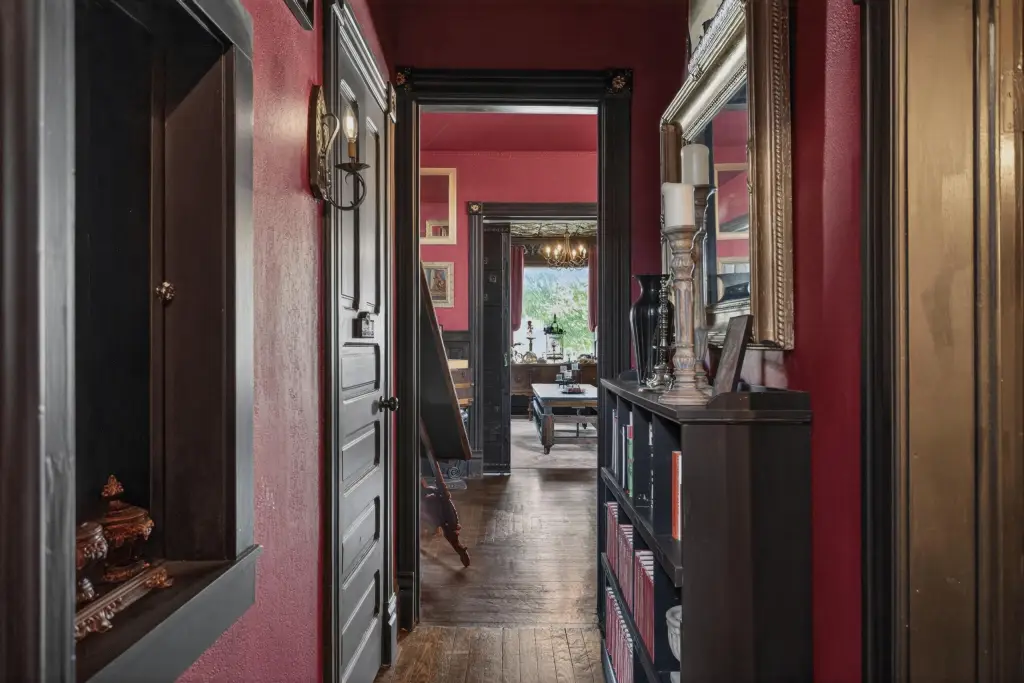
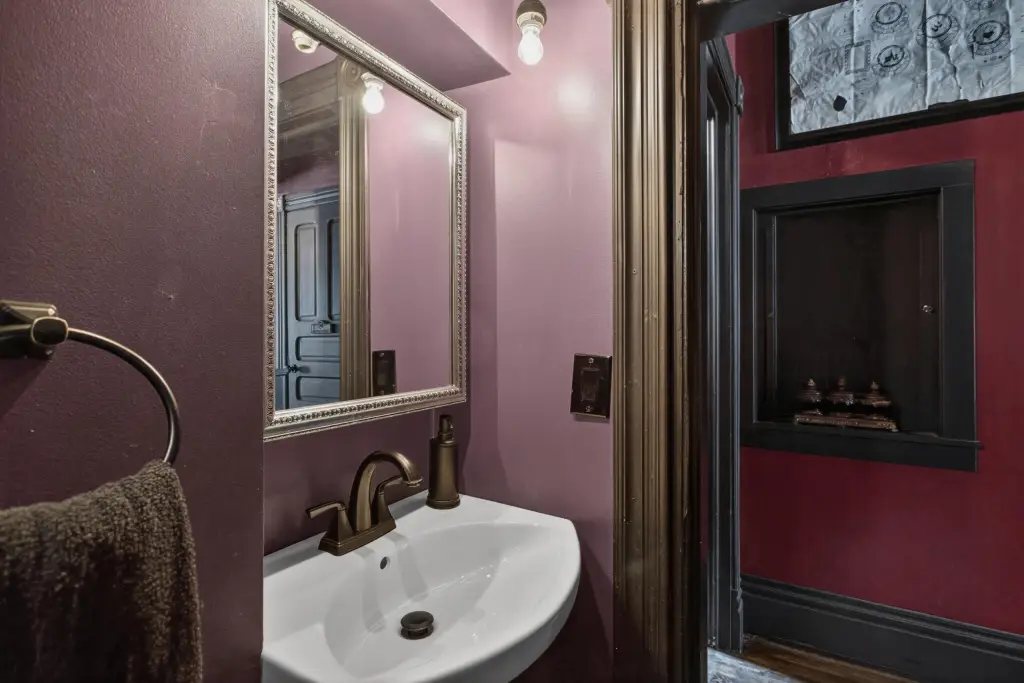
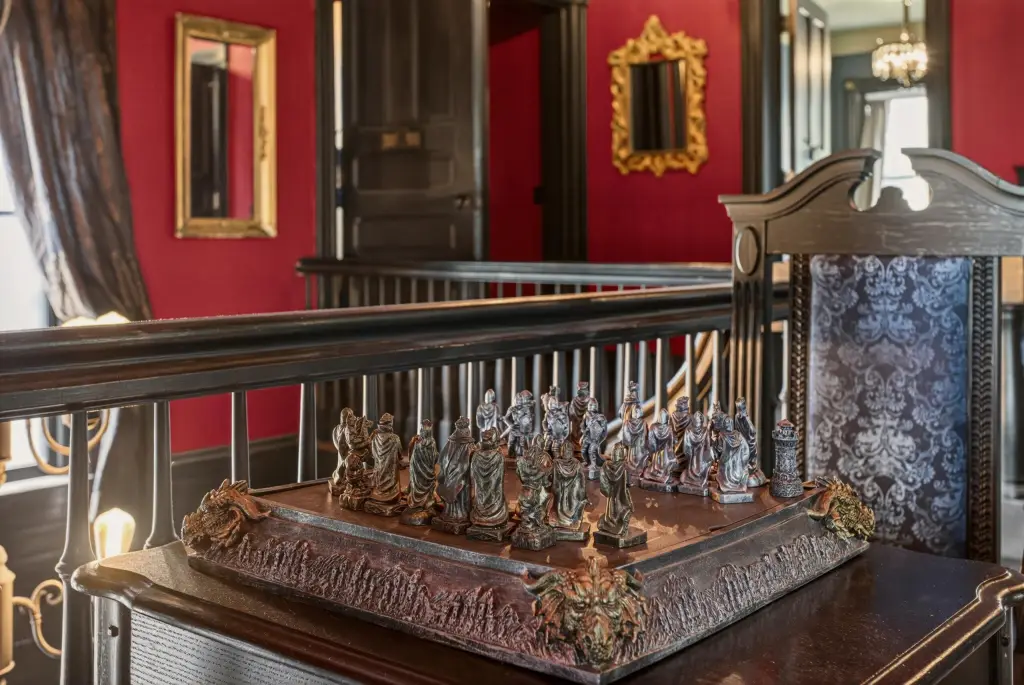
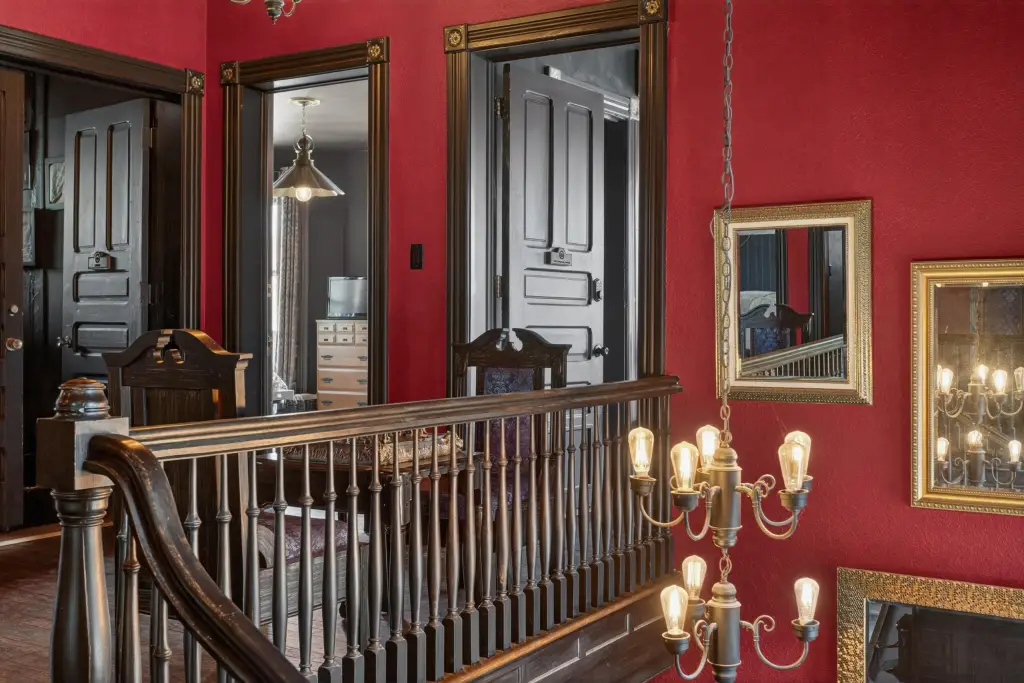
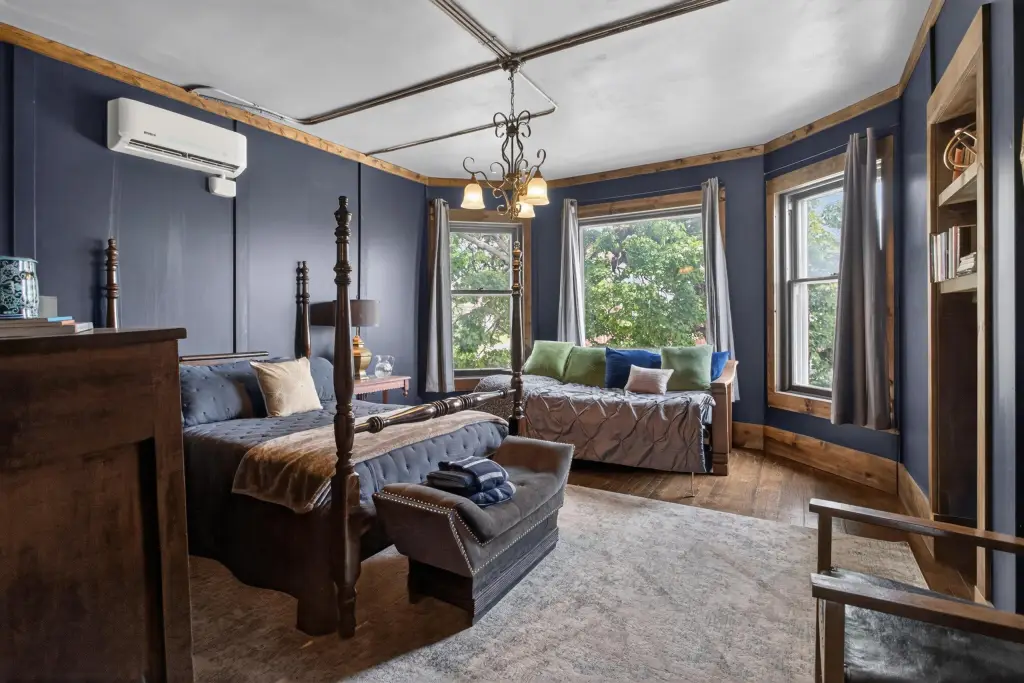
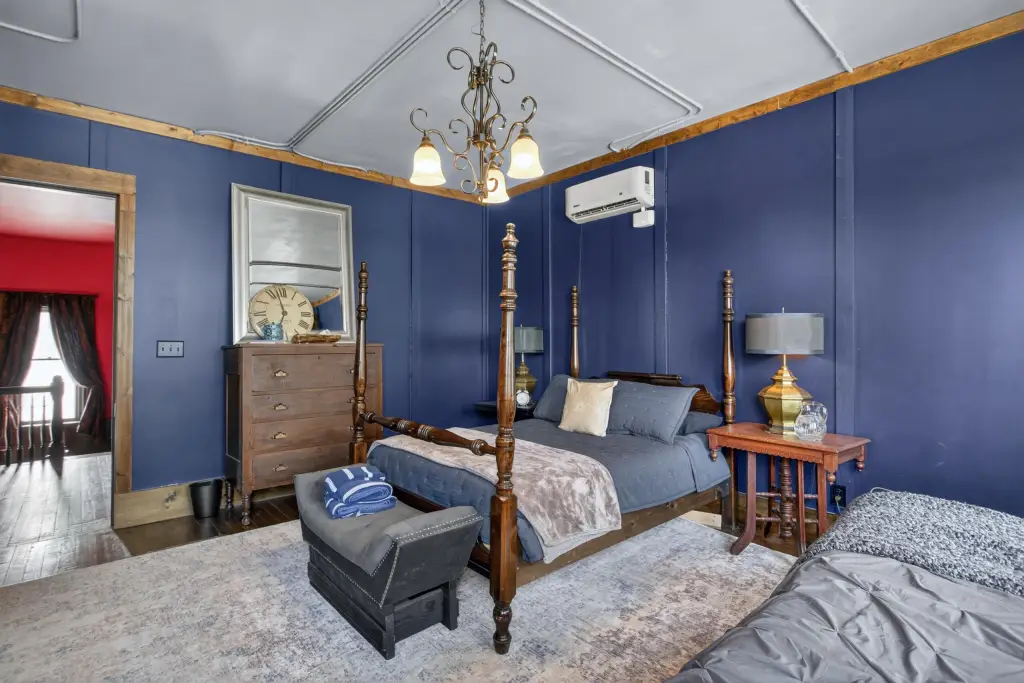
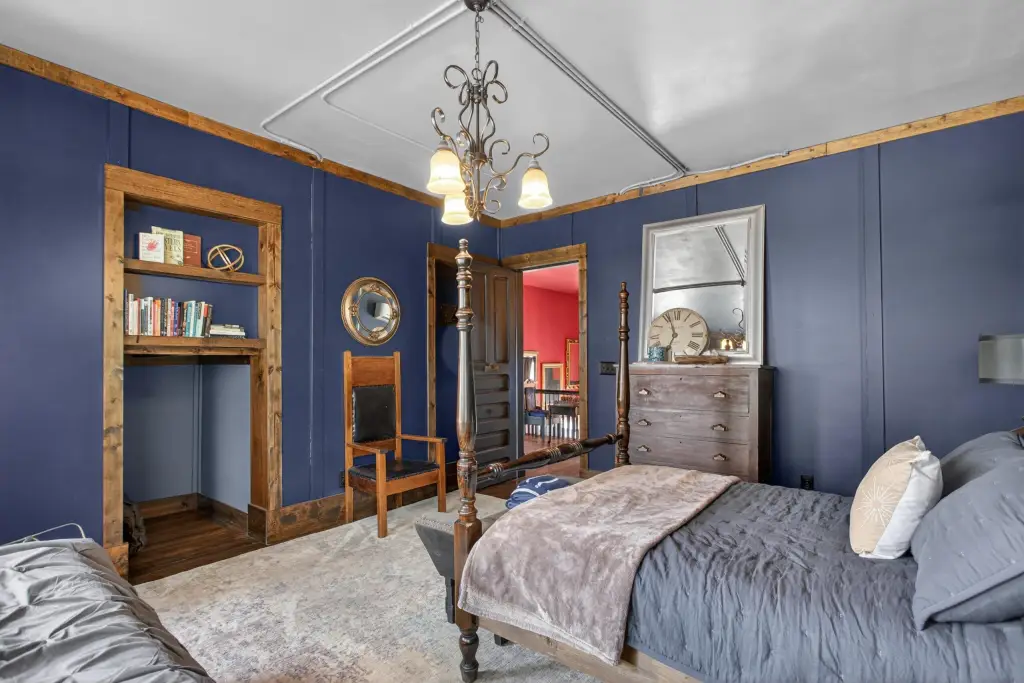
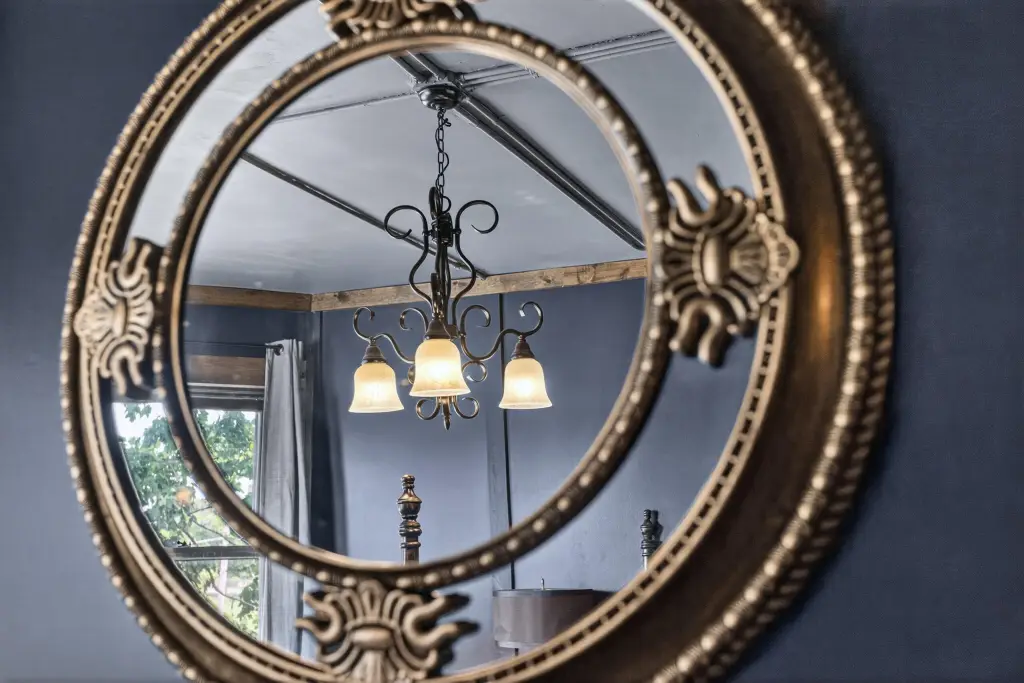
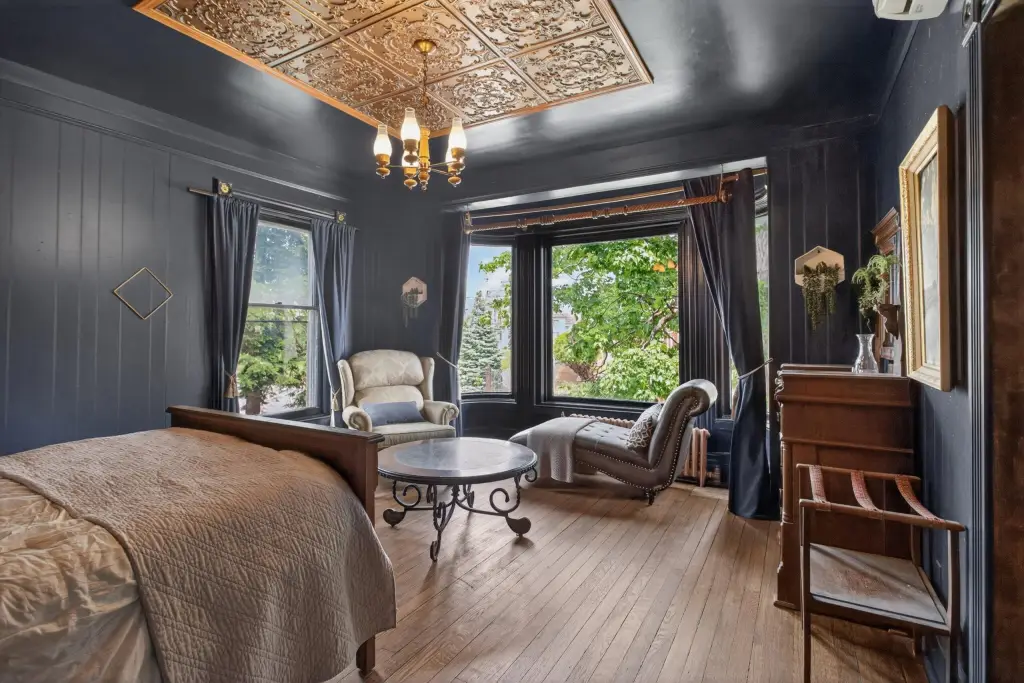
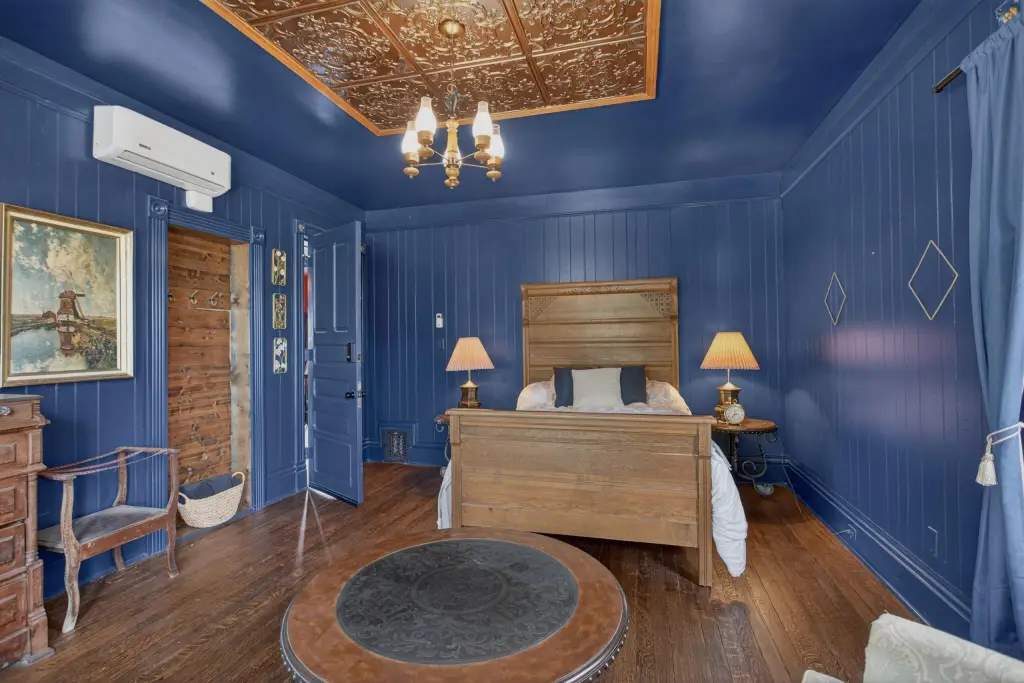
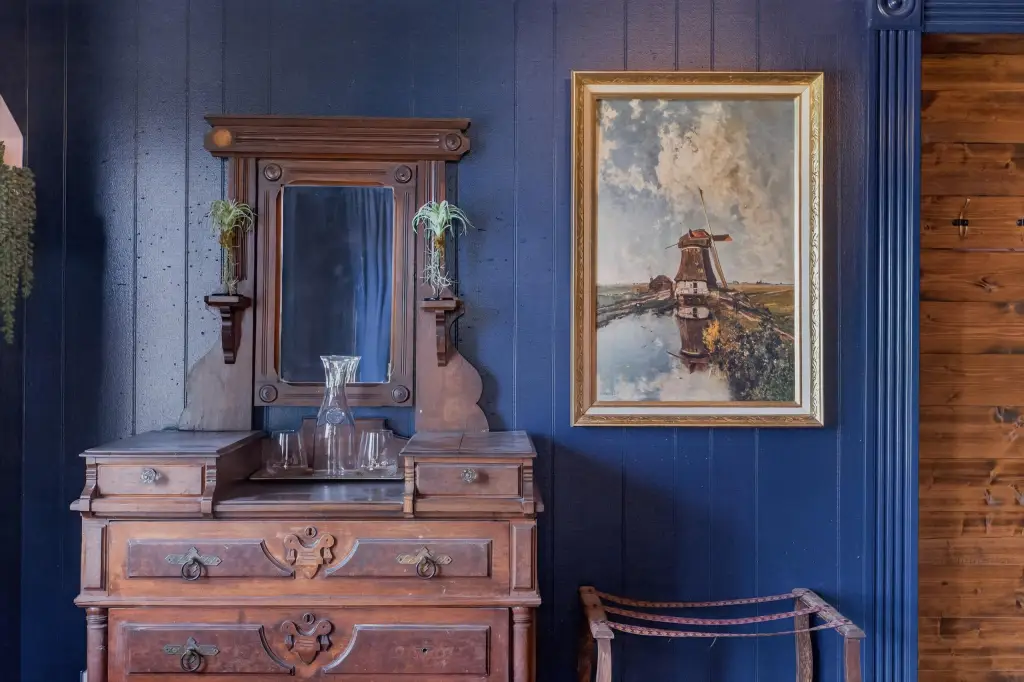
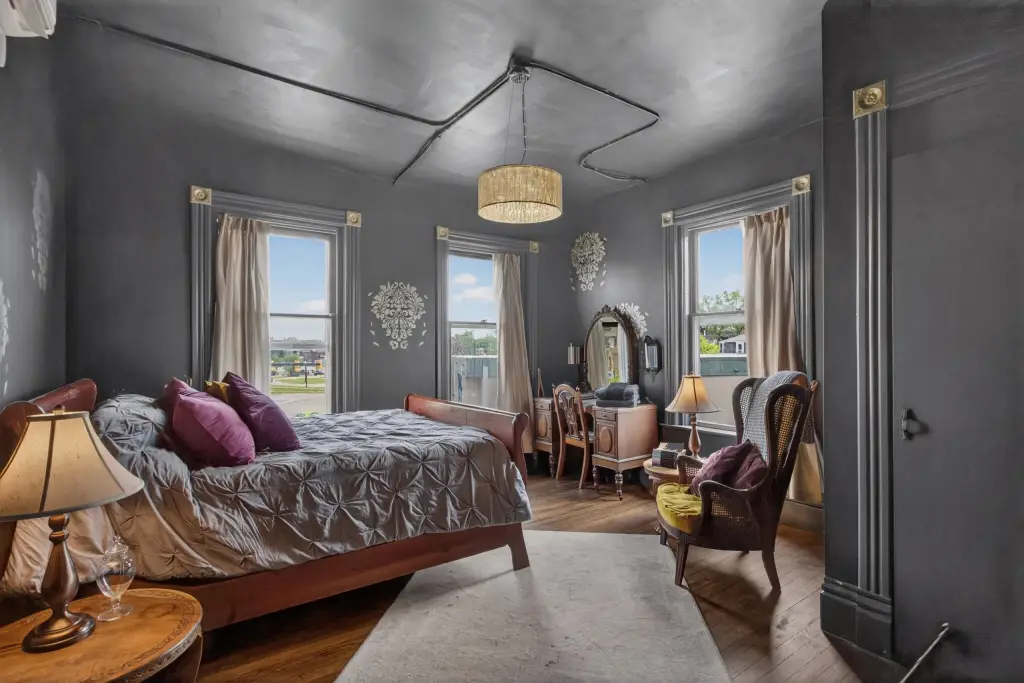
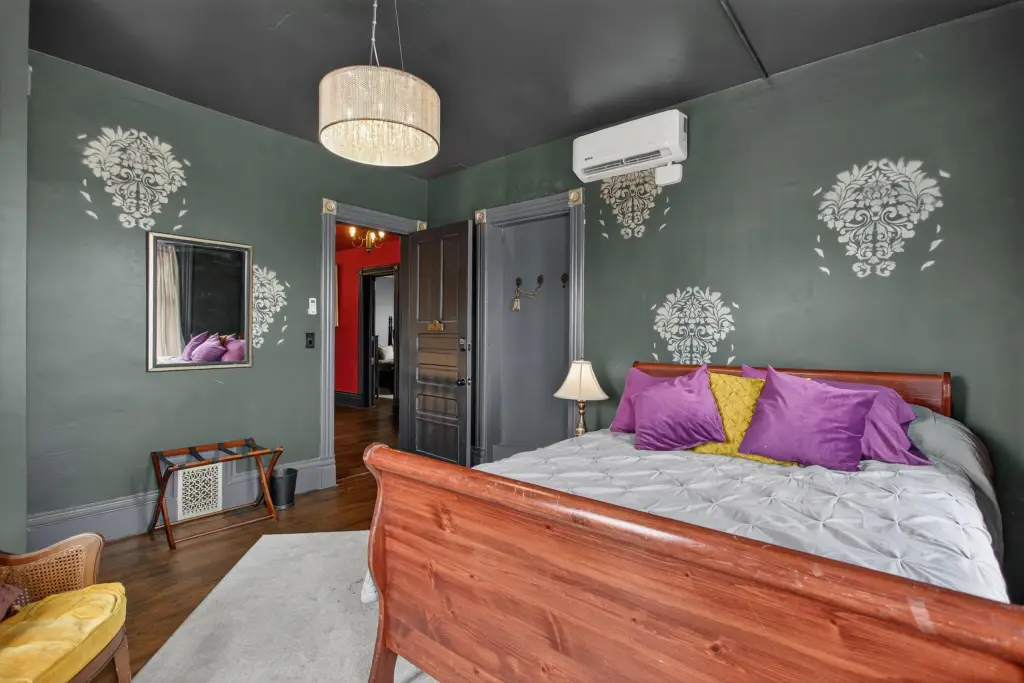
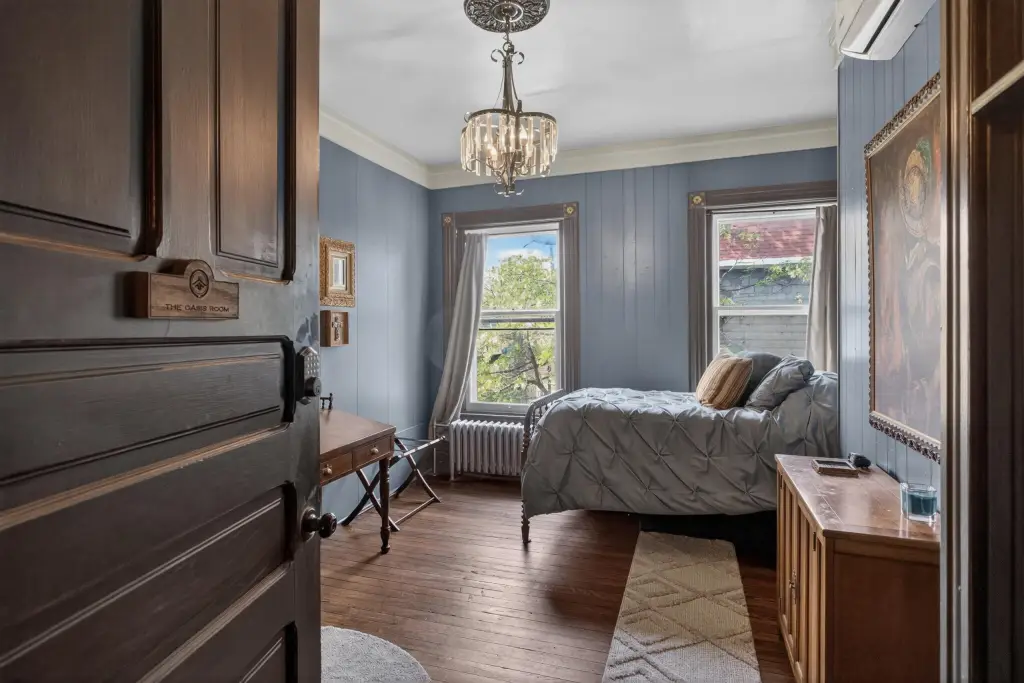
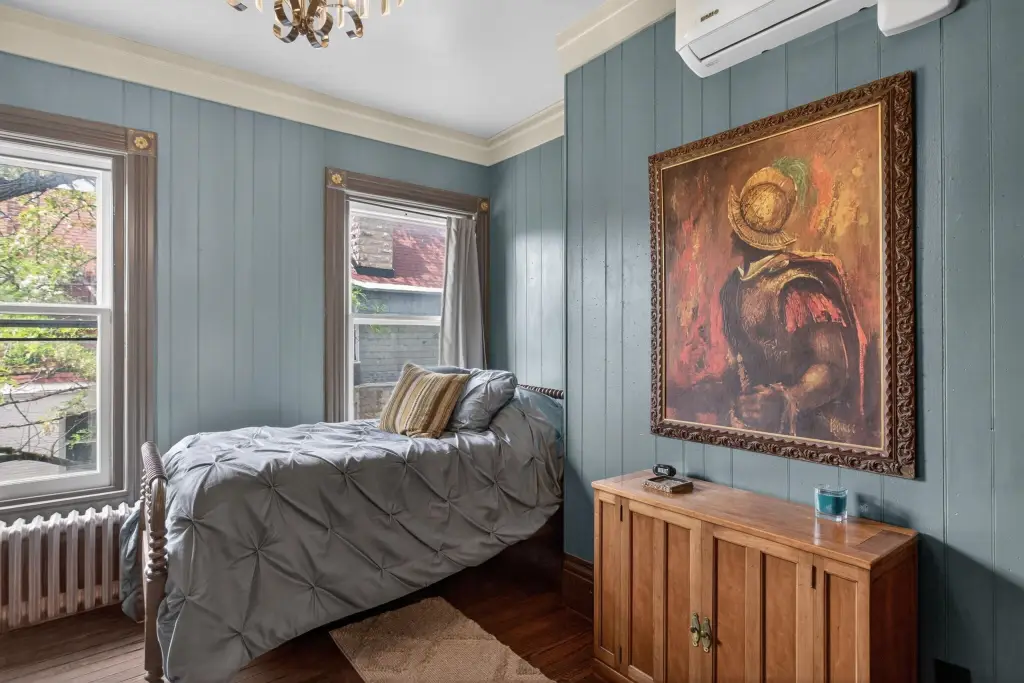
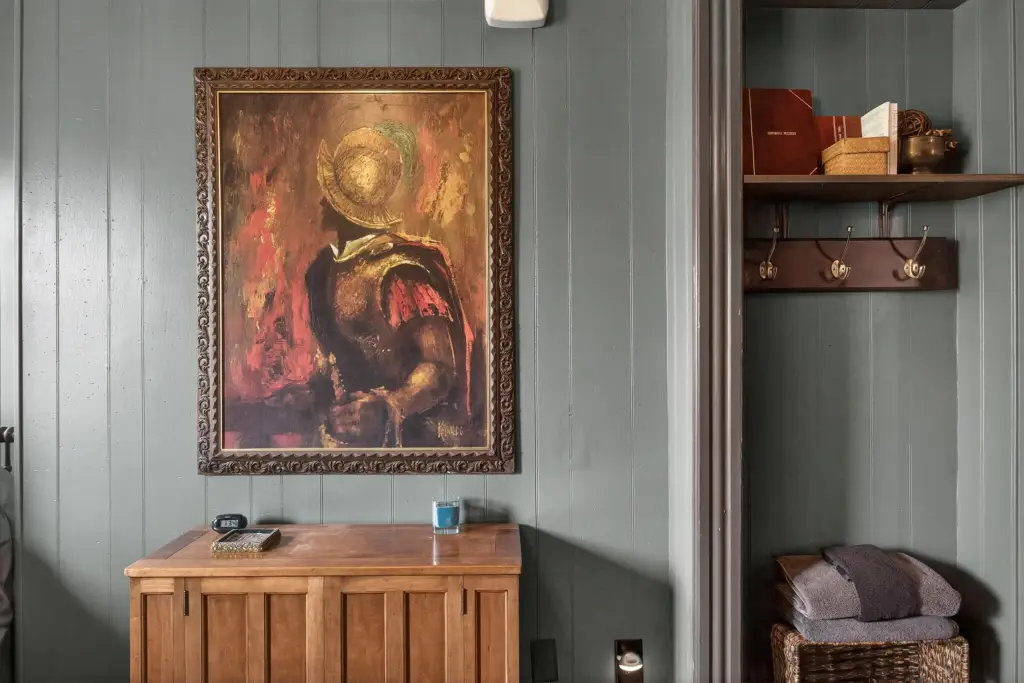
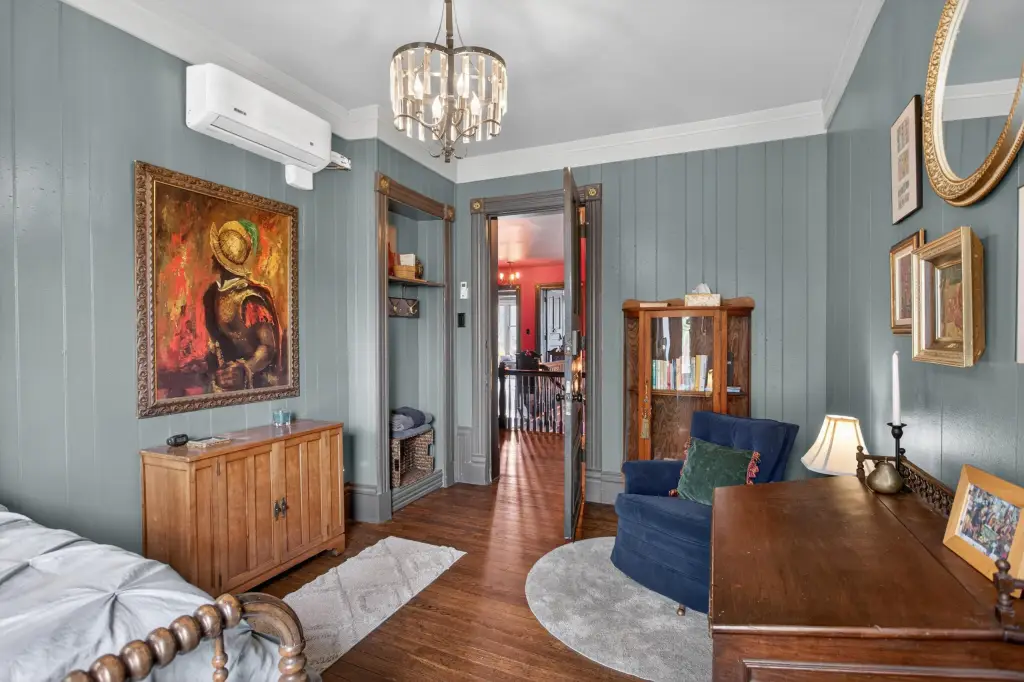
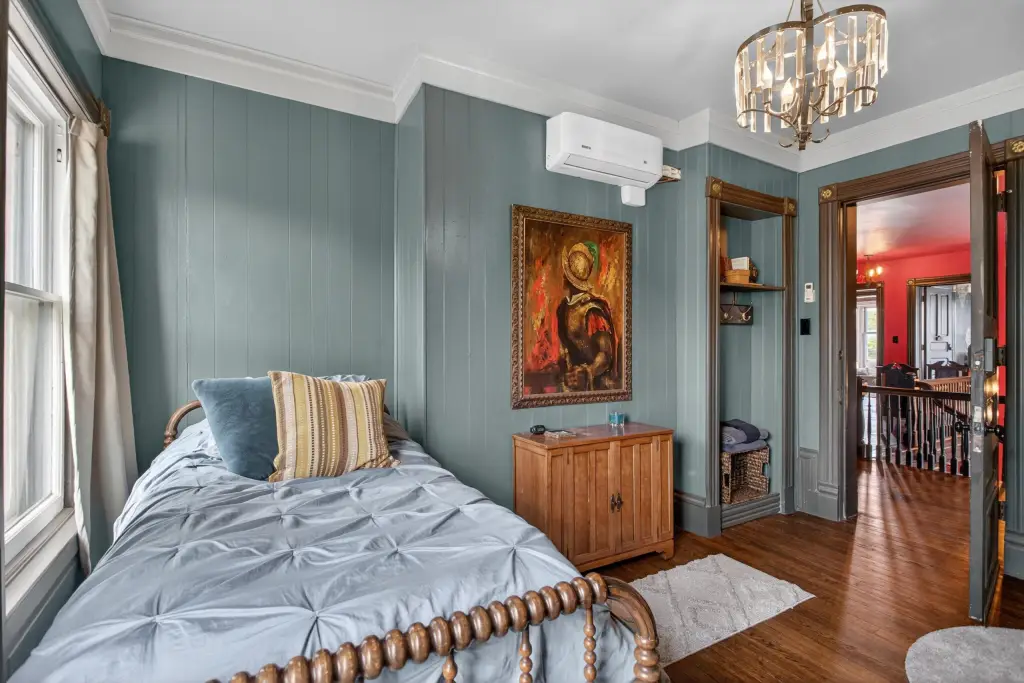
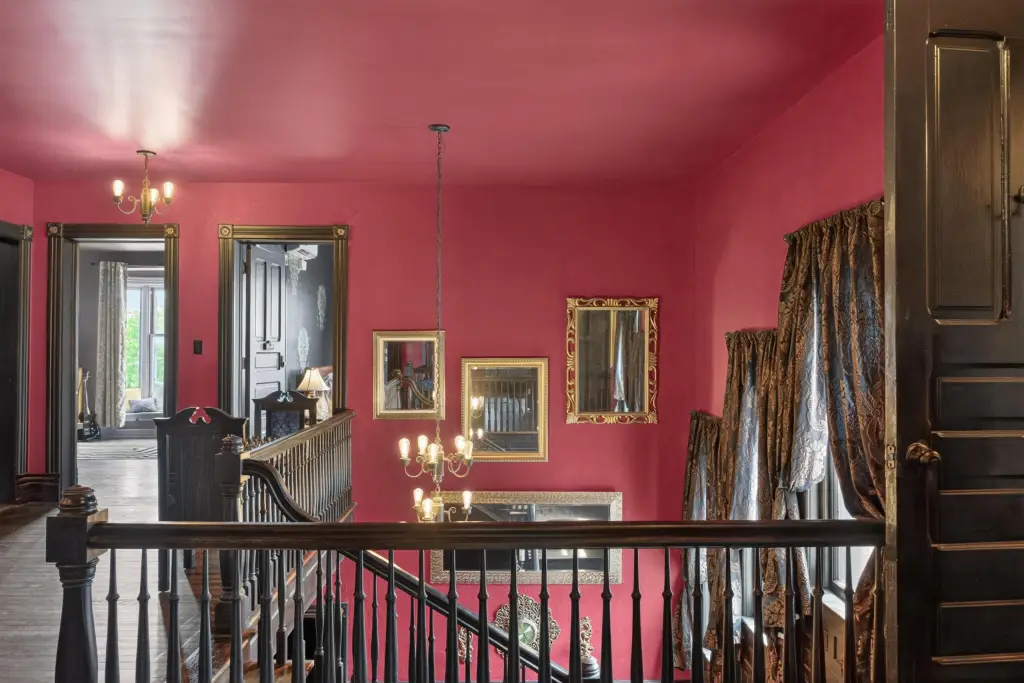
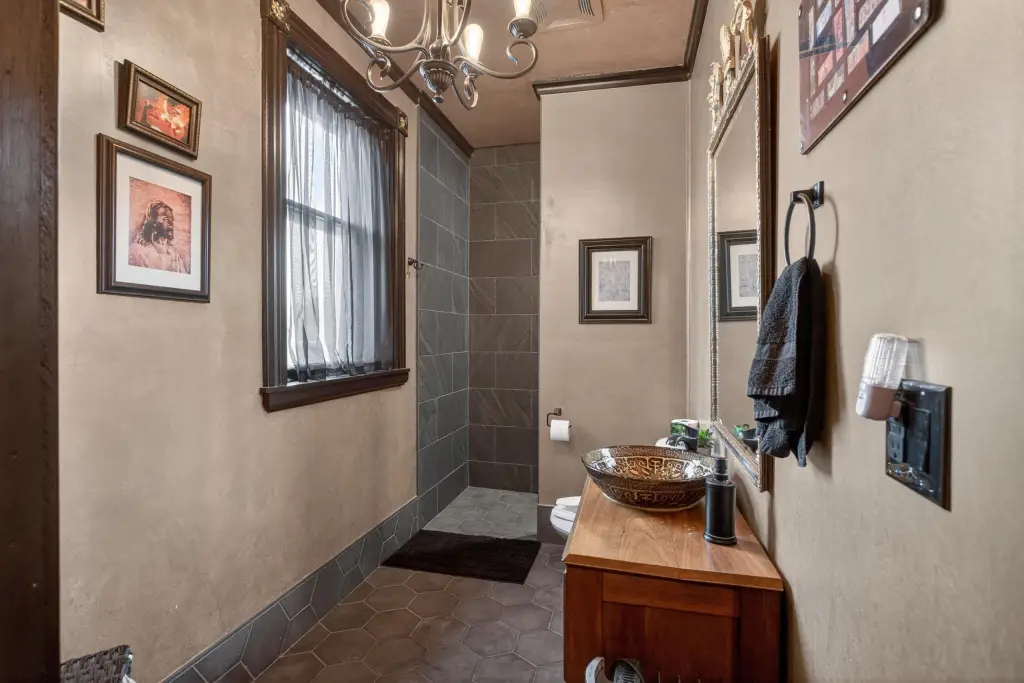
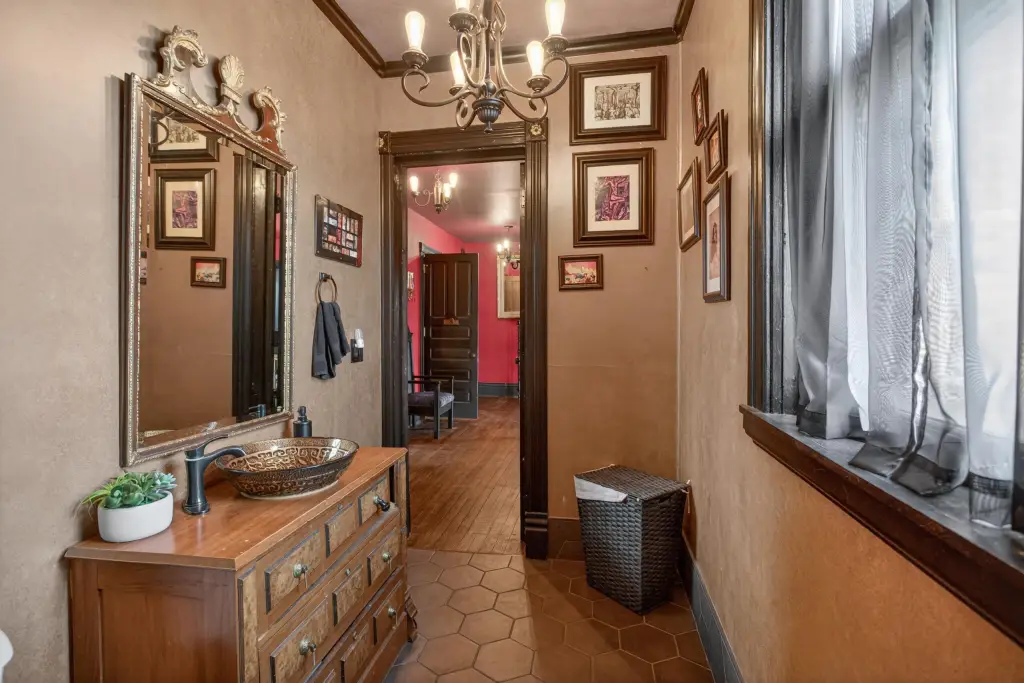
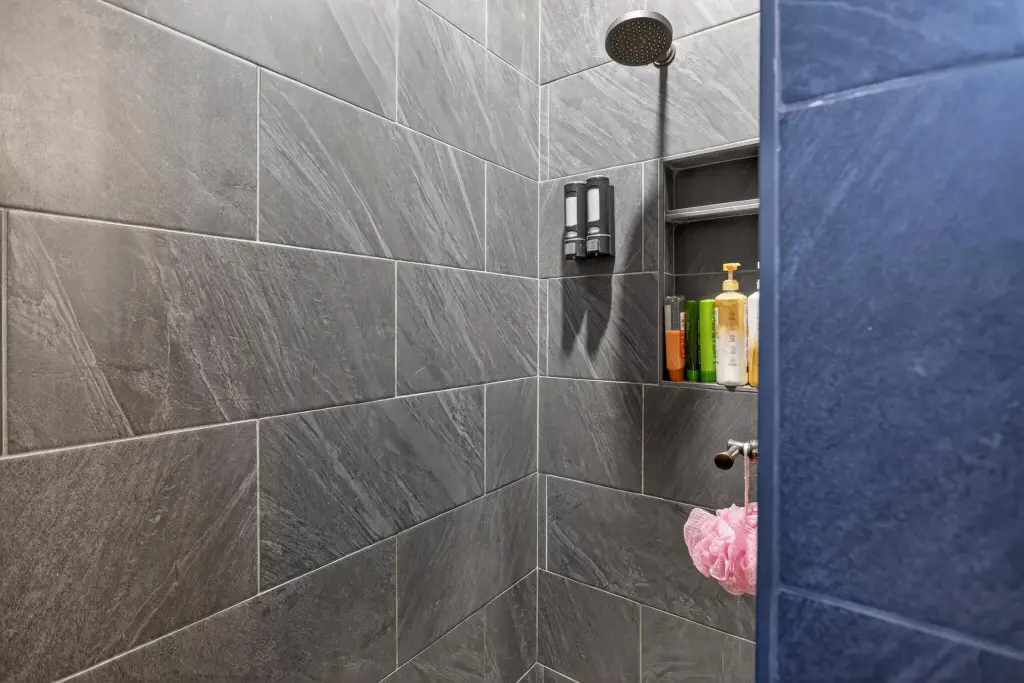
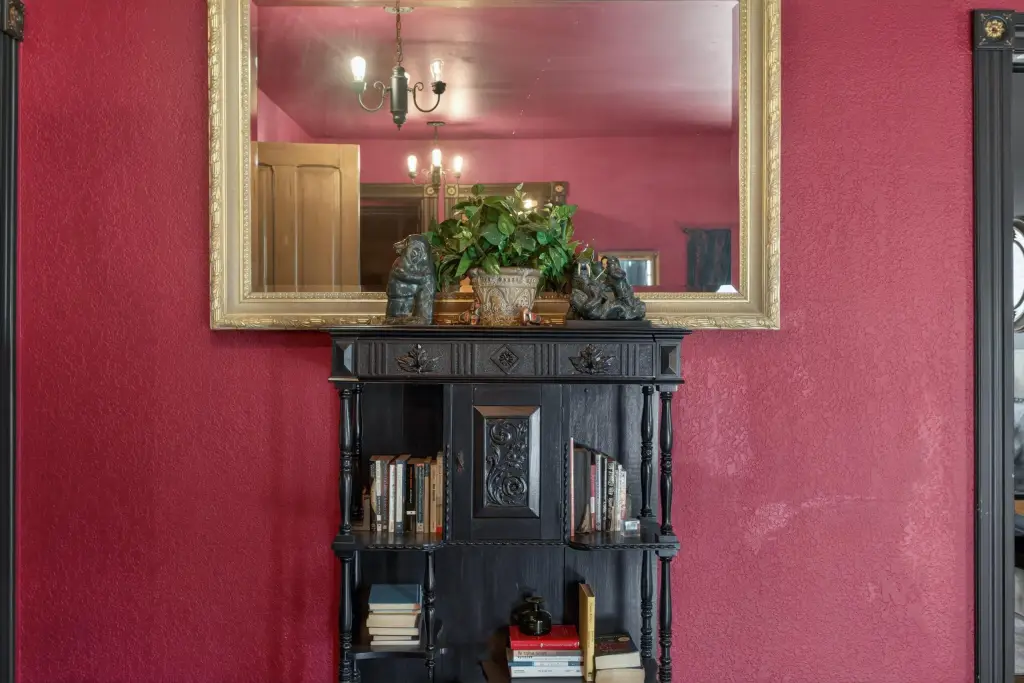
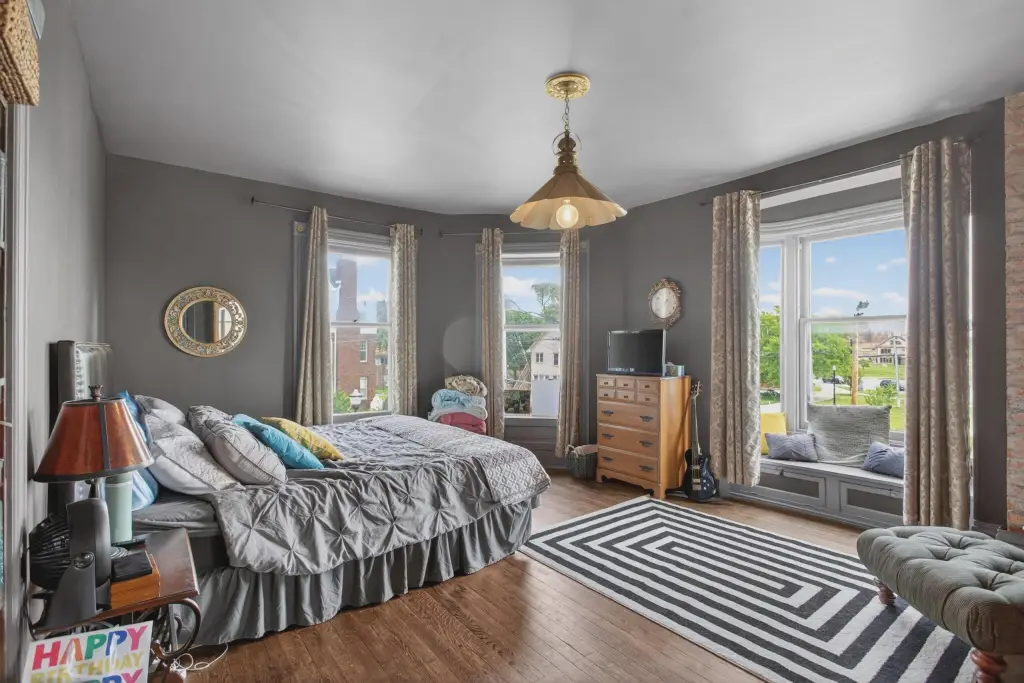
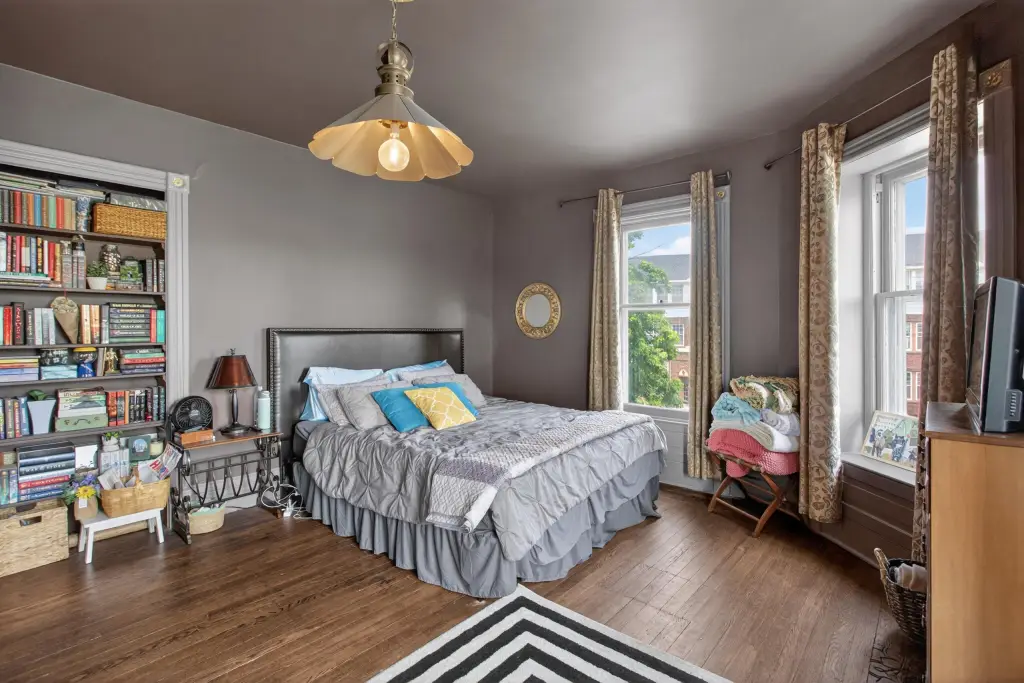
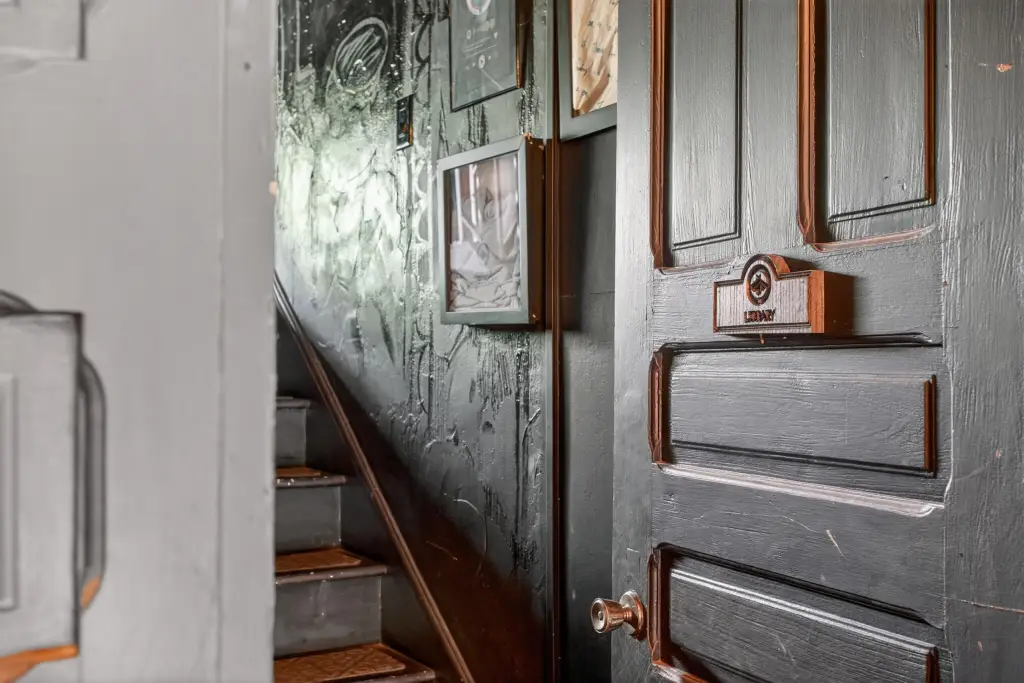
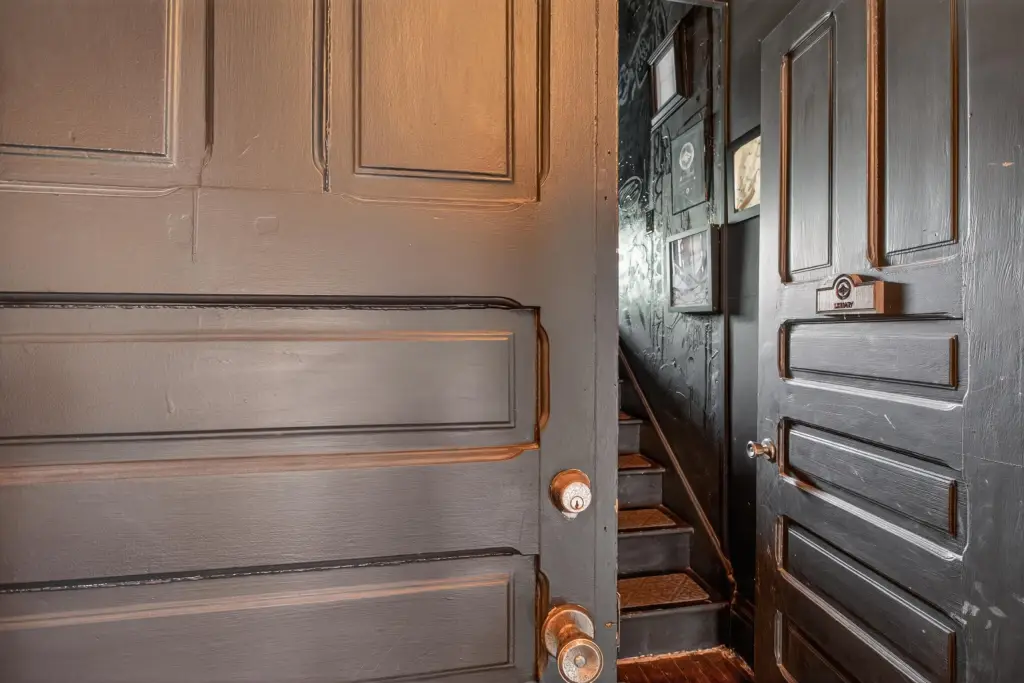
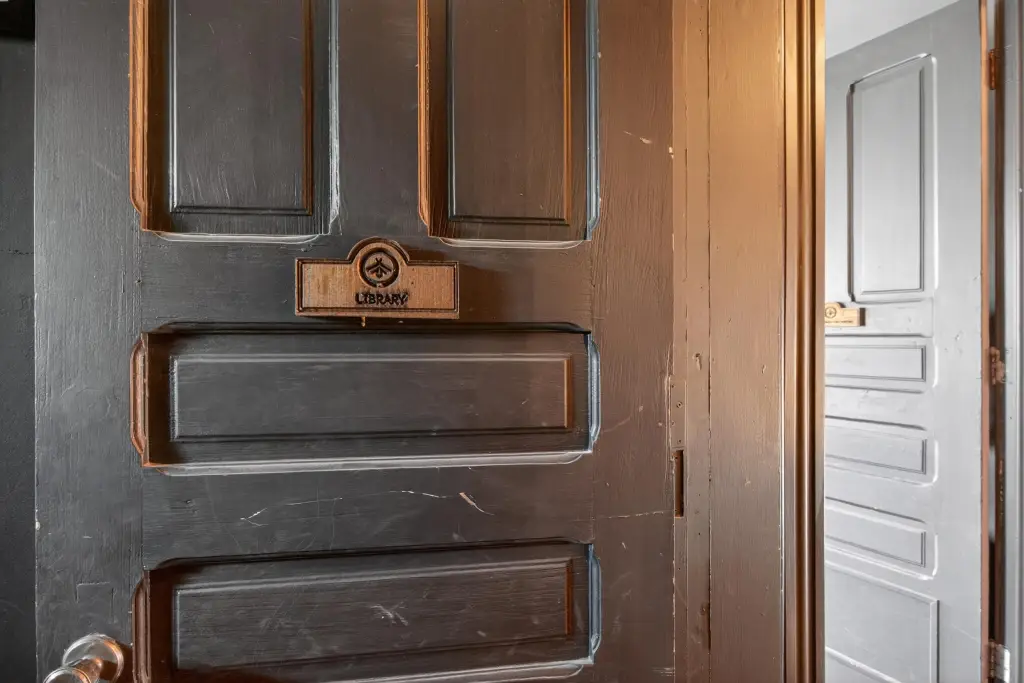
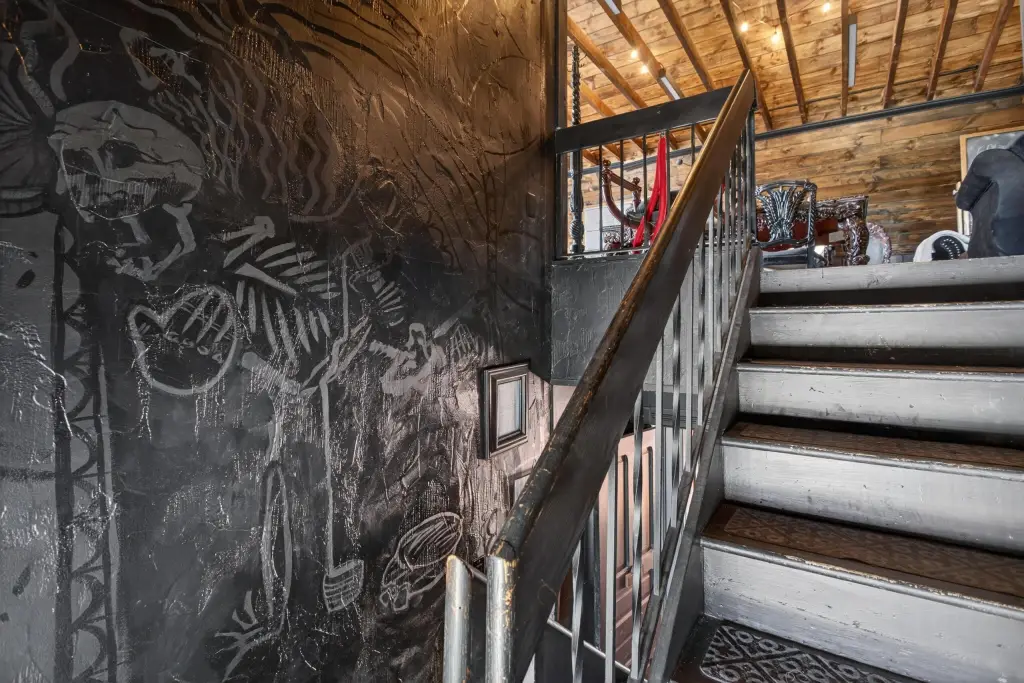
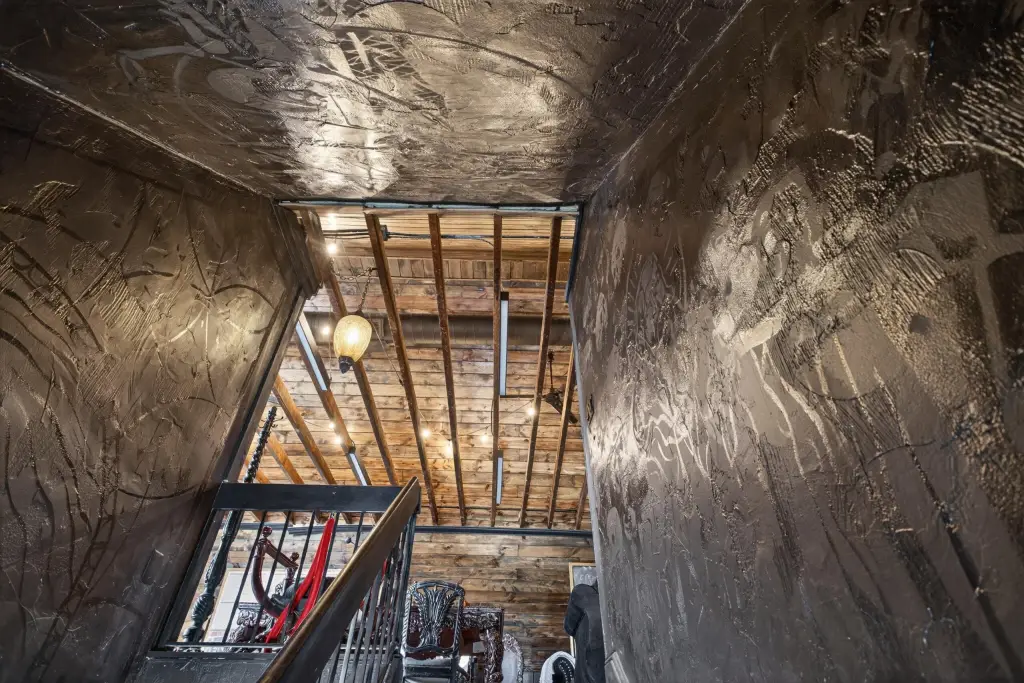
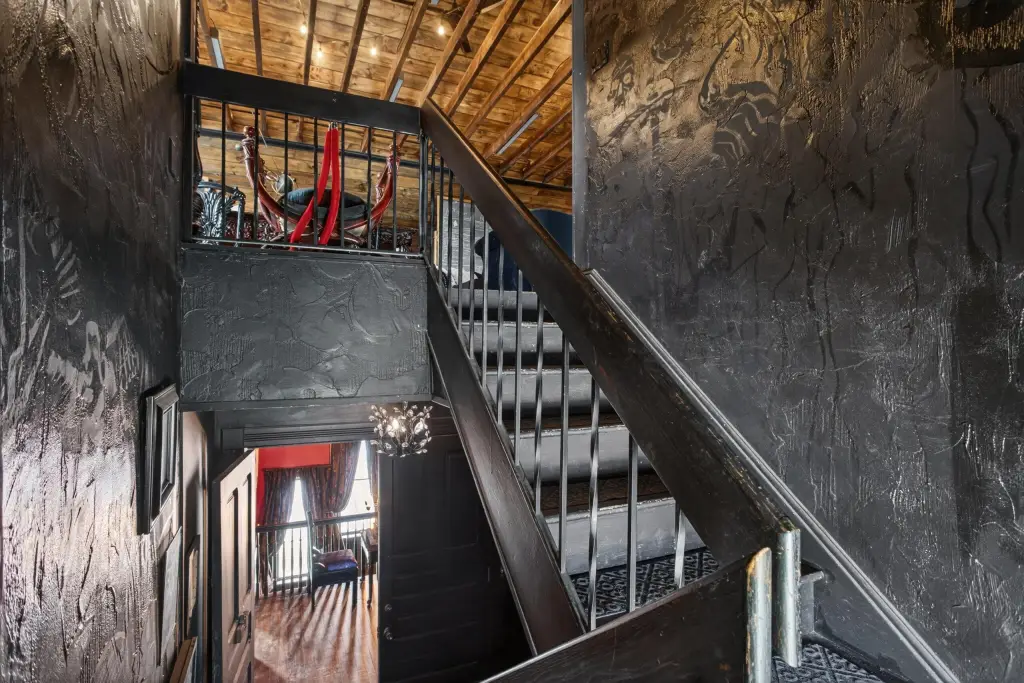
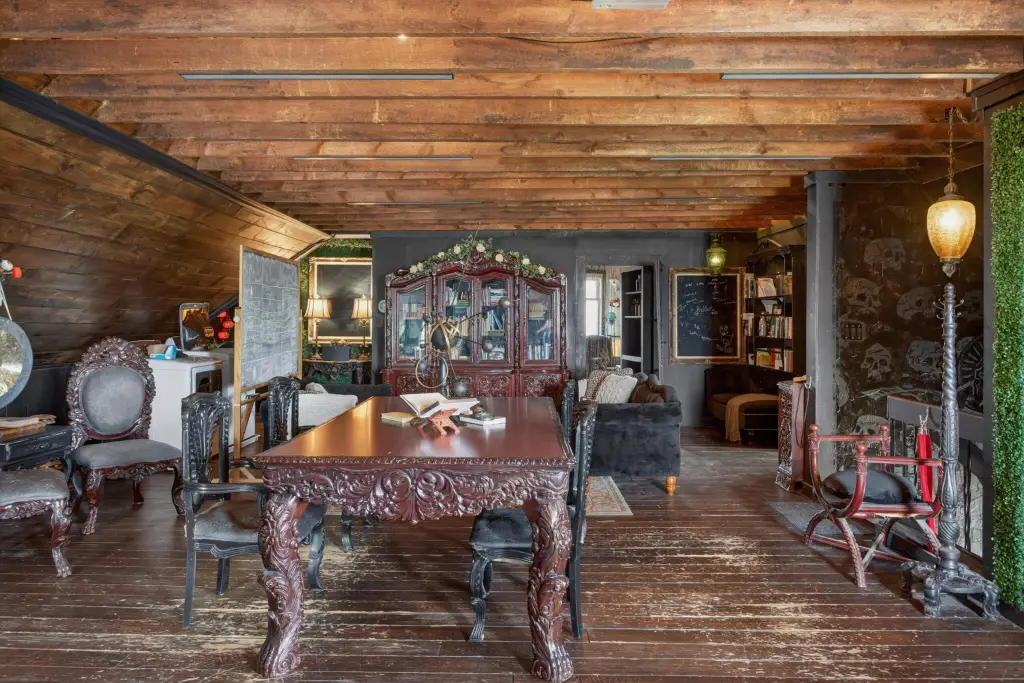
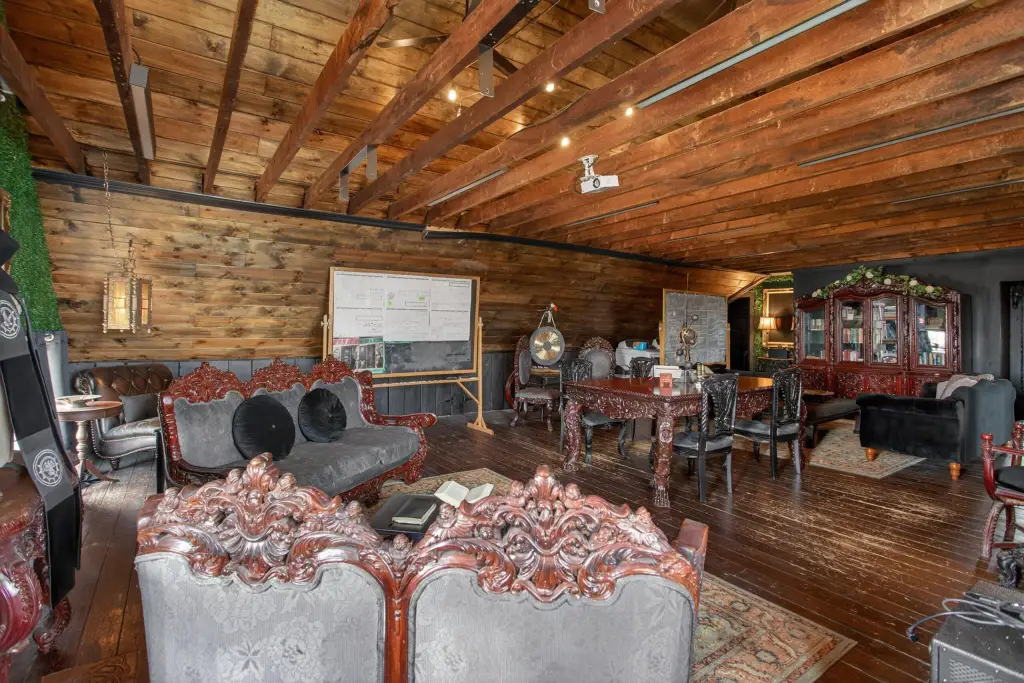
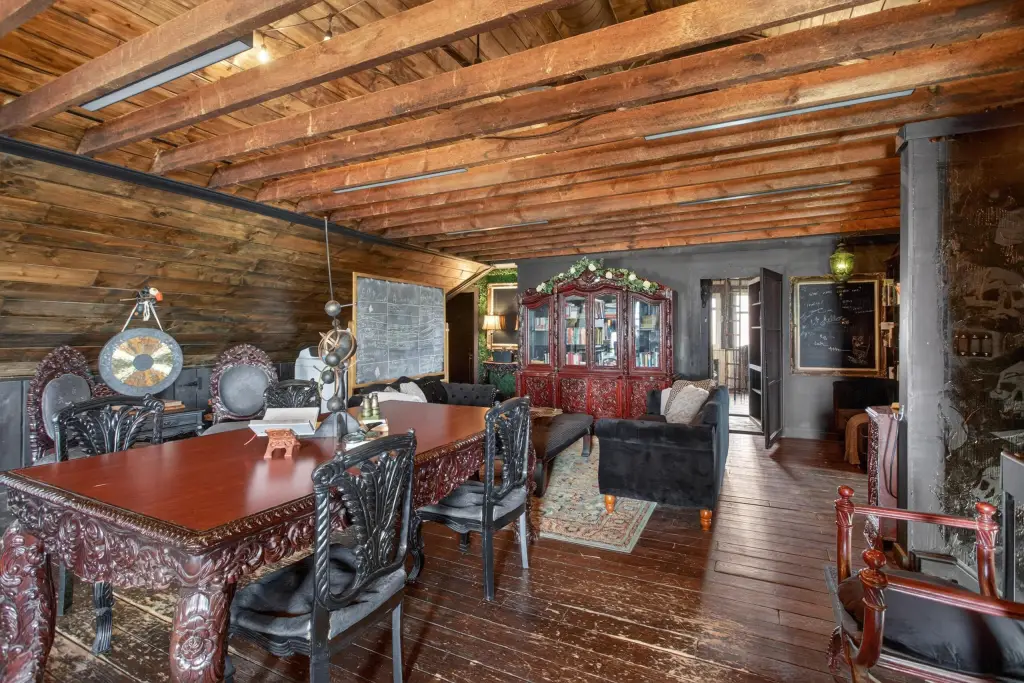
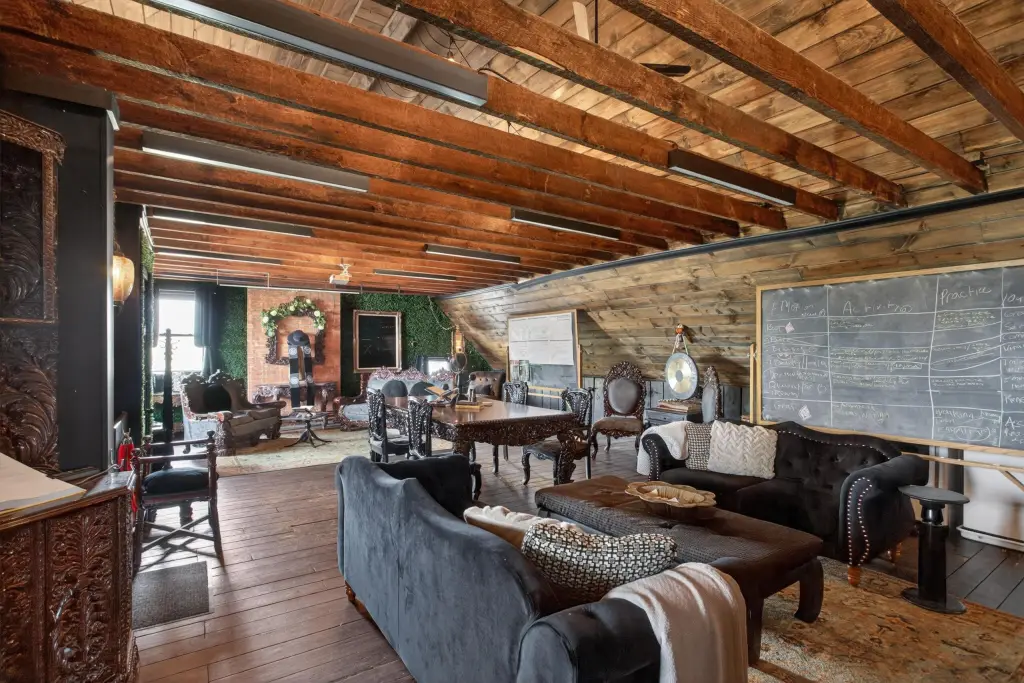
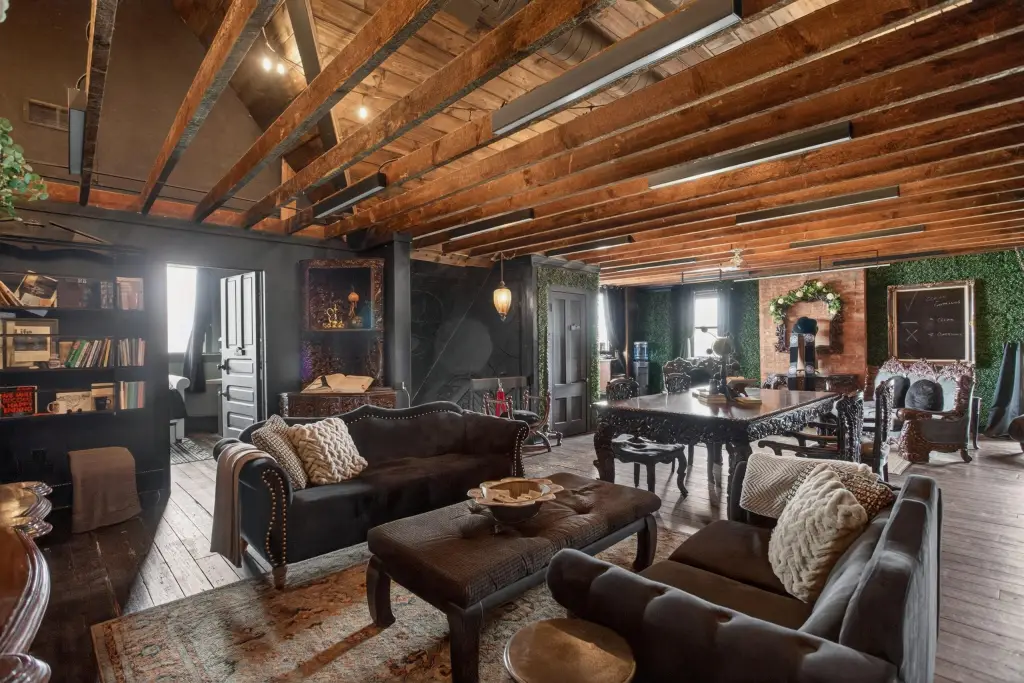
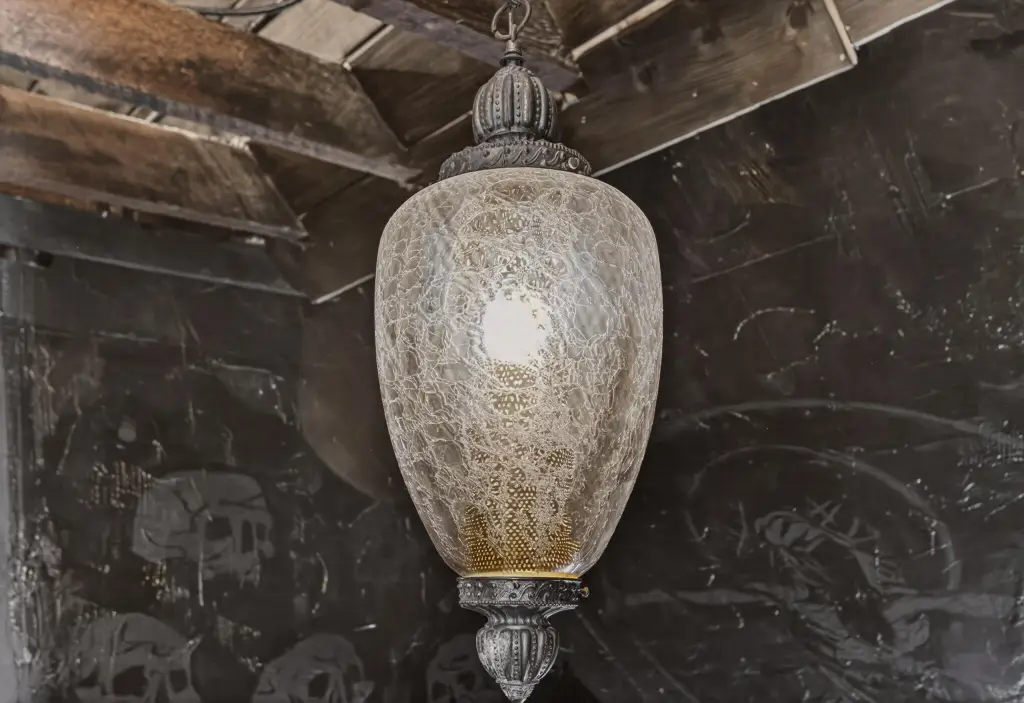
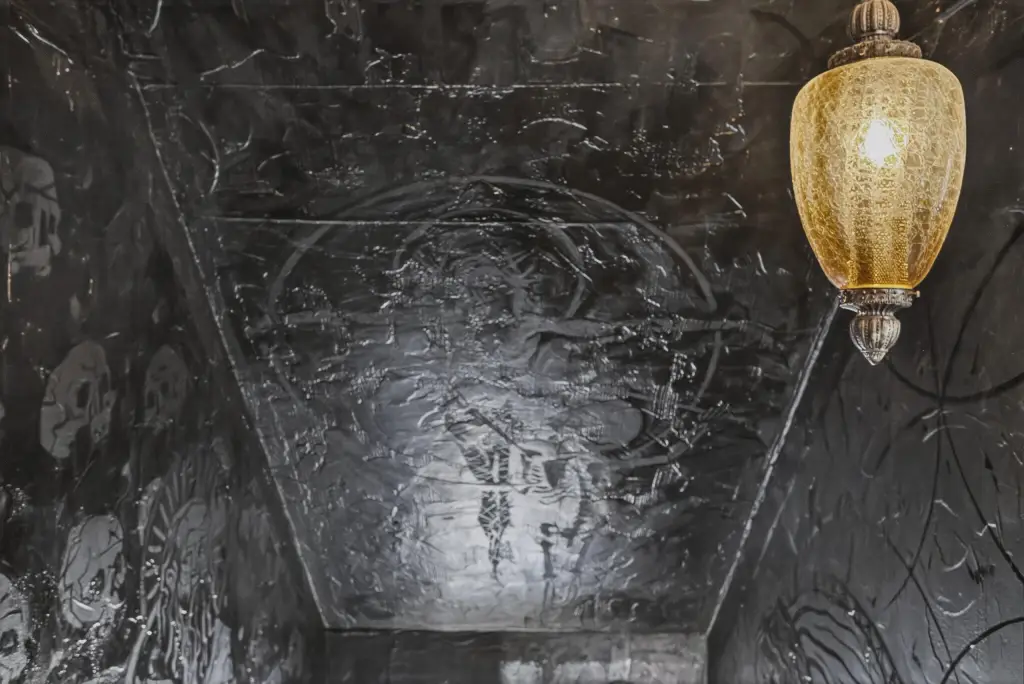
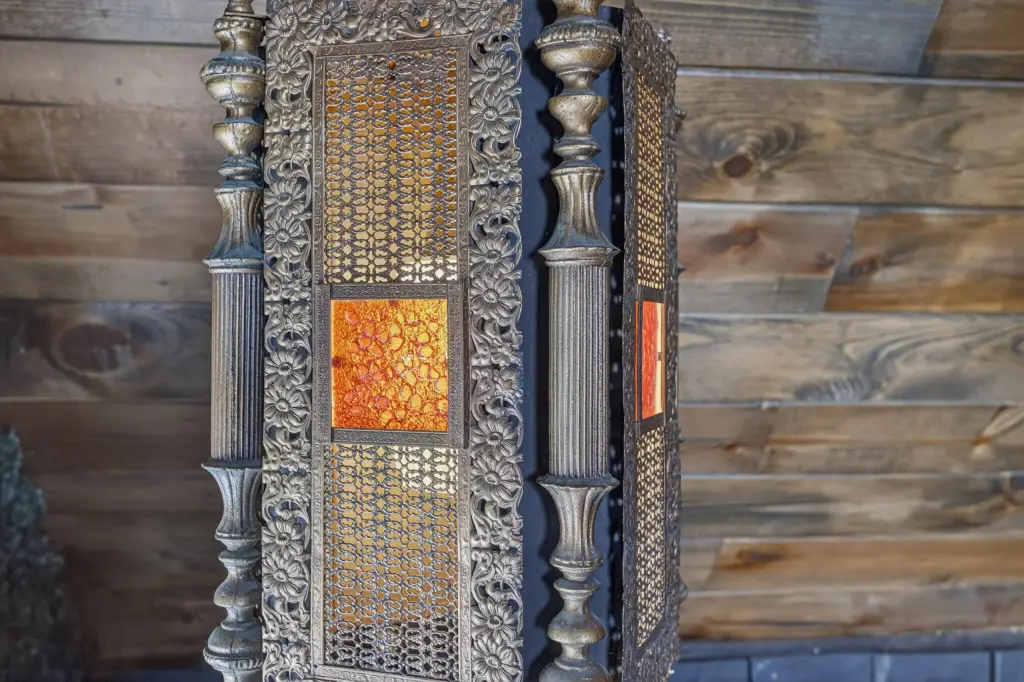
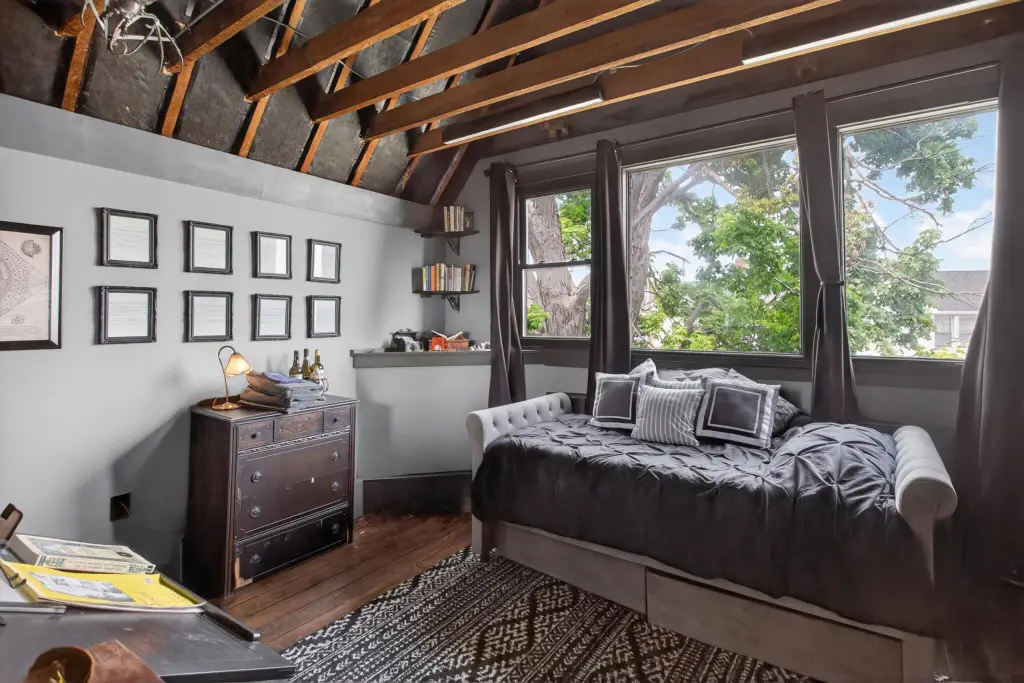
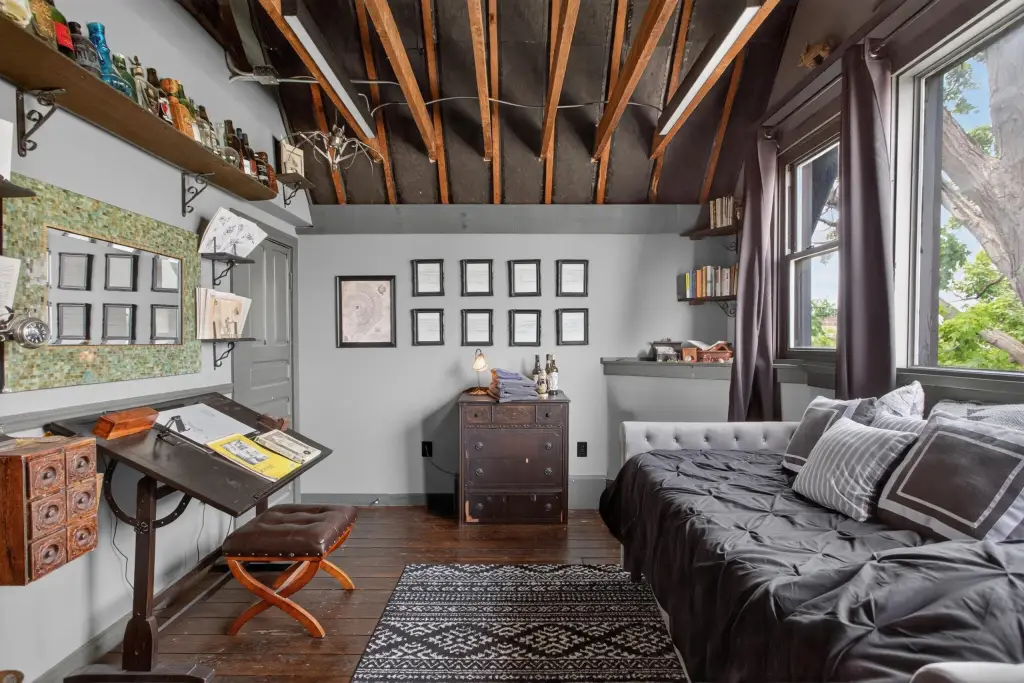
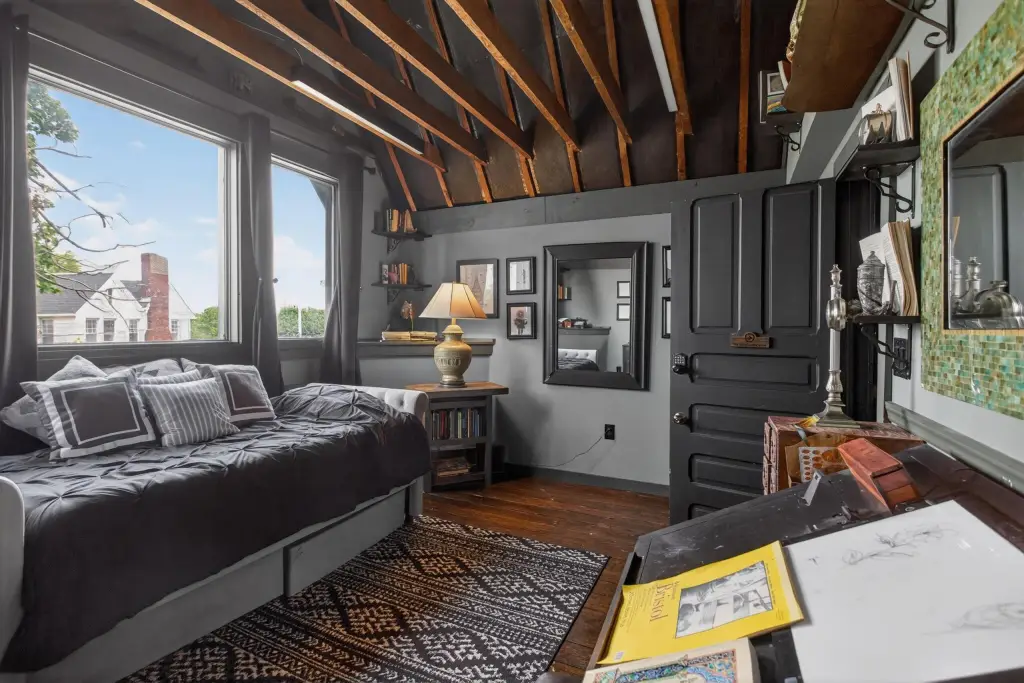
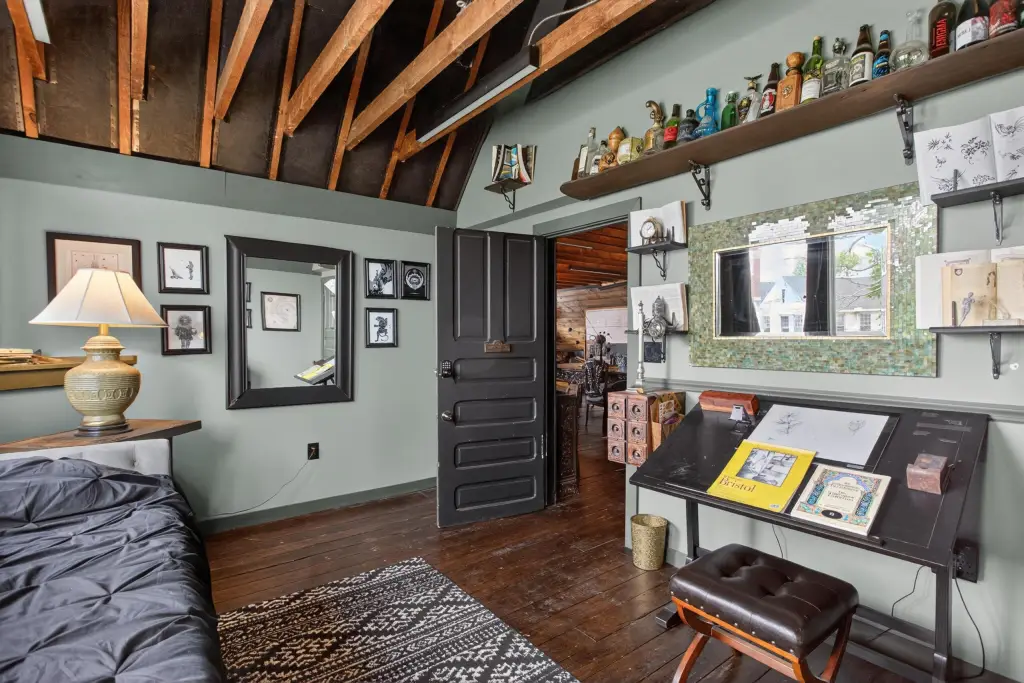
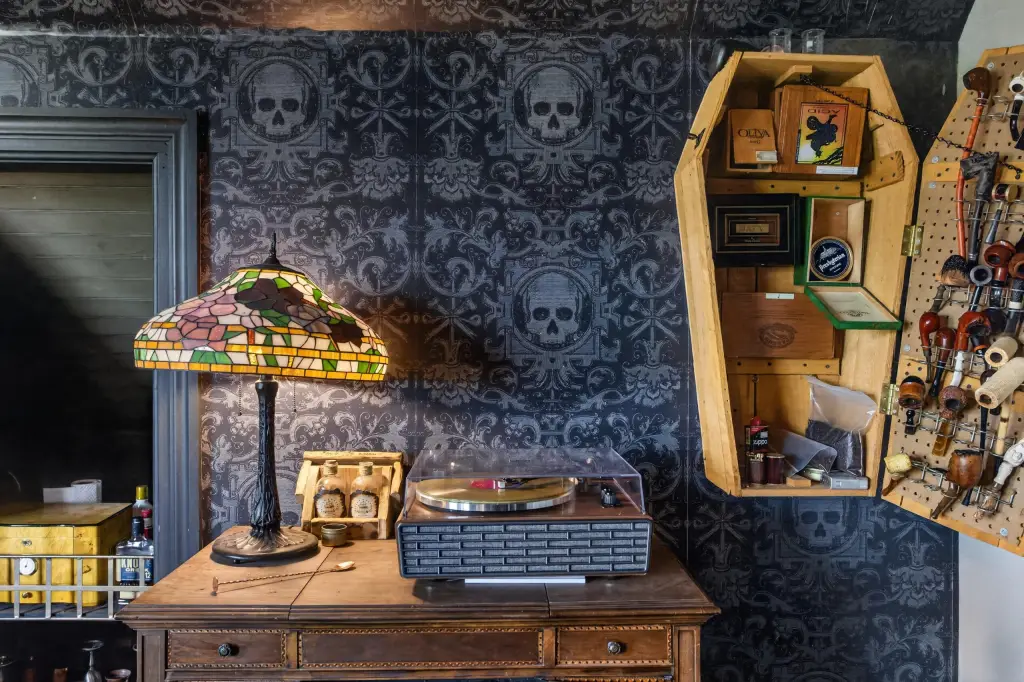
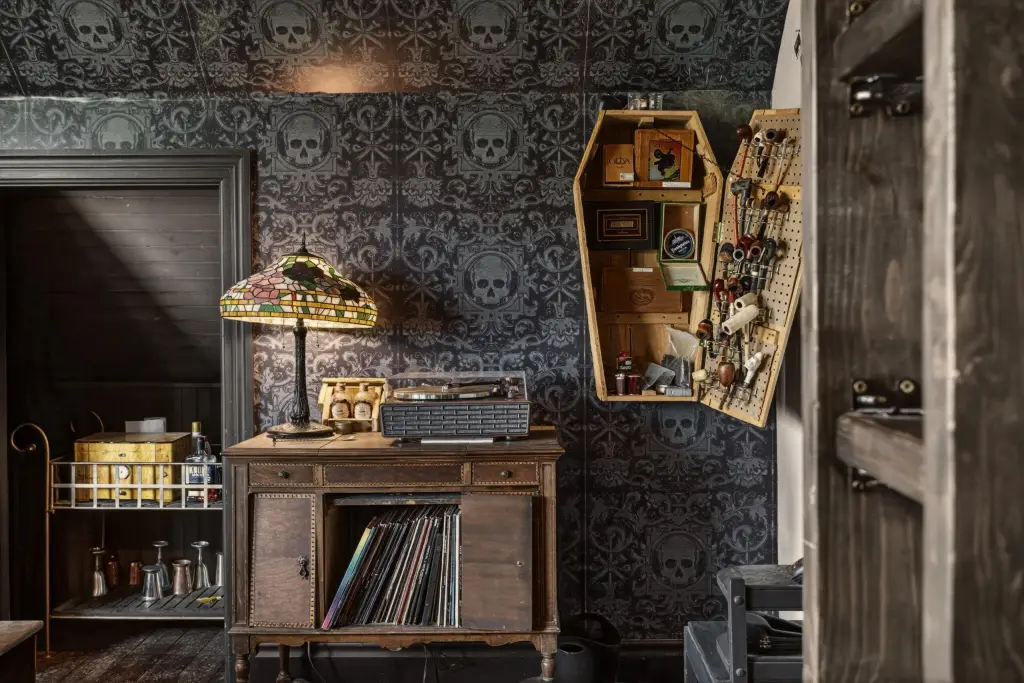
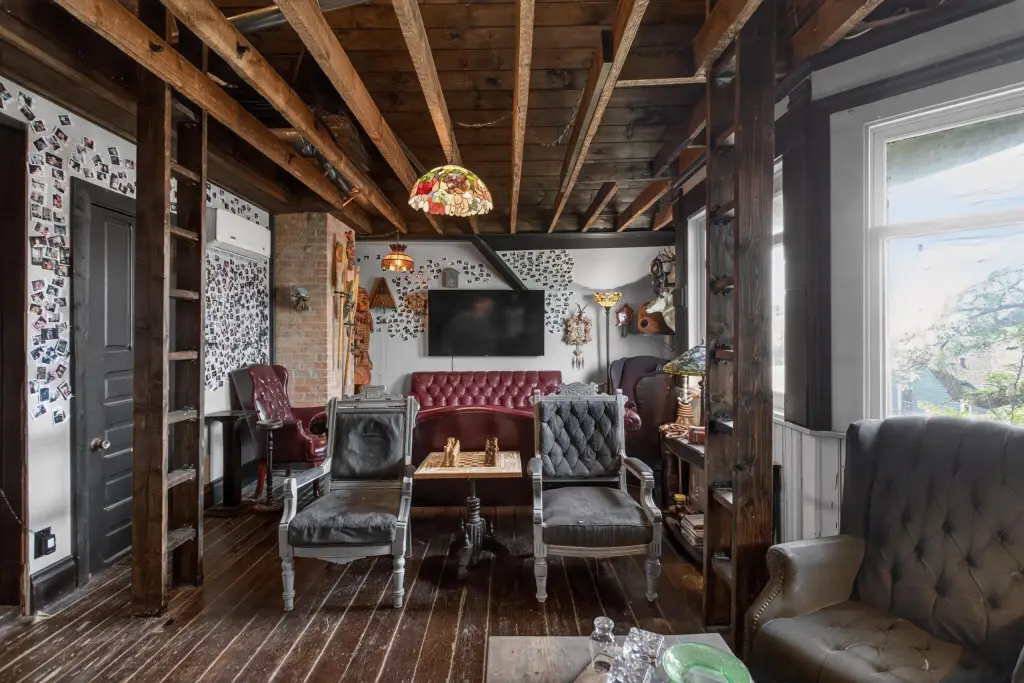
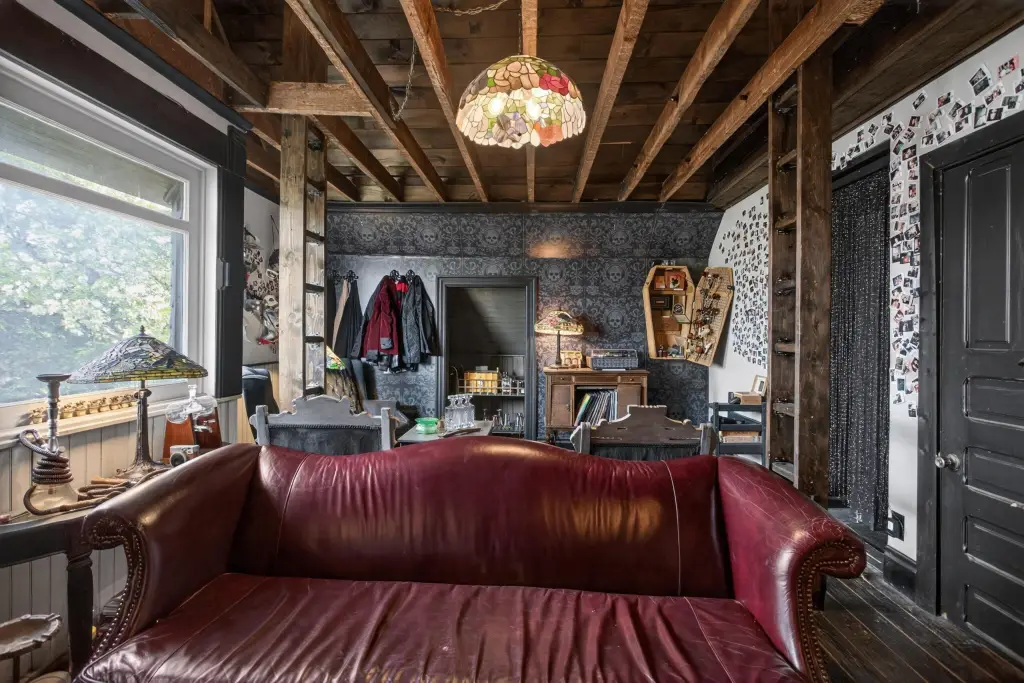
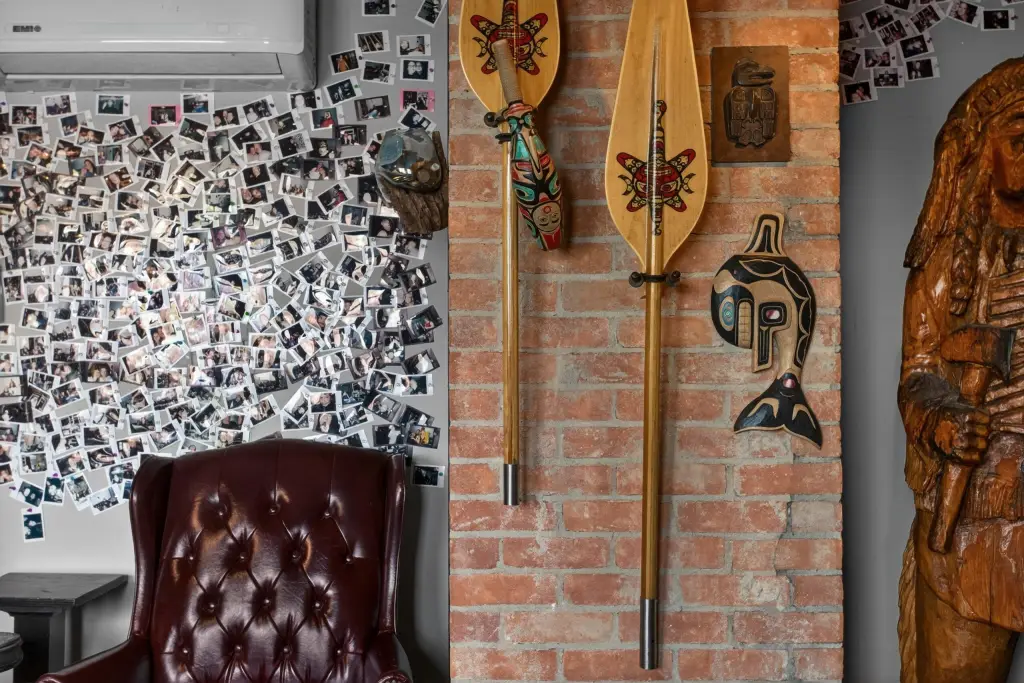
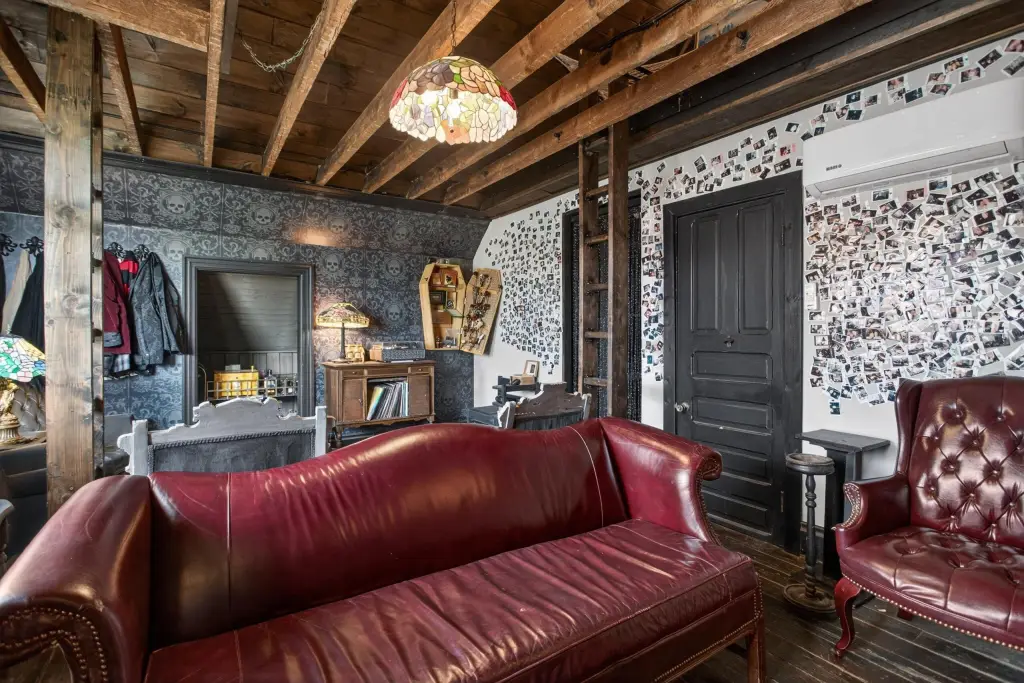
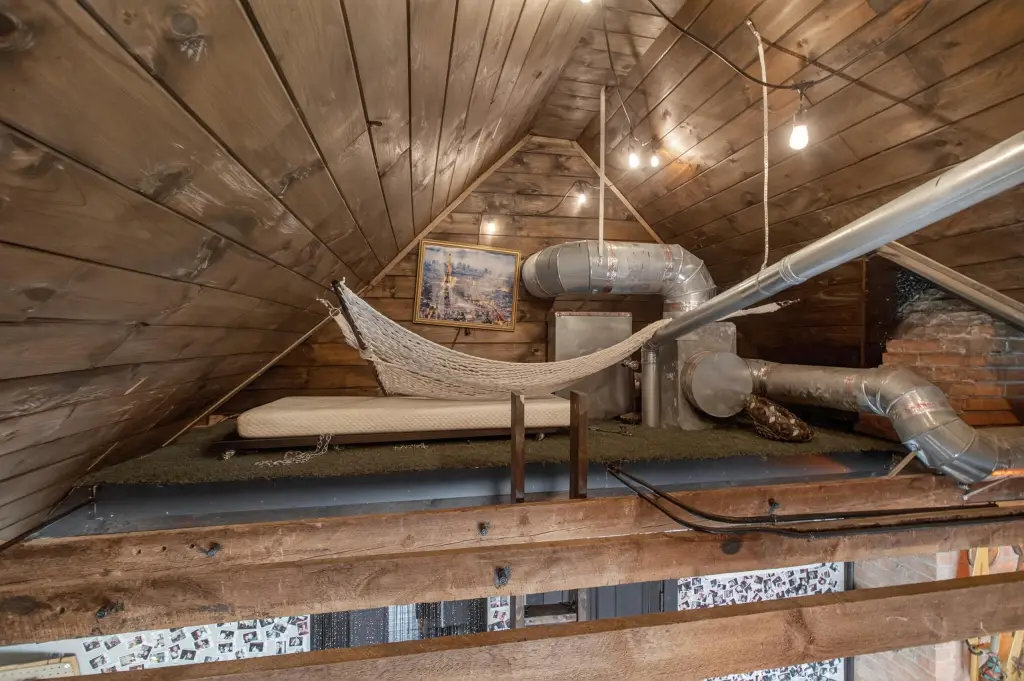
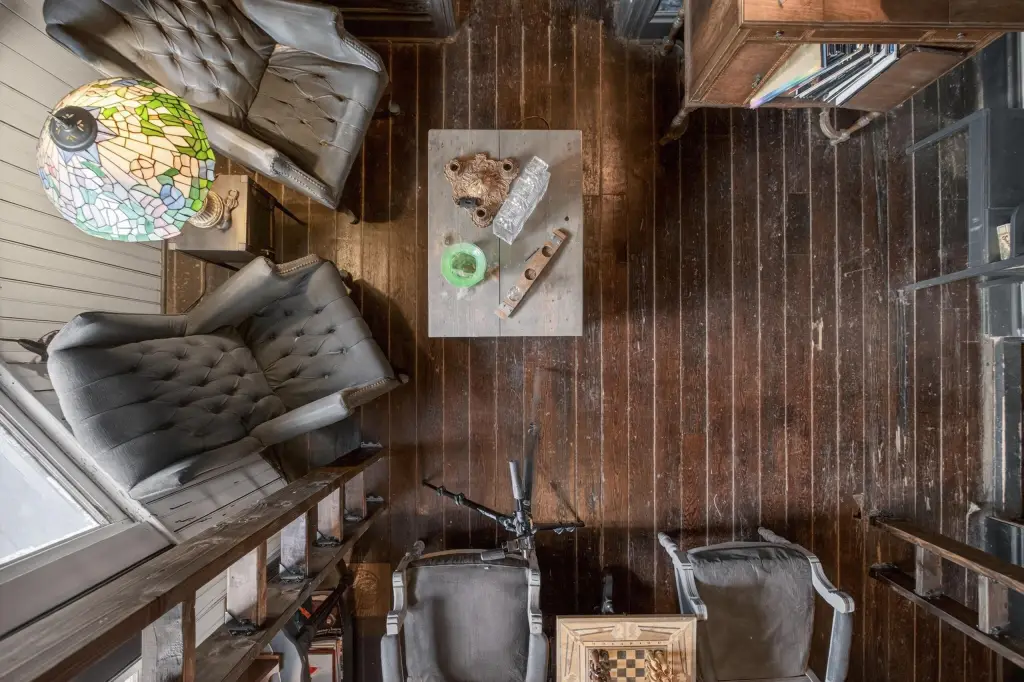
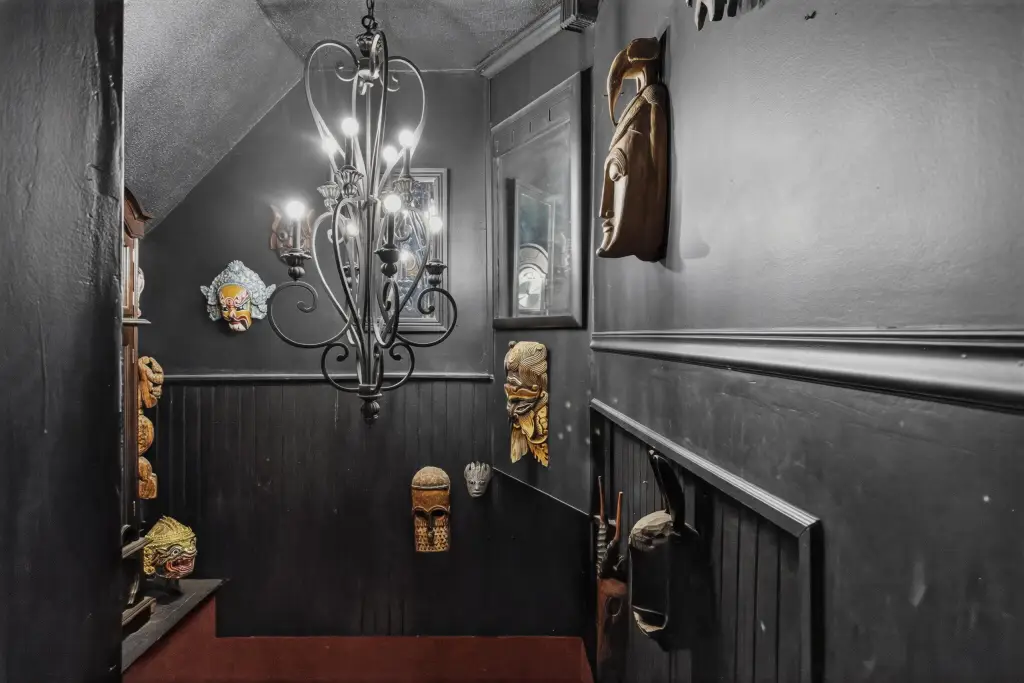
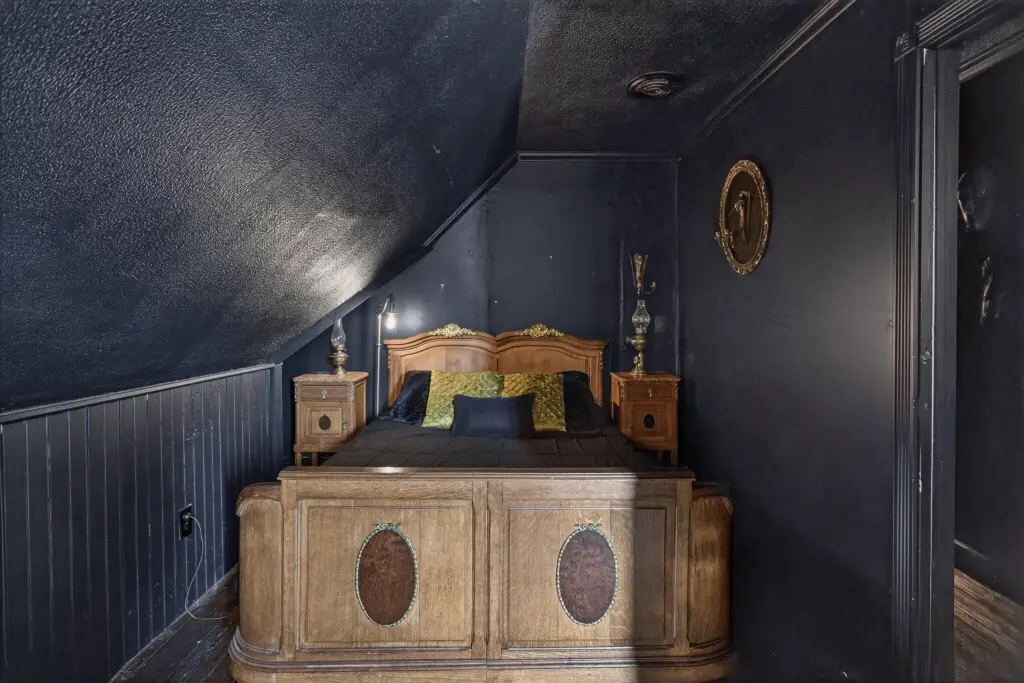
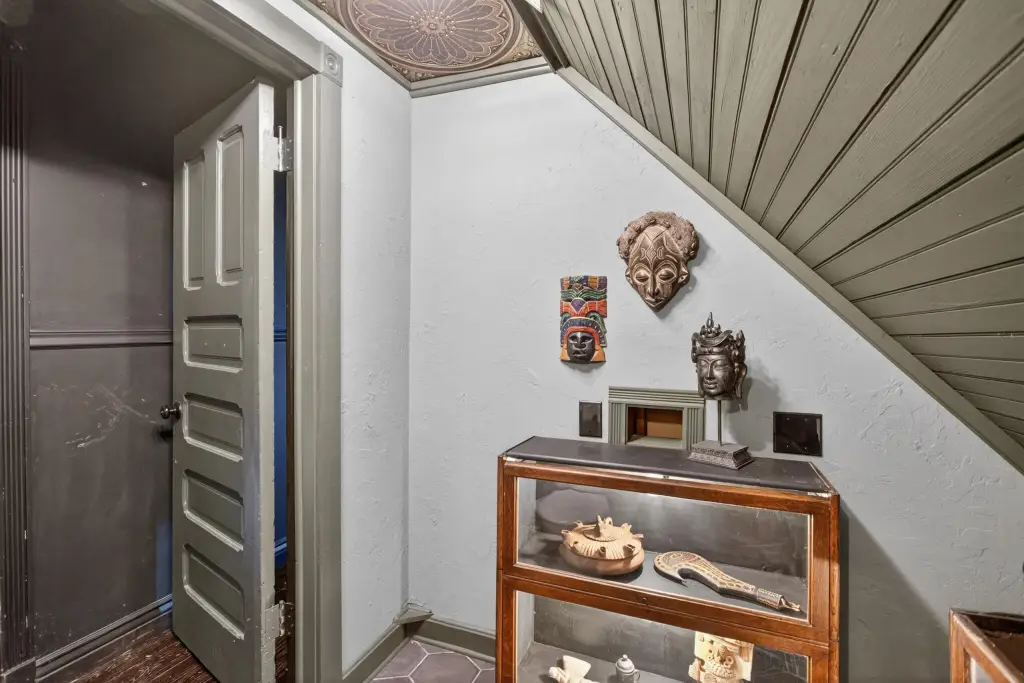
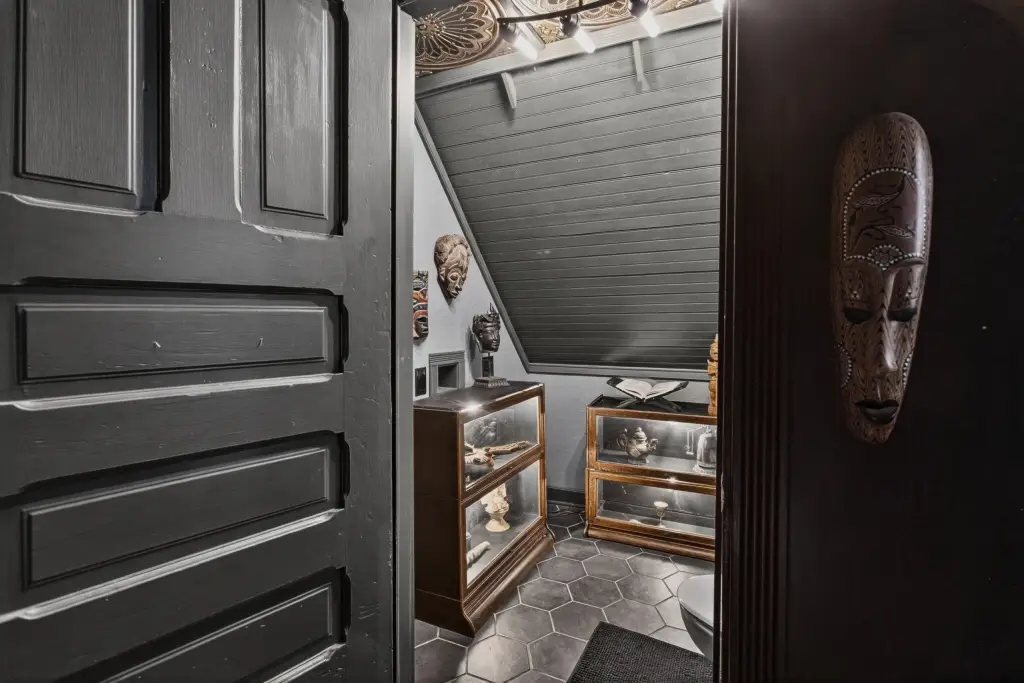
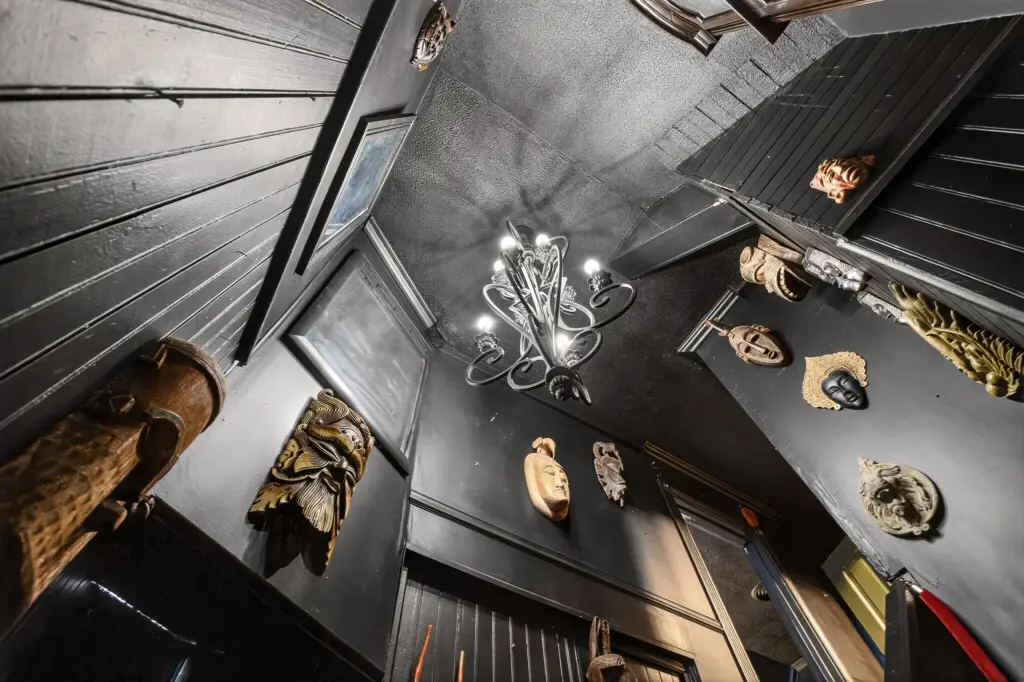
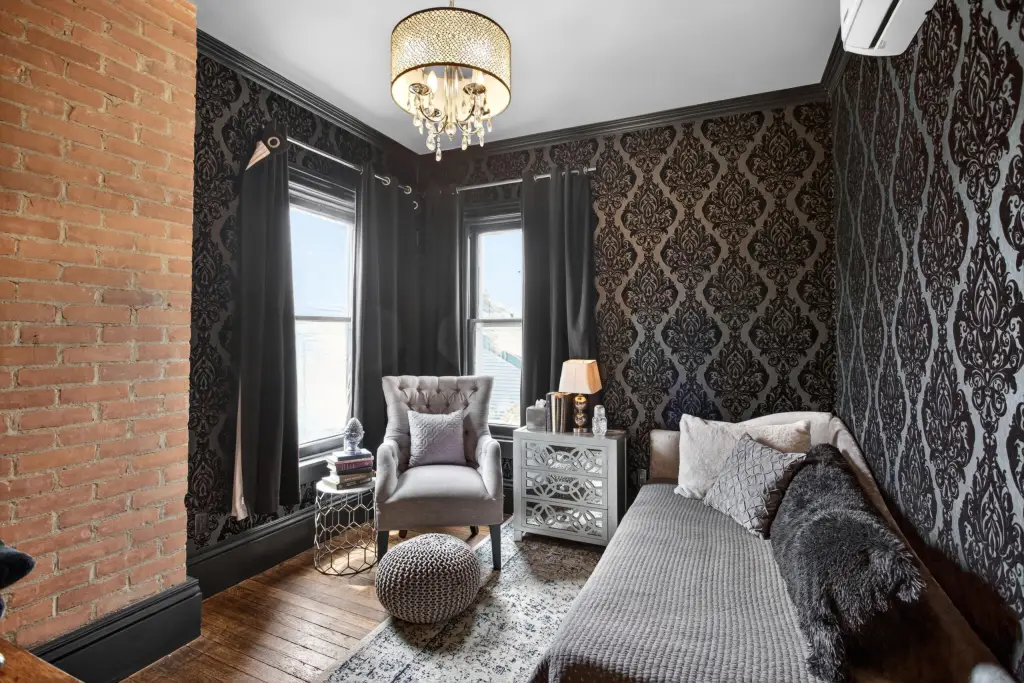
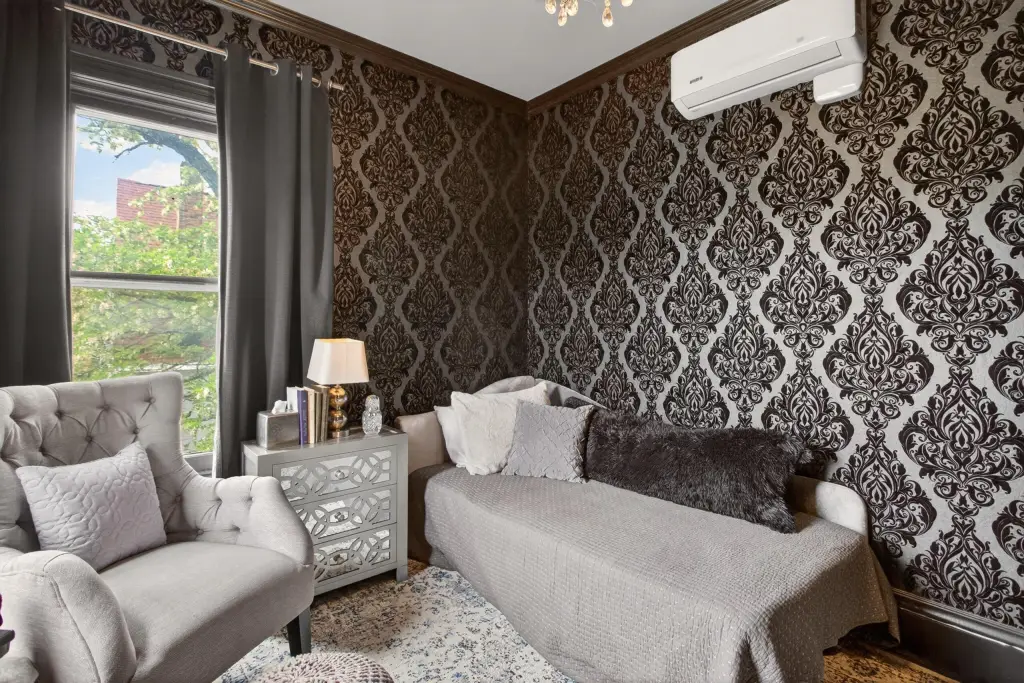
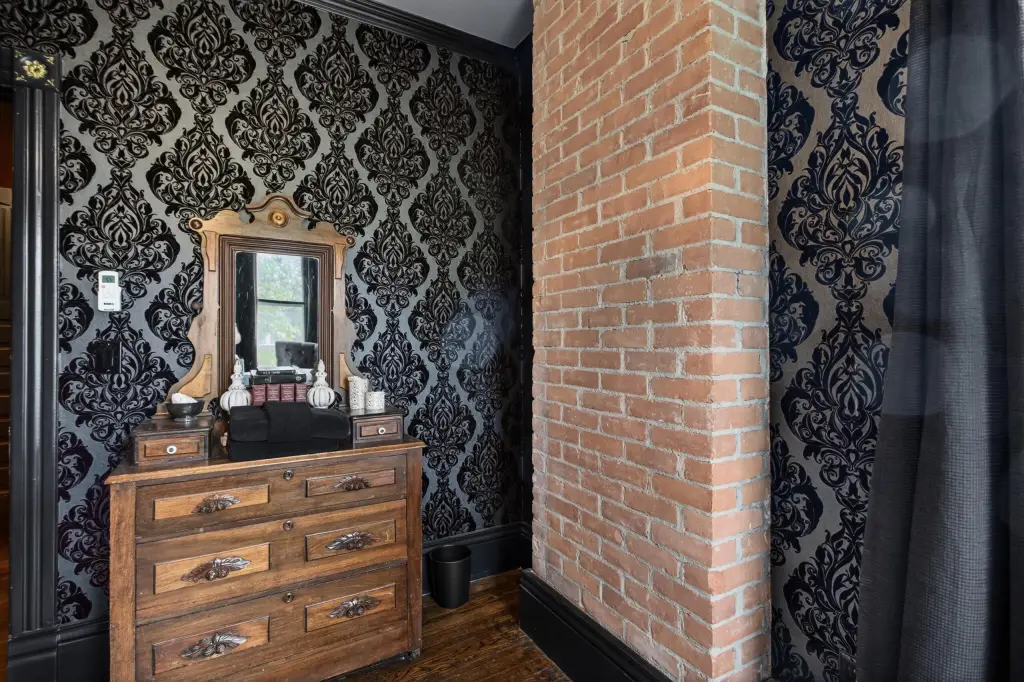
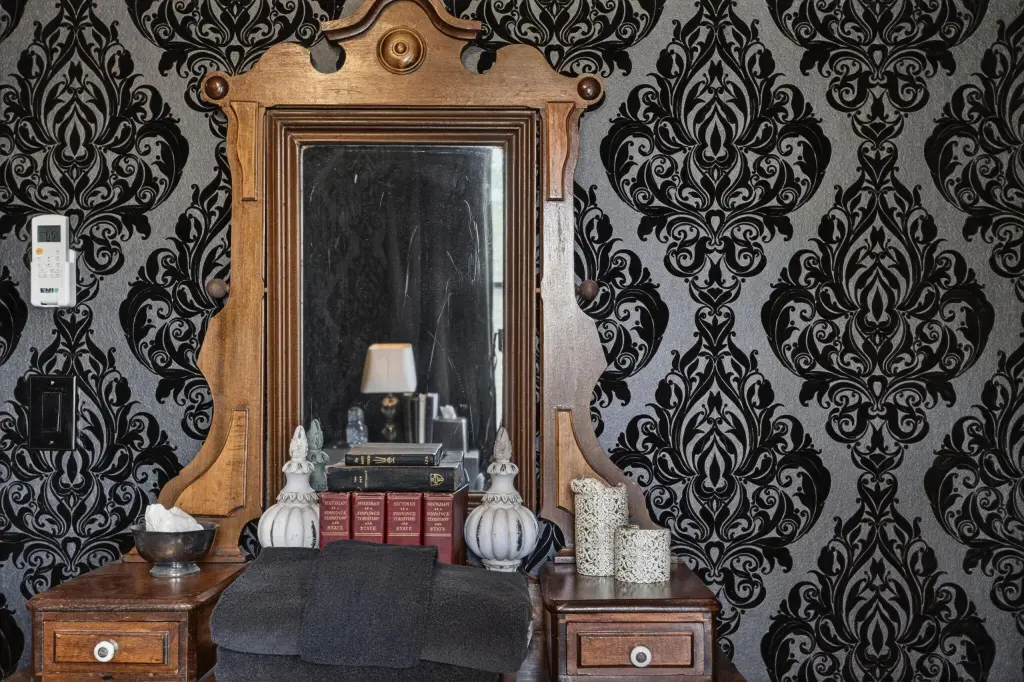
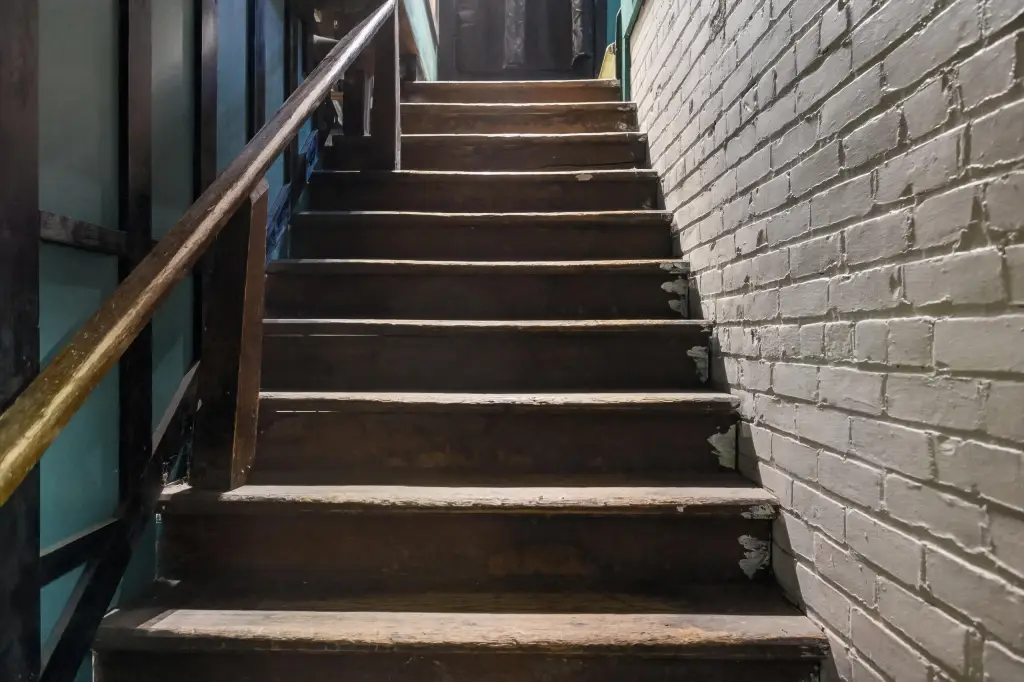
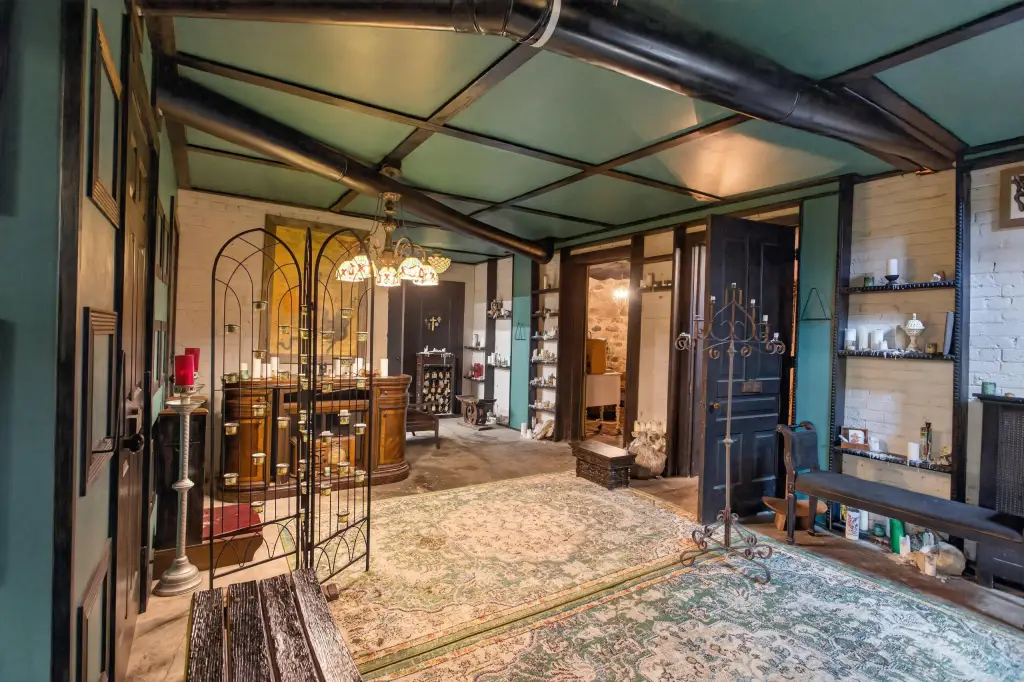
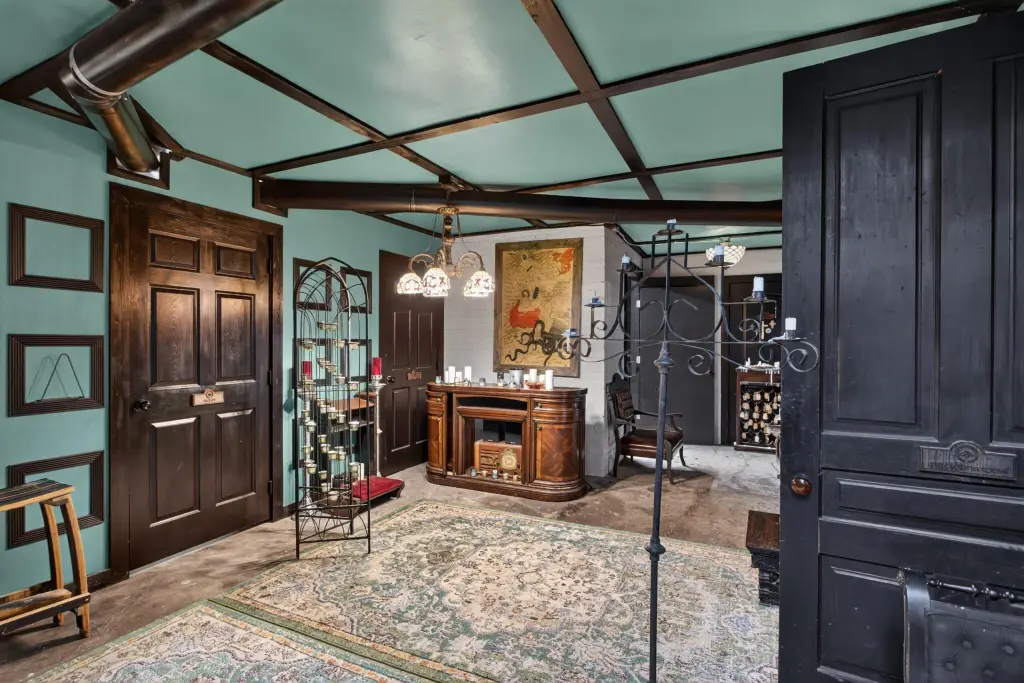
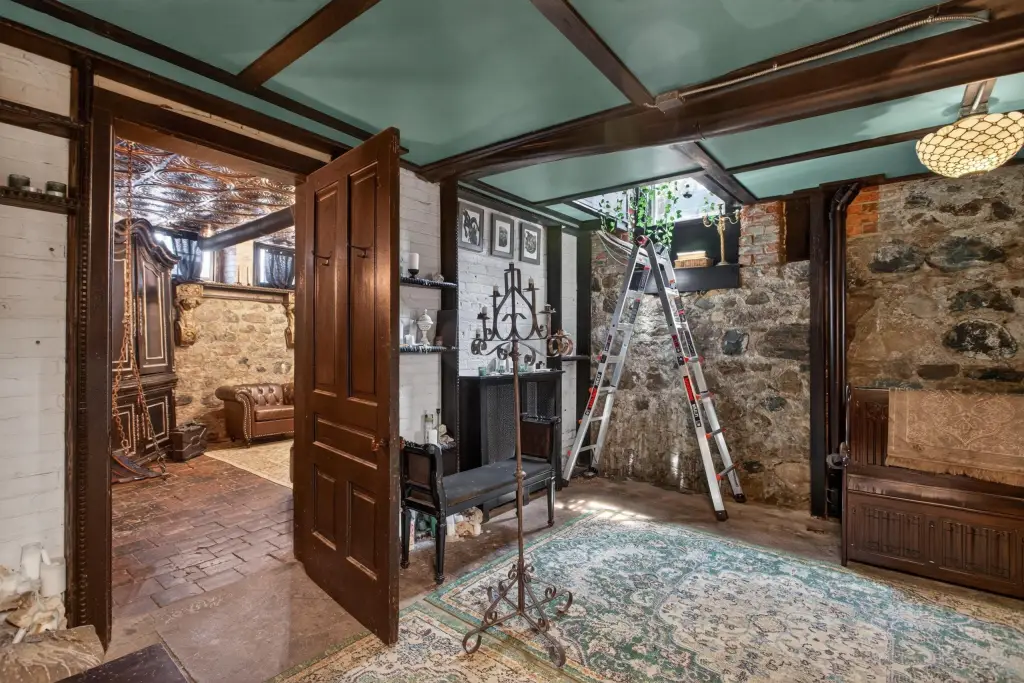
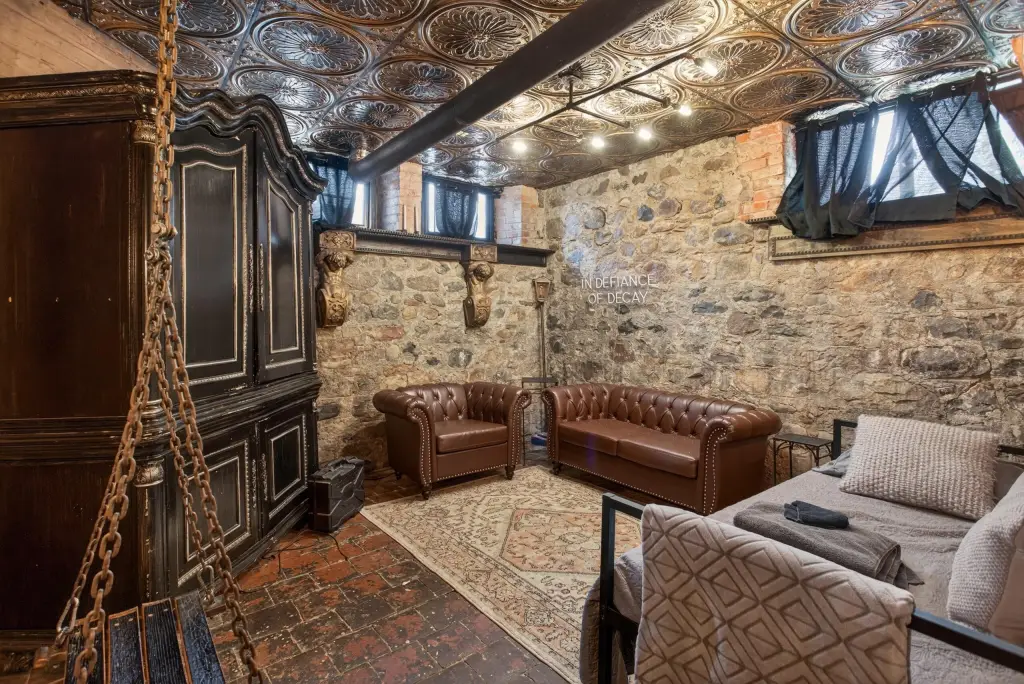
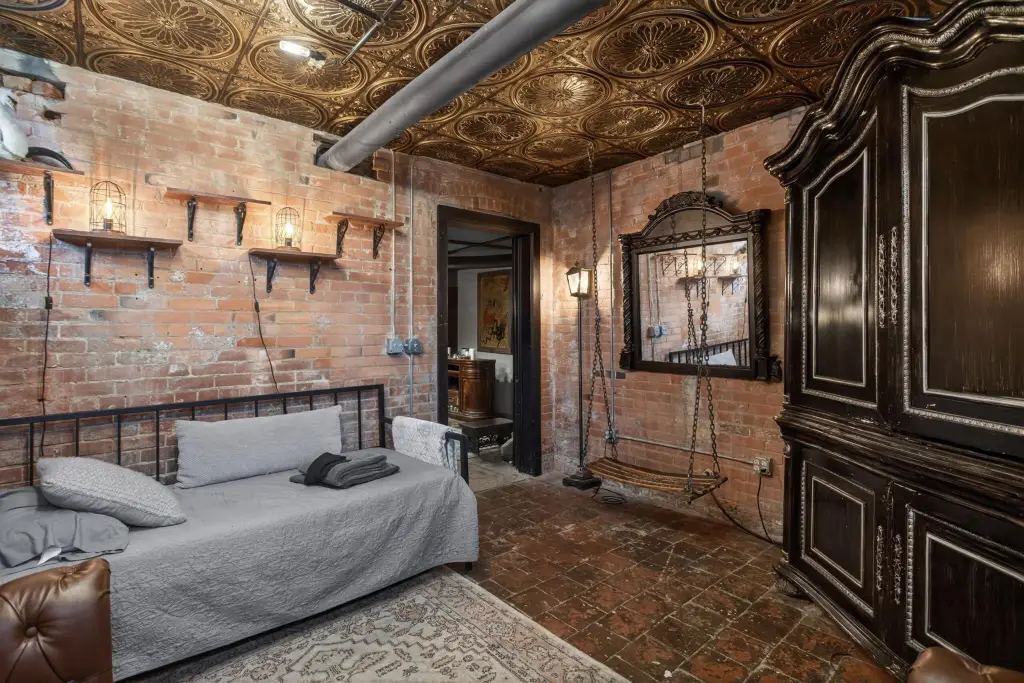
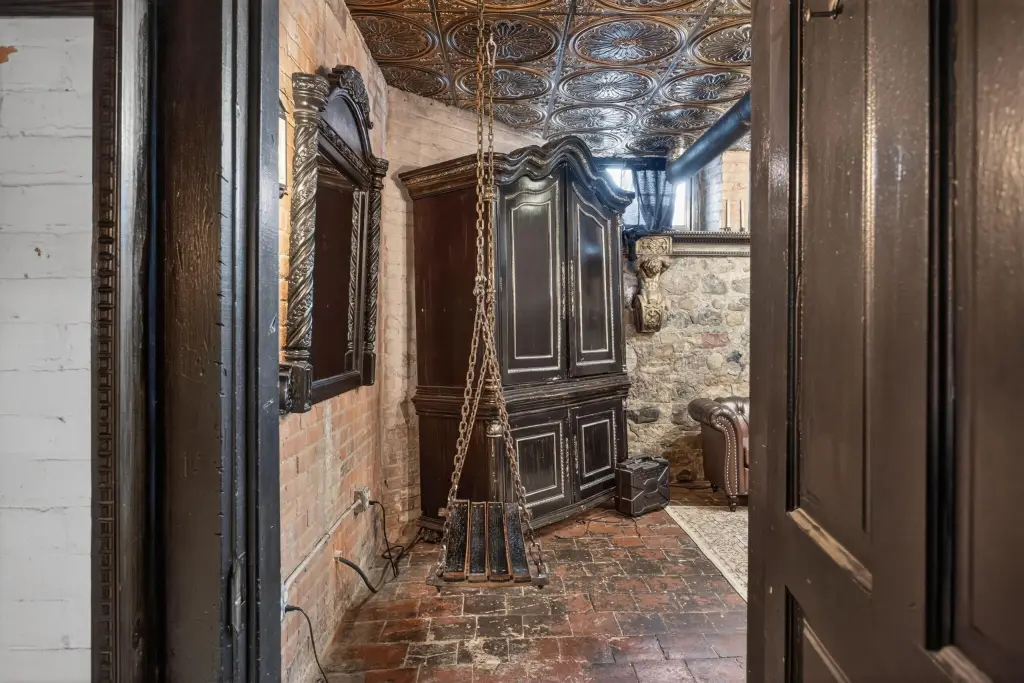
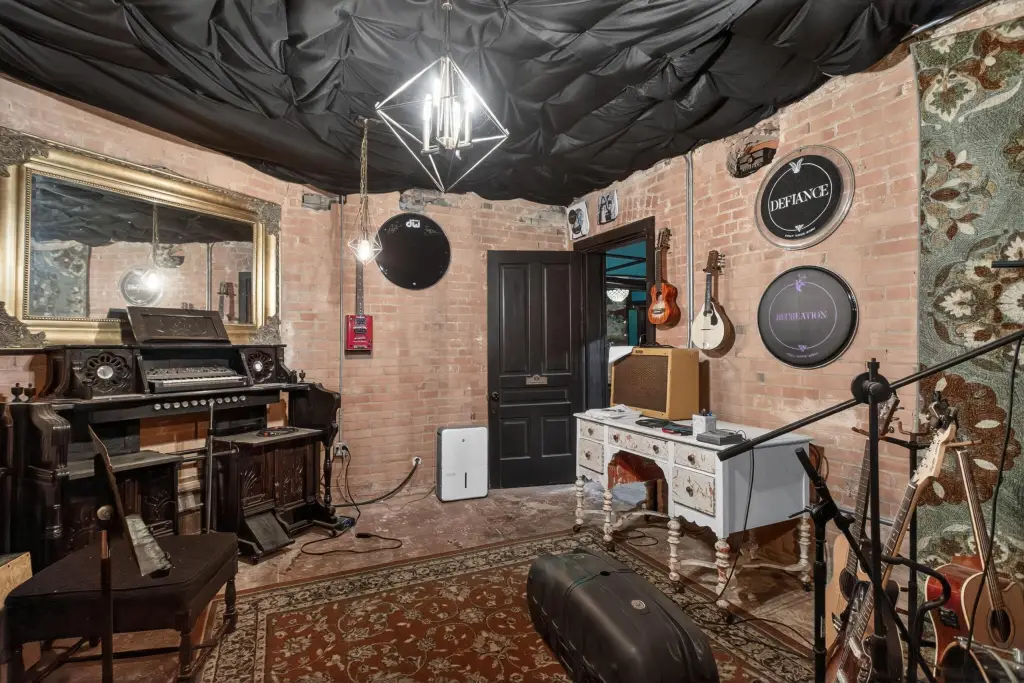
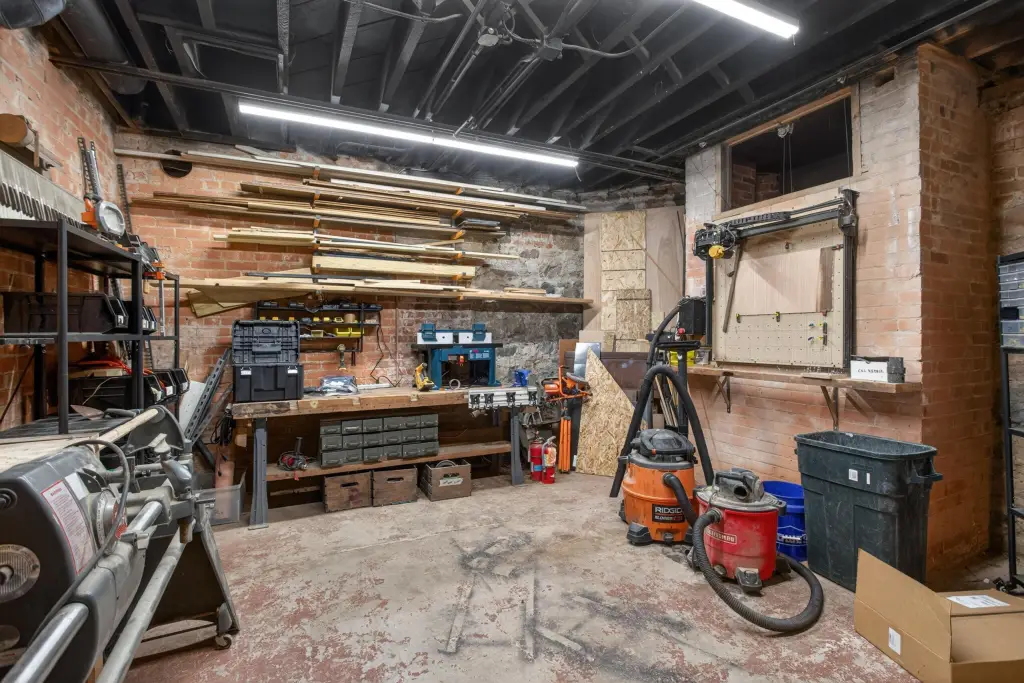
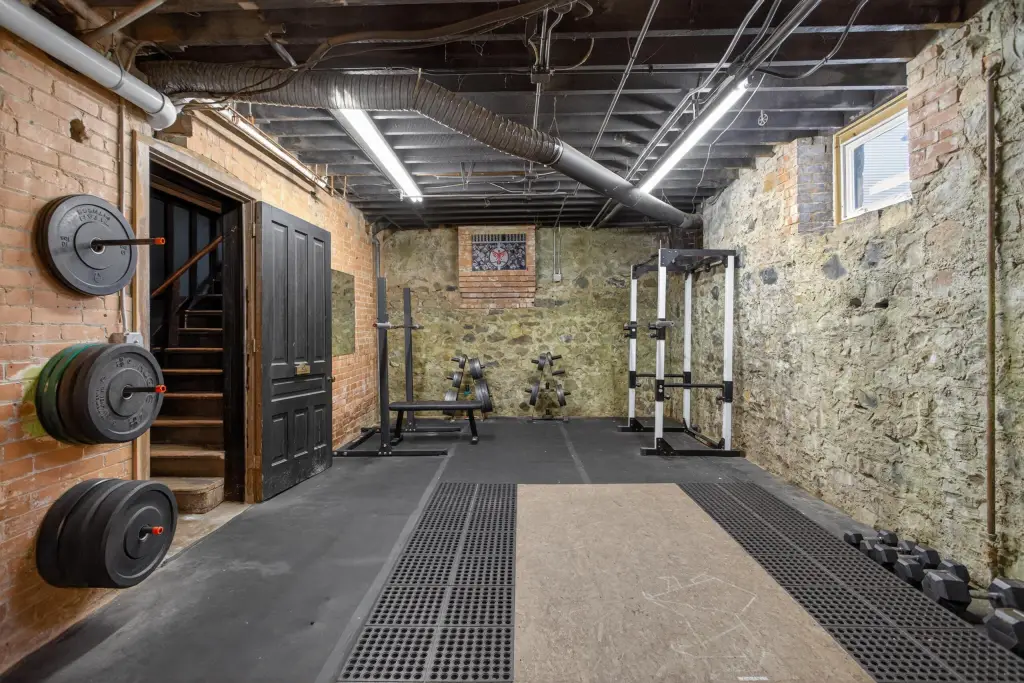
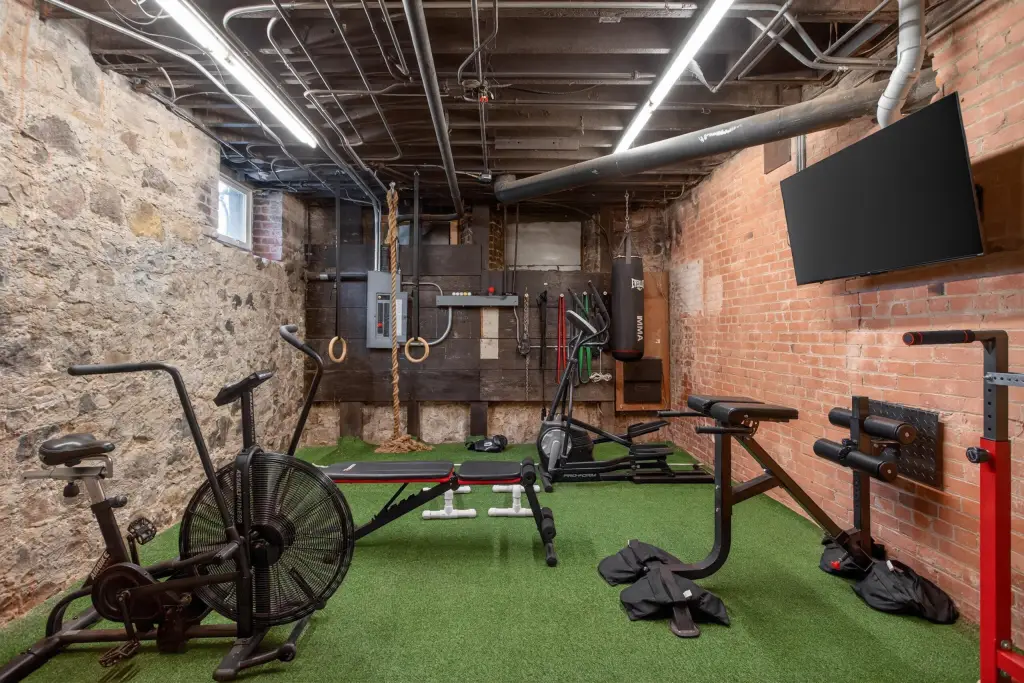
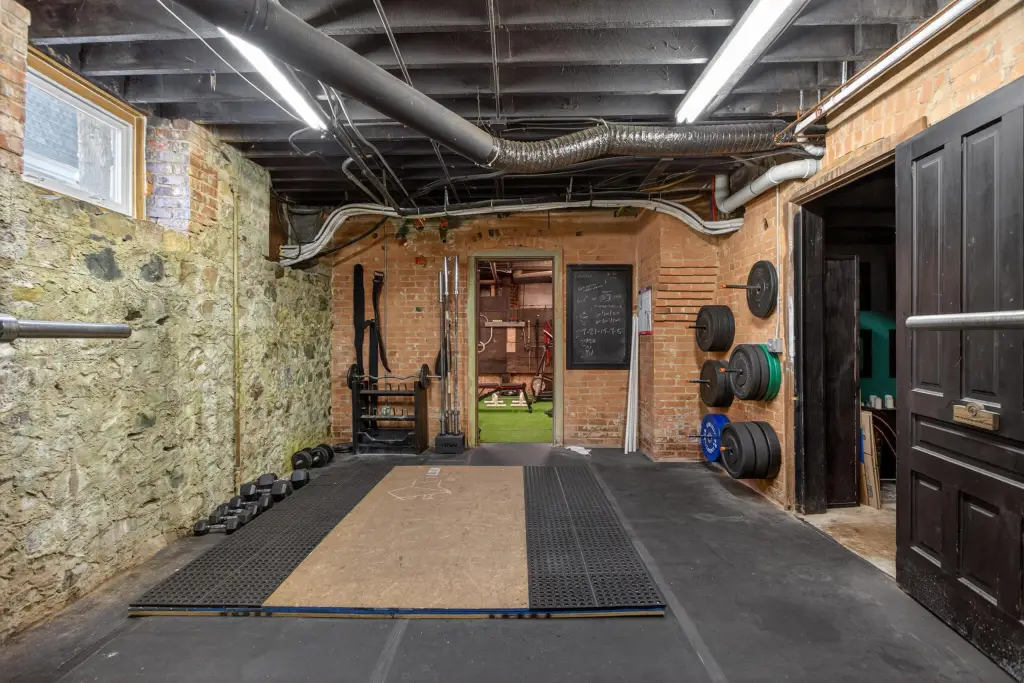
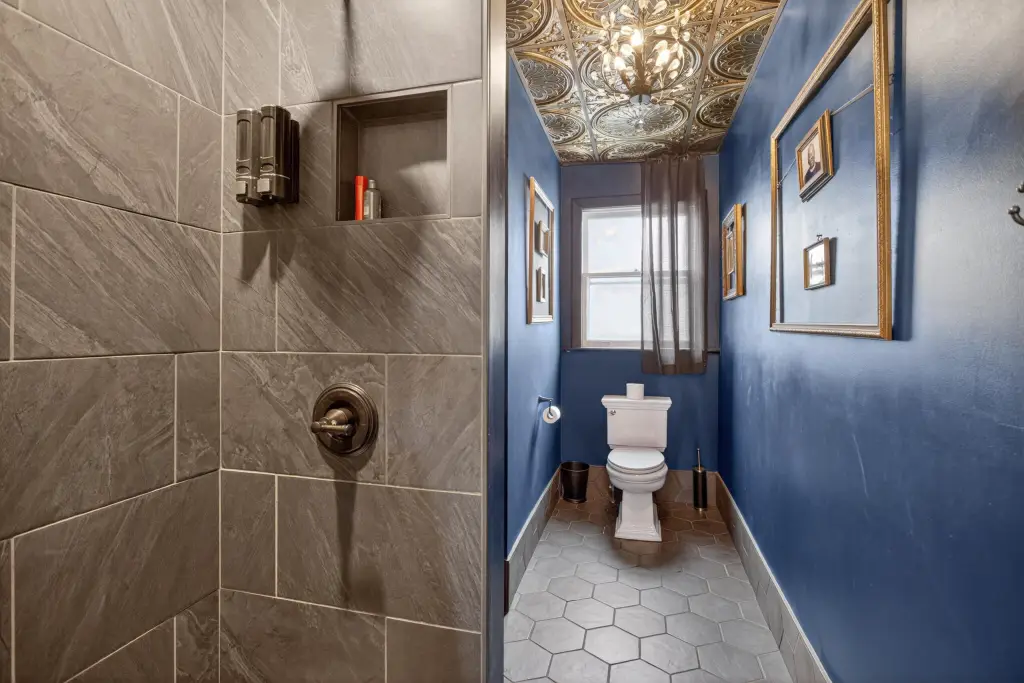
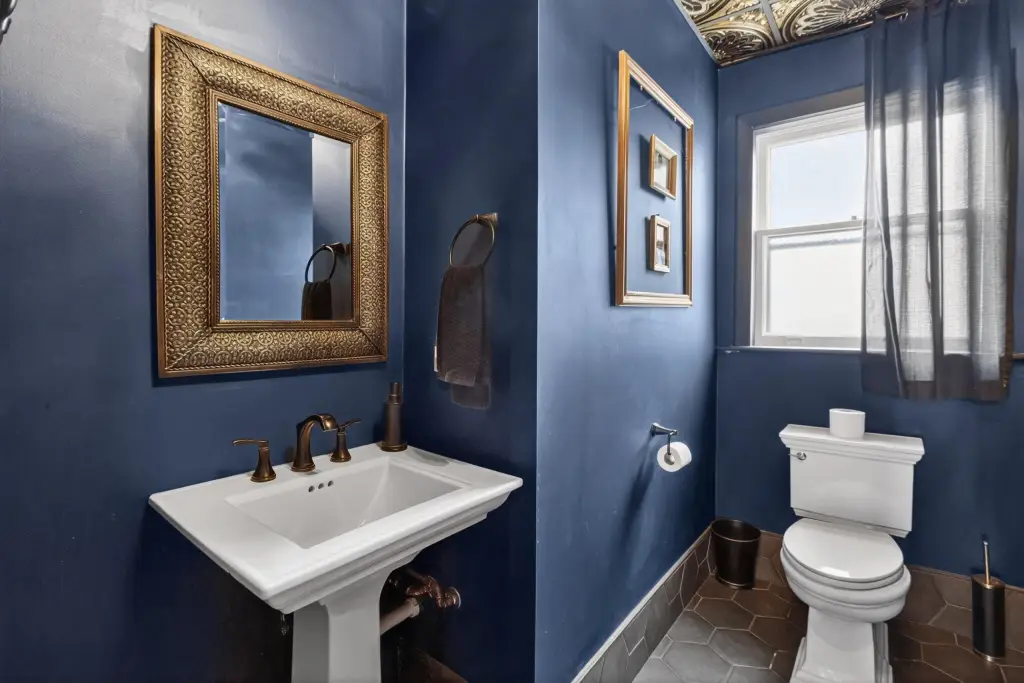
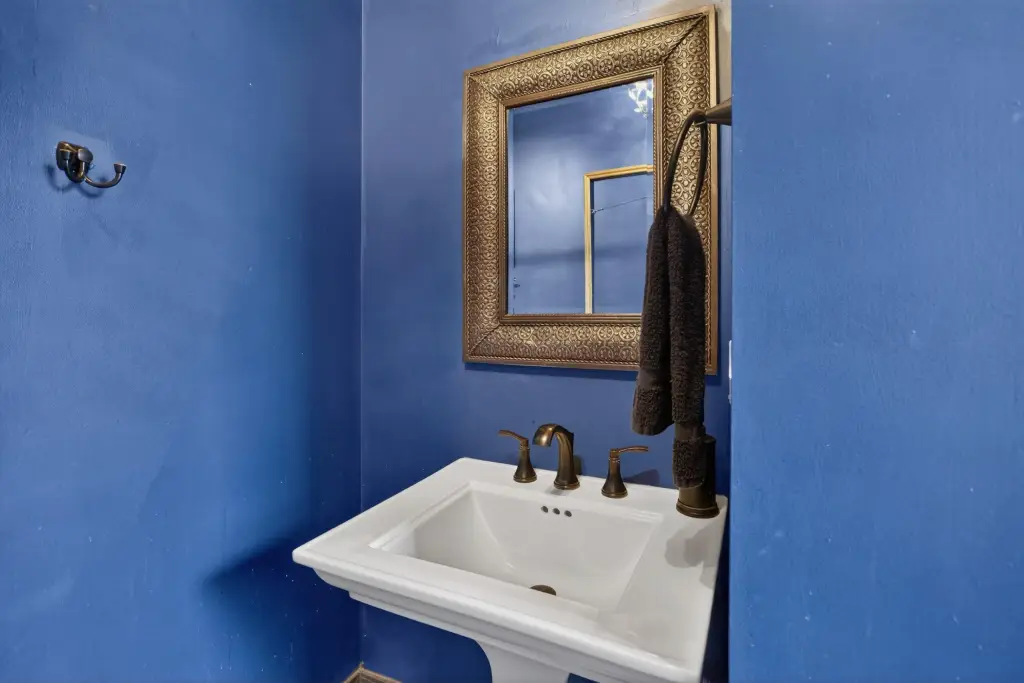
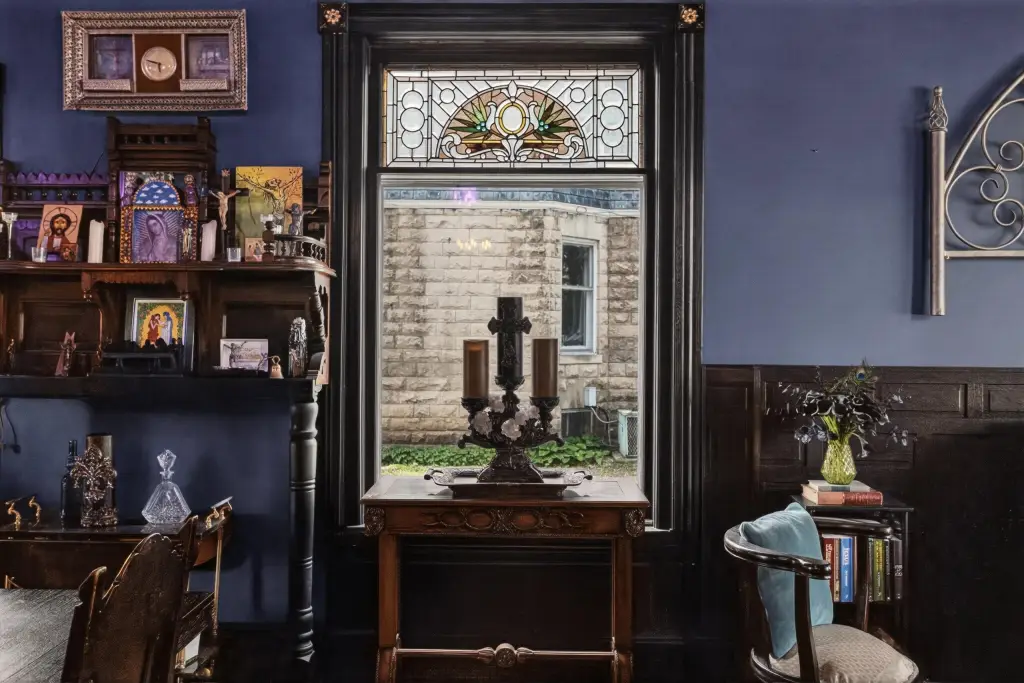
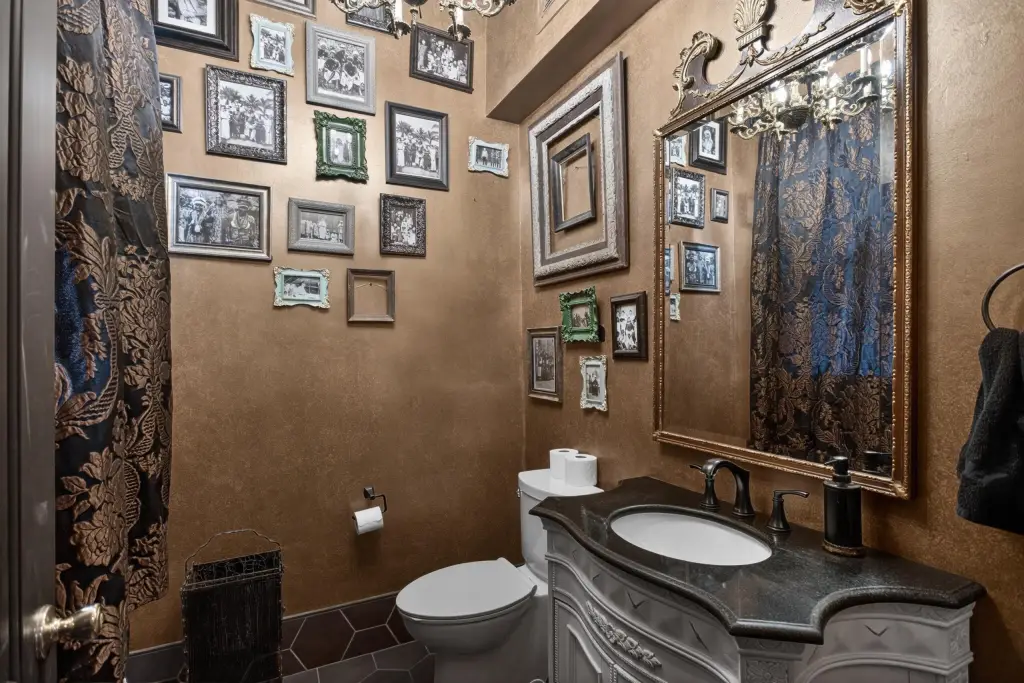
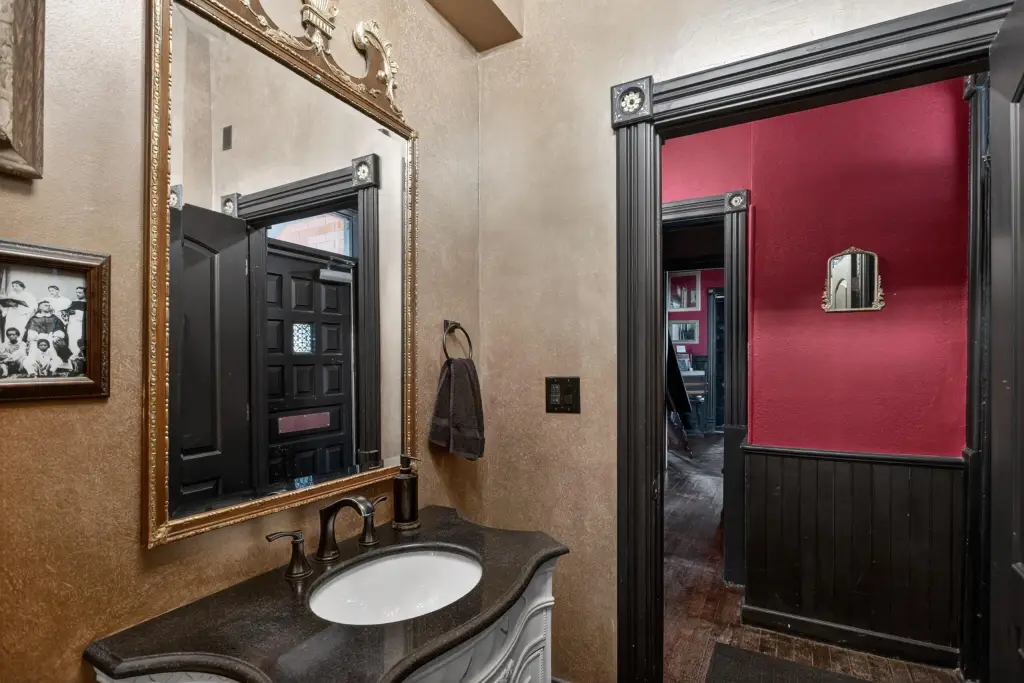
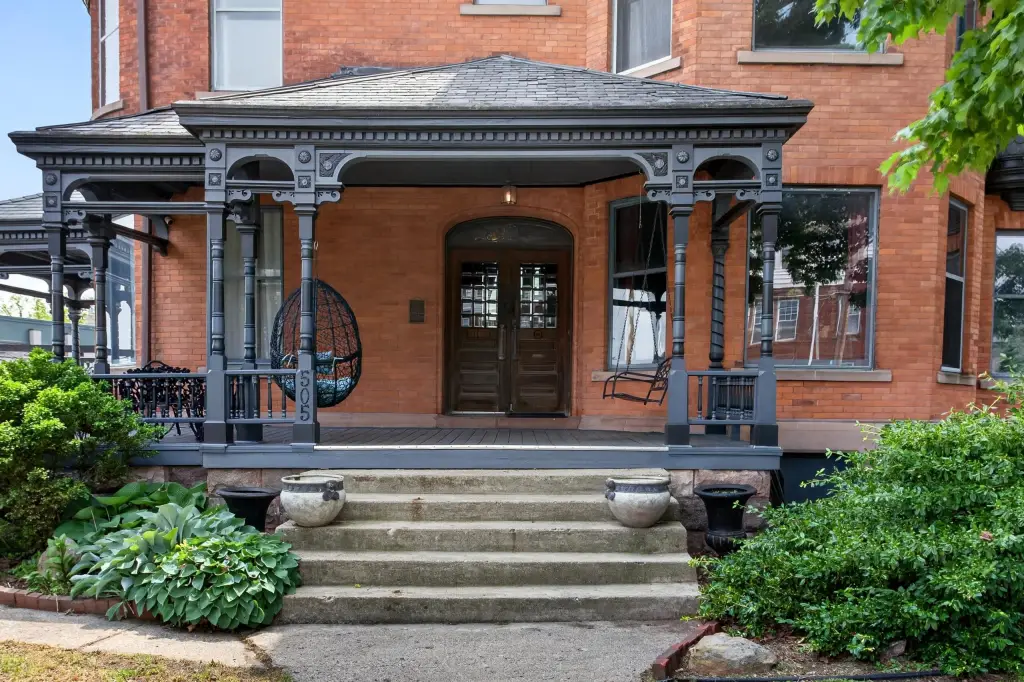
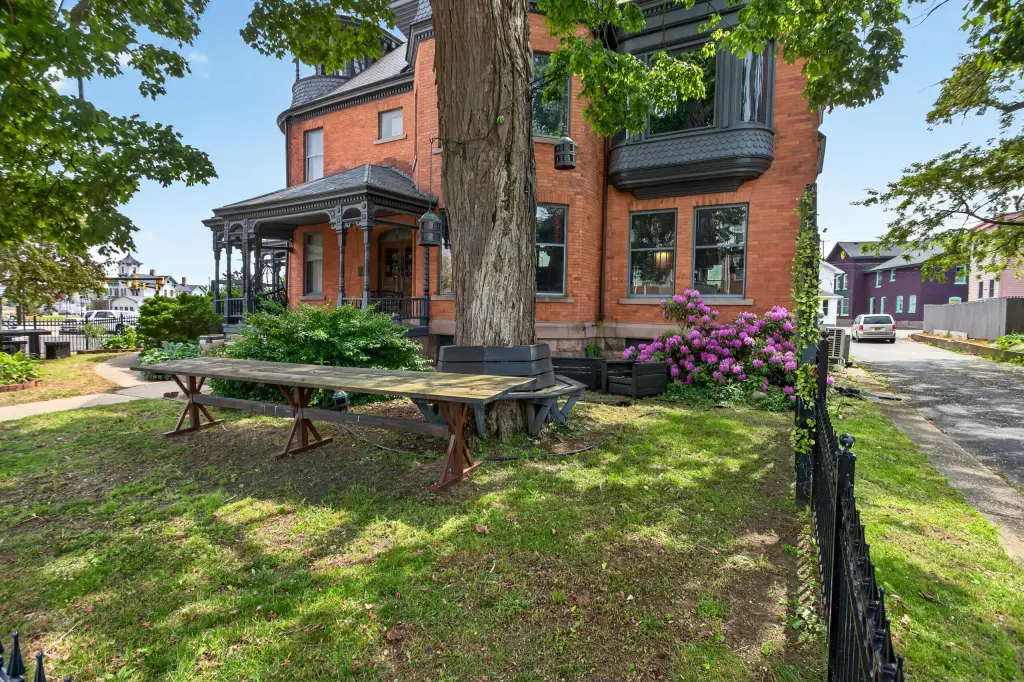
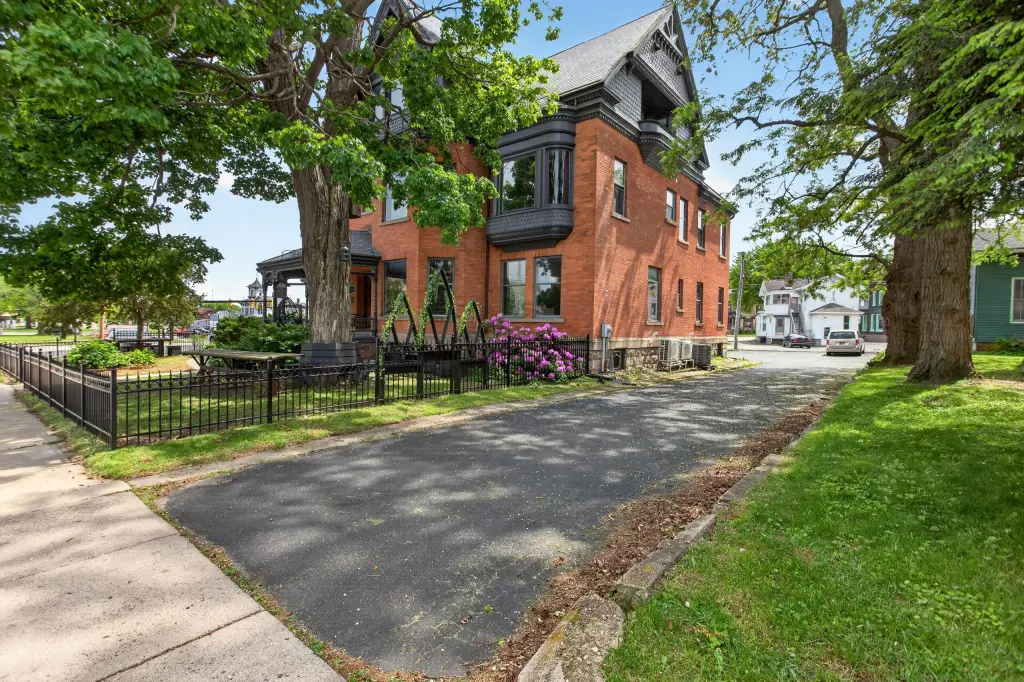
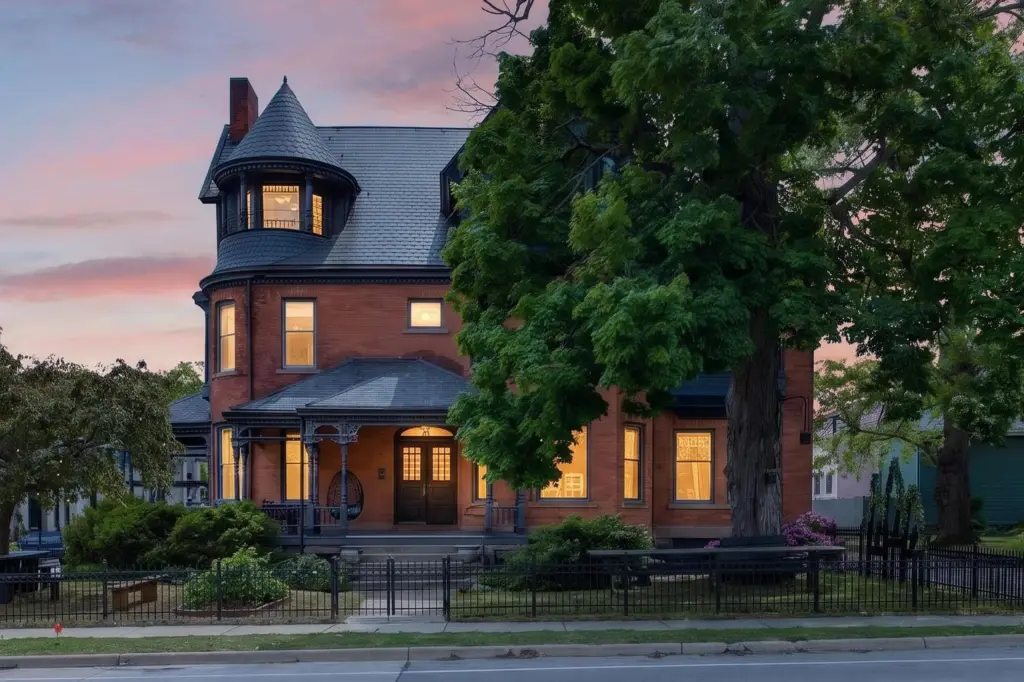
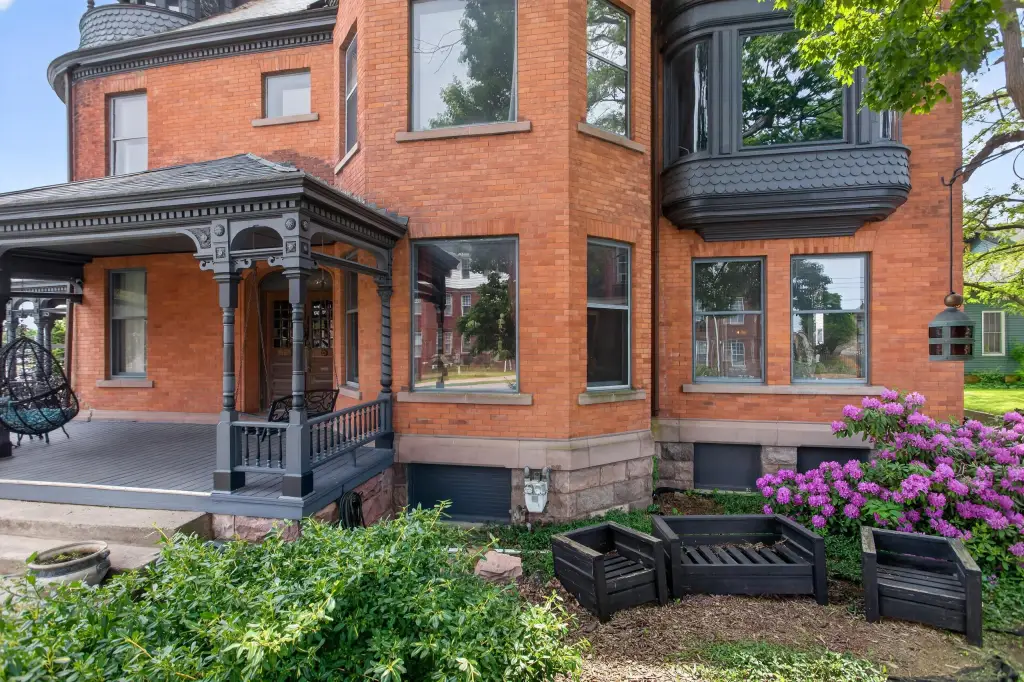
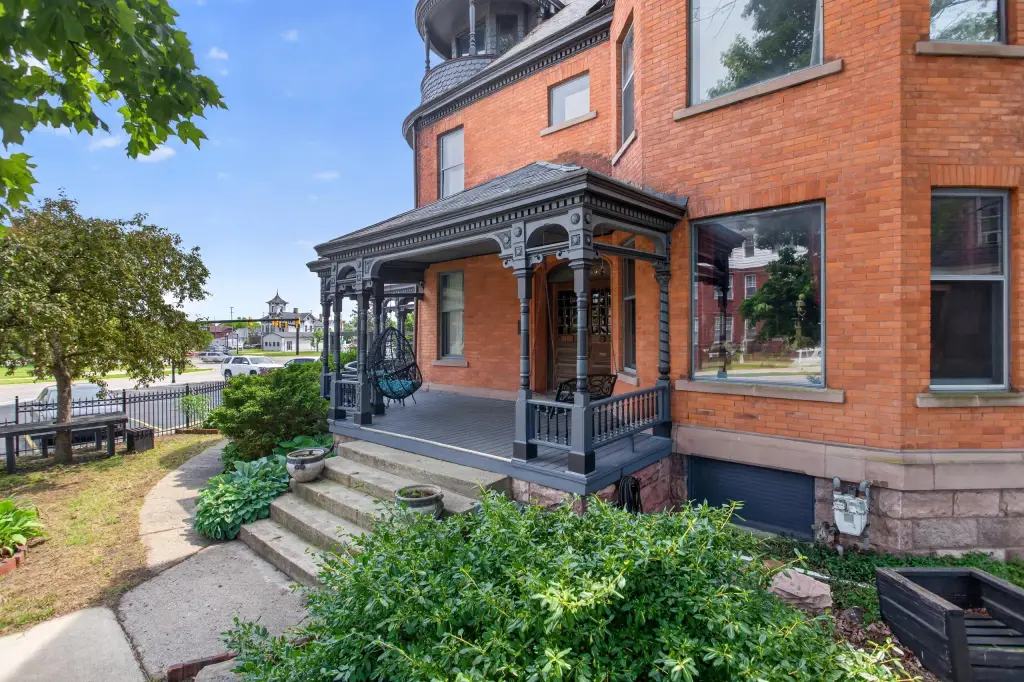
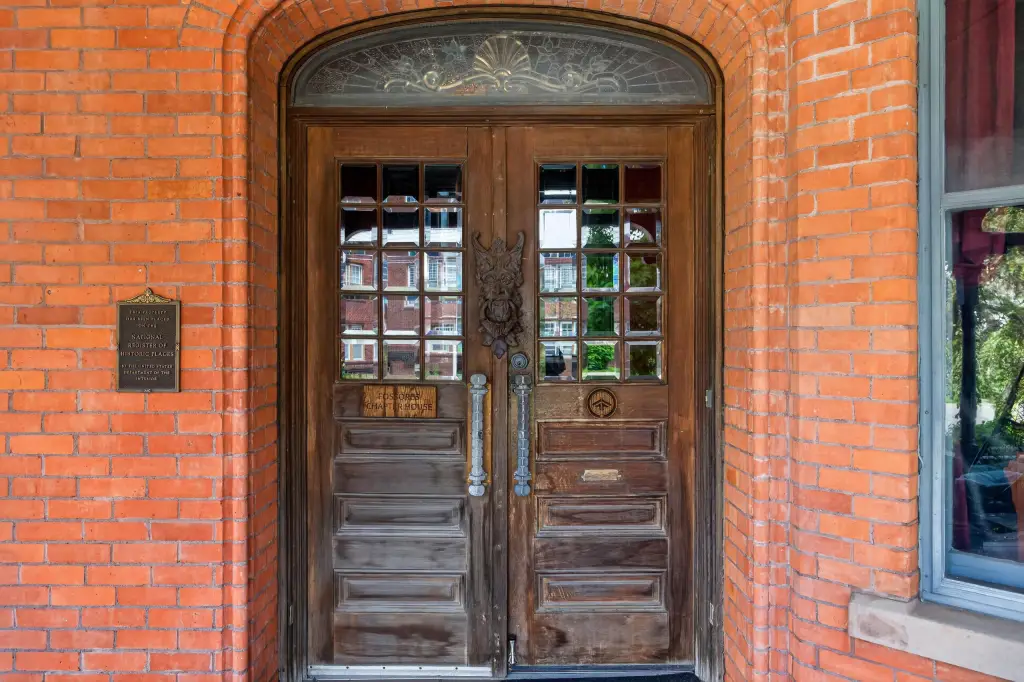
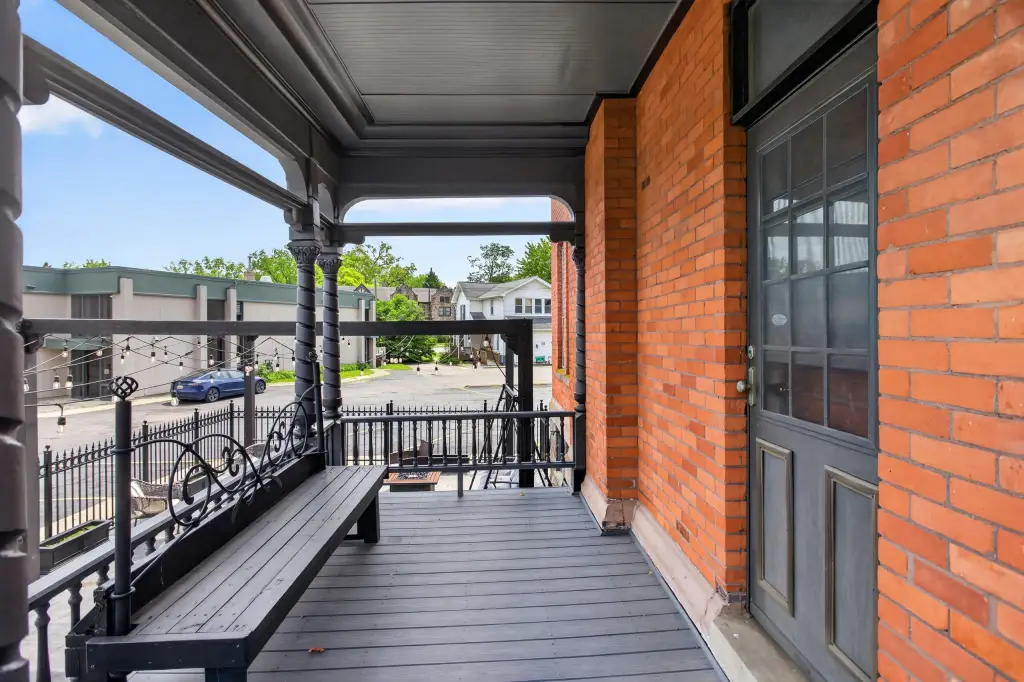
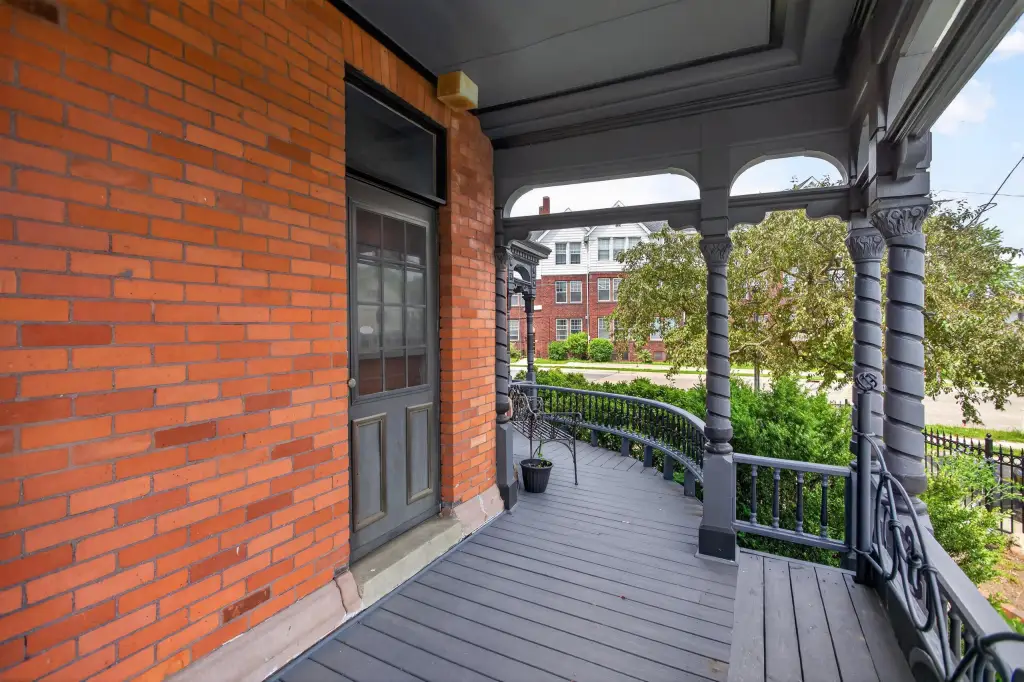
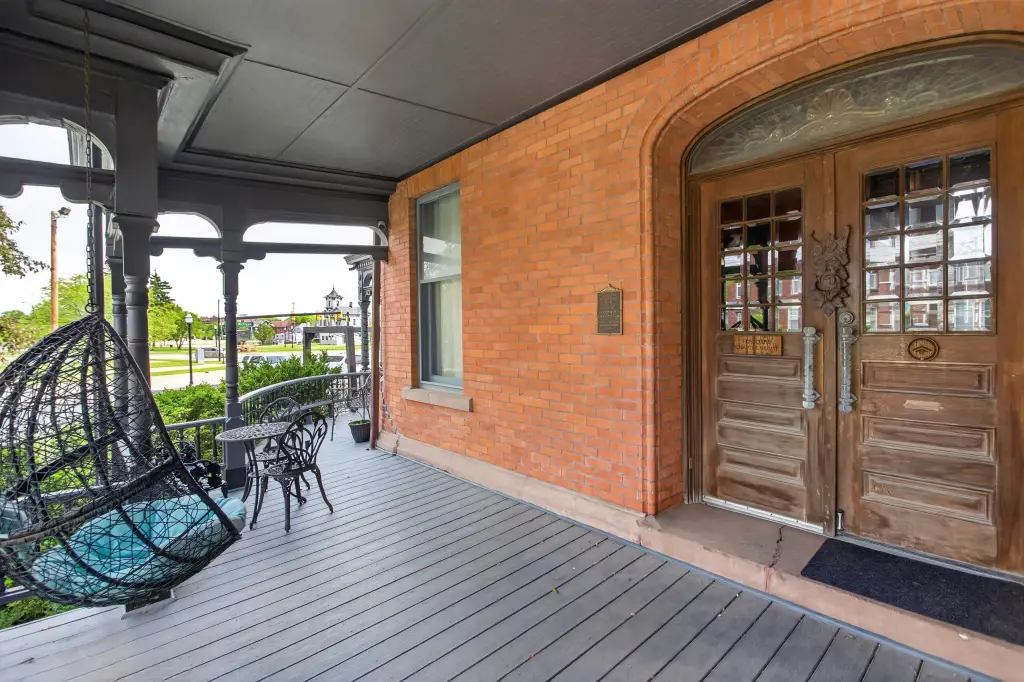
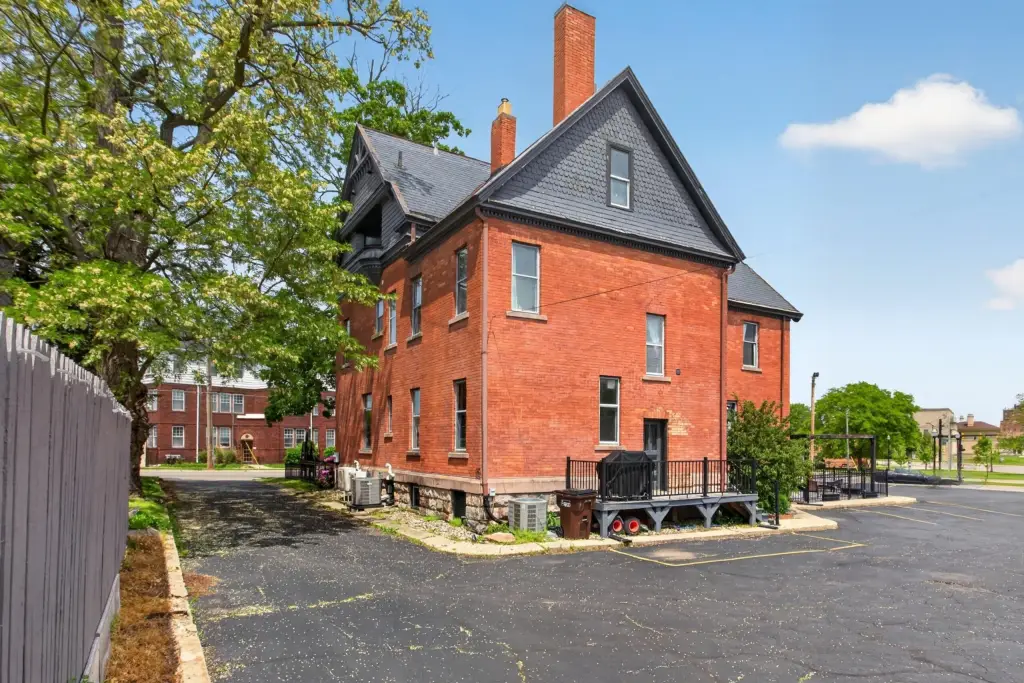
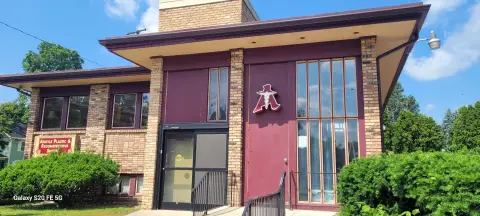
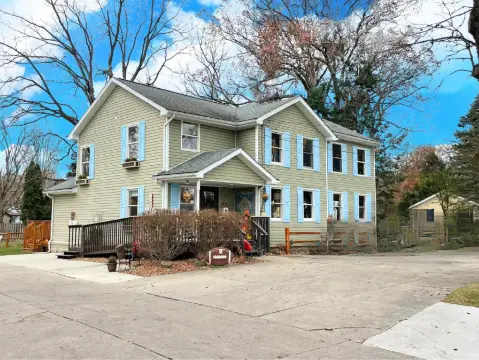
Built in 1900, this brick mixed-use property provides 6,357 square feet across four usable levels on a 0.3-acre parcel. The building retains original architectural details and includes upper-level rooms, renovated bathrooms, third-floor laundry, basement space, and broadband service. Slate roofing, forced-air heat, and central air are in place, with mini-split systems serving the upper floors.
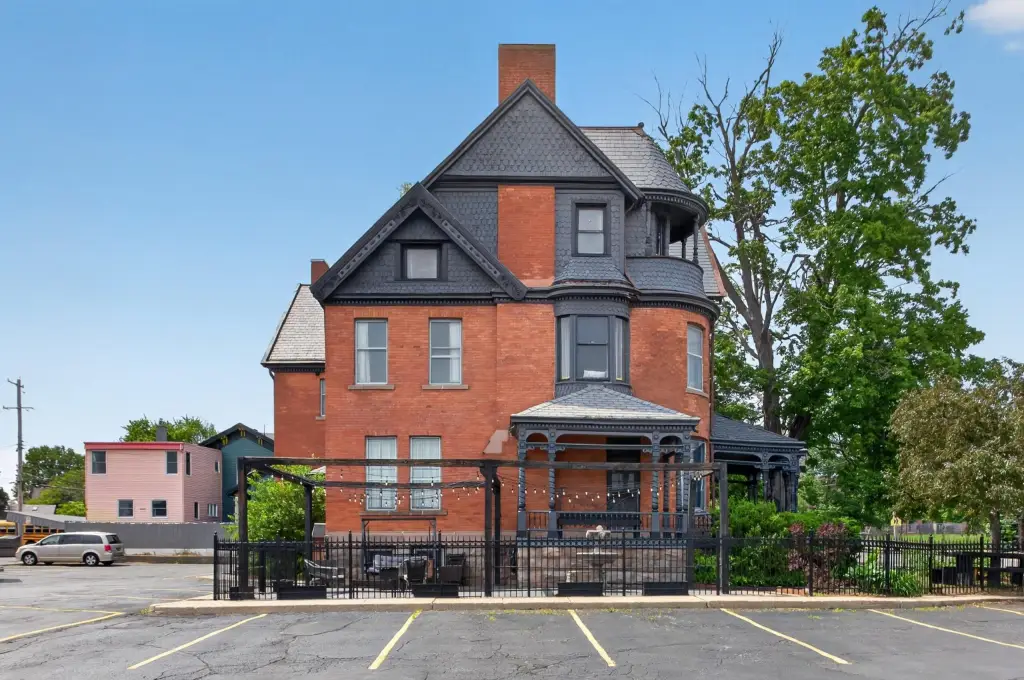
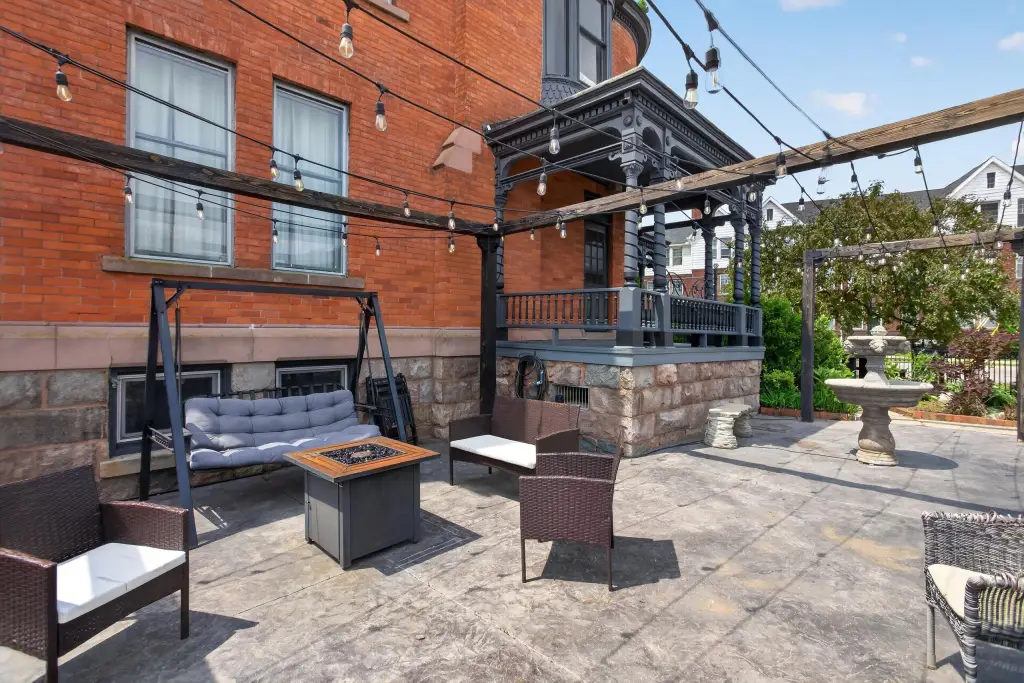
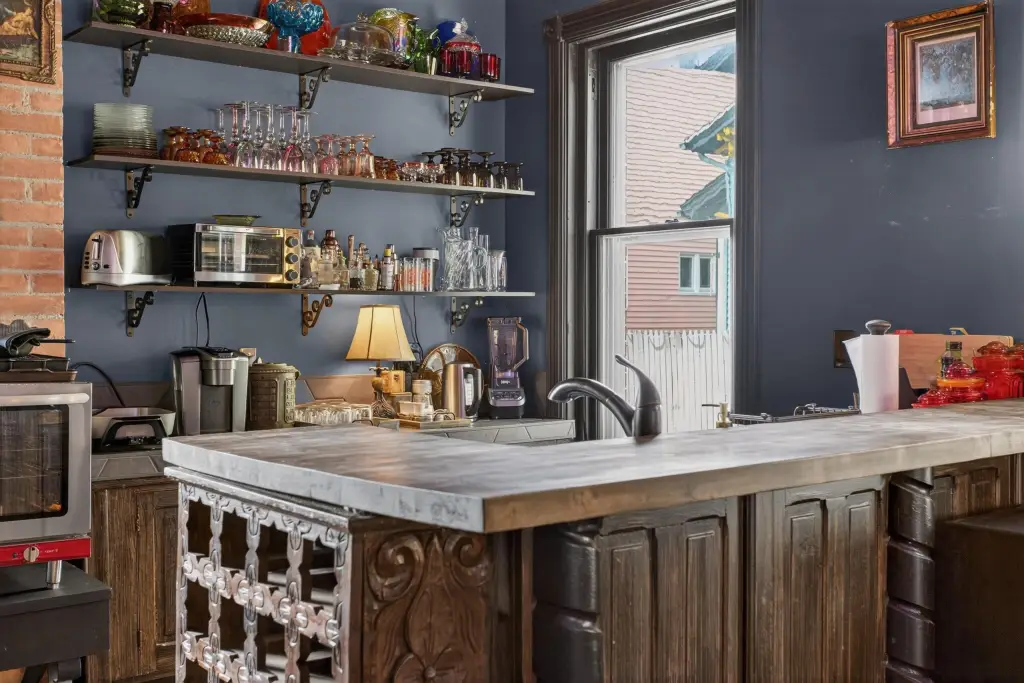
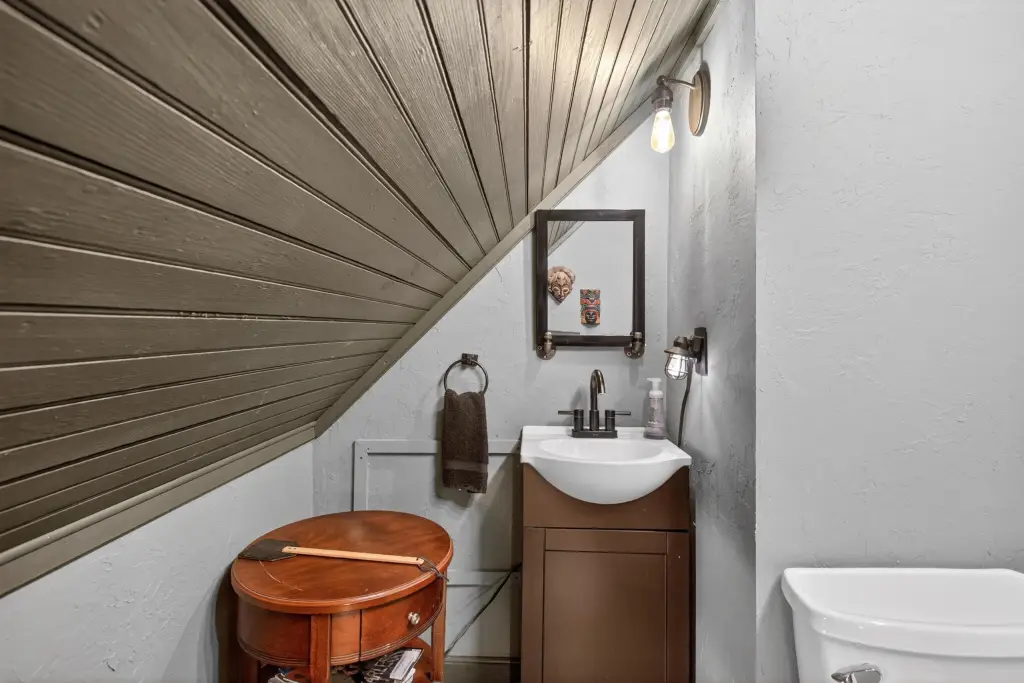
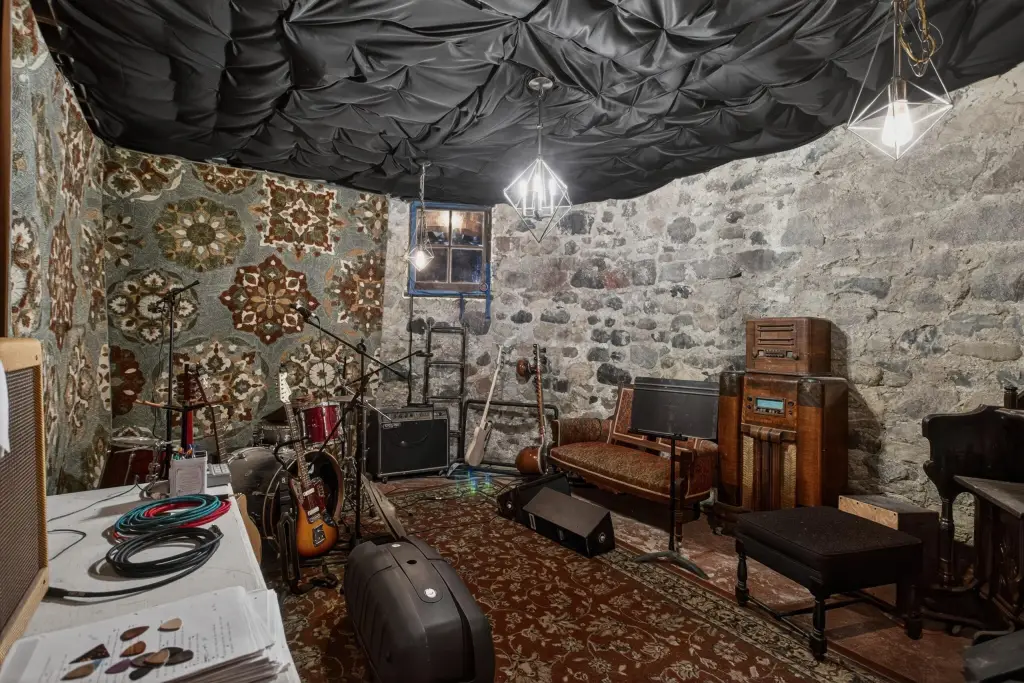
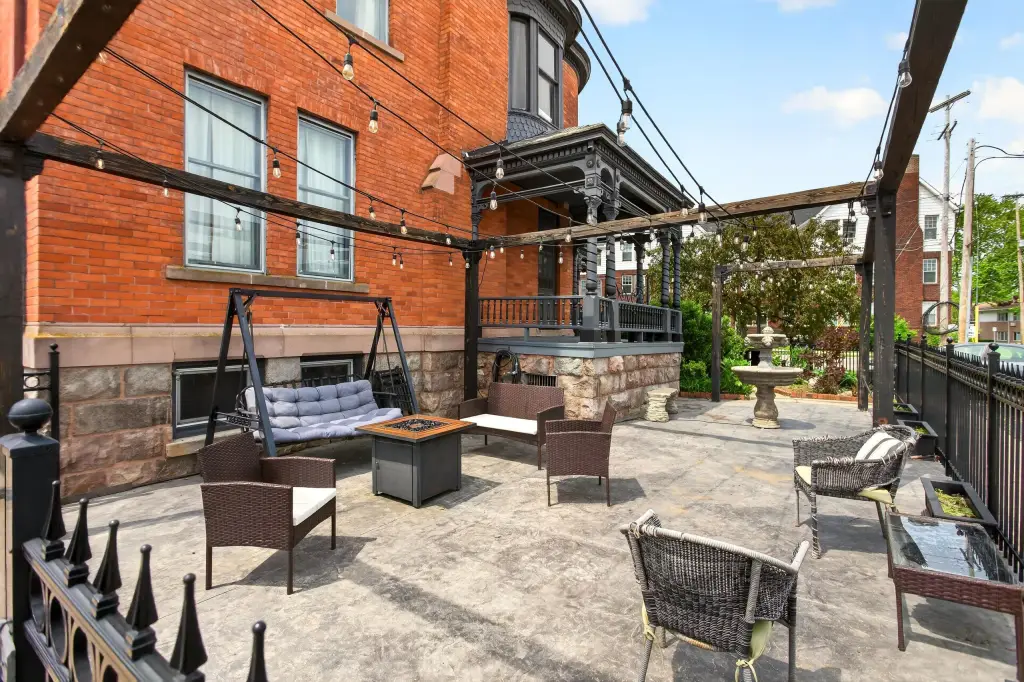
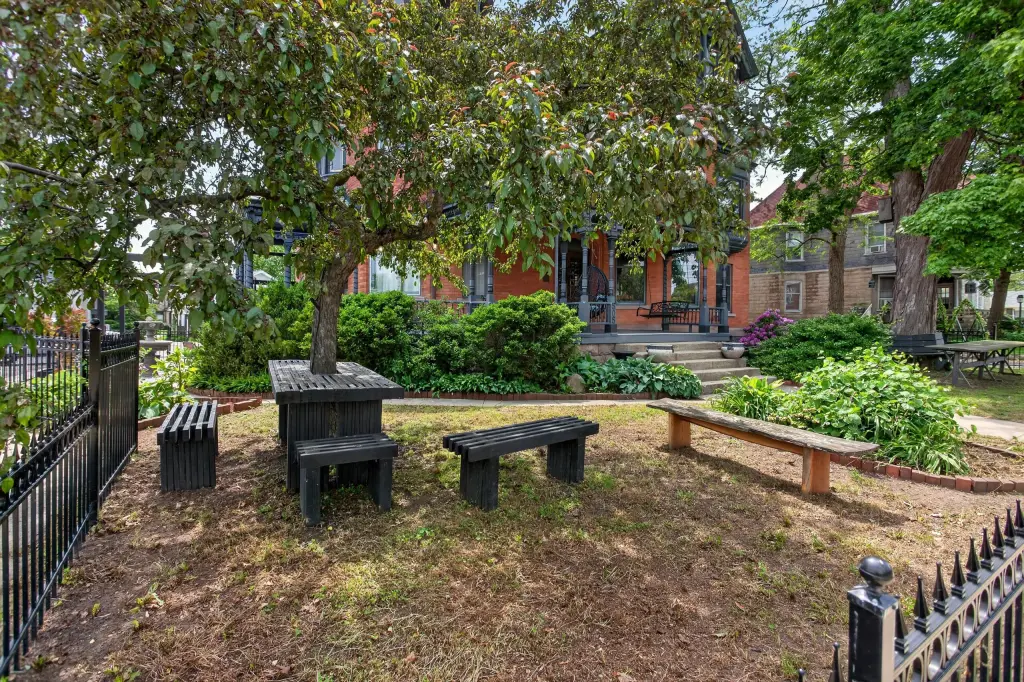
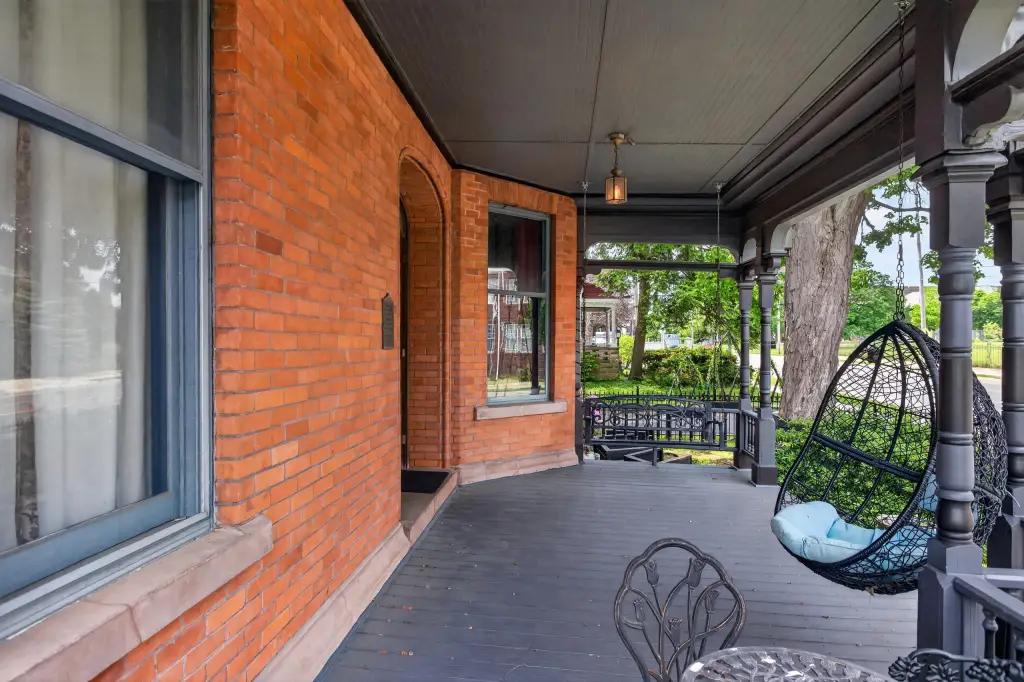
Major work completed from 2019 through 2023 includes substantial plumbing and electrical updates, bath renovations, asbestos removal, added ceiling insulation, a new main-level HVAC system, and basement wall restoration. Exterior improvements include a concrete patio, pergola, rear deck, wrought-iron fencing, and accessibility-oriented enhancements. The parking lot was resurfaced and repaired in 2023.
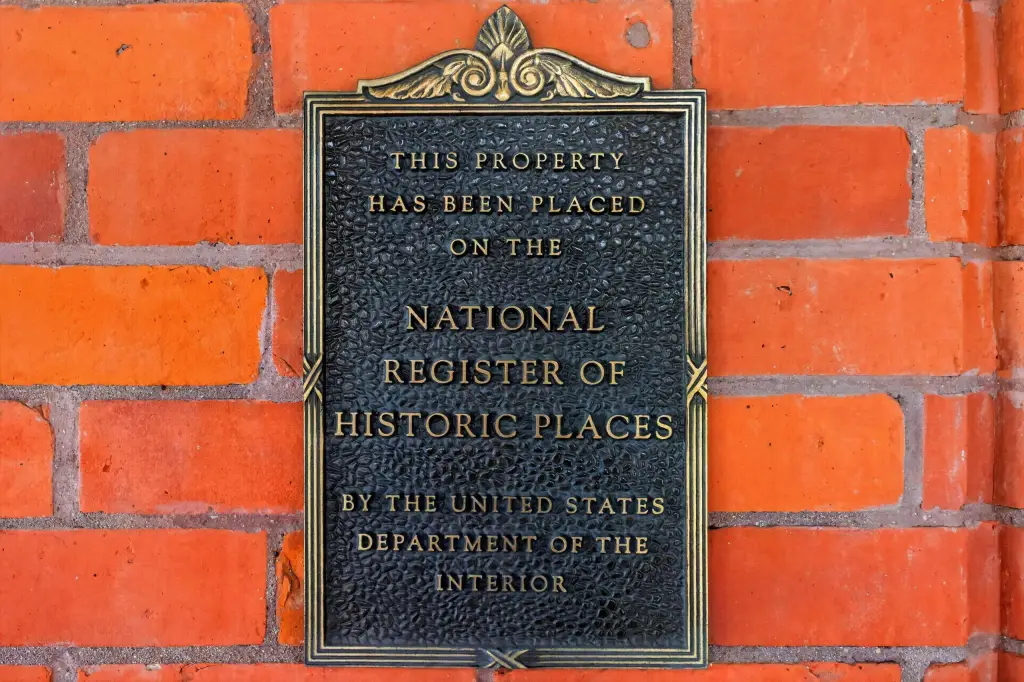
The property is located in Downtown Jackson’s Historic District near restaurants, entertainment, businesses, and redevelopment activity. Its downtown setting and existing improvements support a range of mixed-use configurations, subject to applicable approvals.
Major work completed from 2019 through 2023 includes substantial plumbing and electrical updates, bath renovations, asbestos removal, added ceiling insulation, a new main-level HVAC system, and basement wall restoration. Exterior improvements include a concrete patio, pergola, rear deck, wrought-iron fencing, and accessibility-oriented enhancements. The parking lot was resurfaced and repaired in 2023.
The property is located in Downtown Jackson’s Historic District near restaurants, entertainment, businesses, and redevelopment activity. Its downtown setting and existing improvements support a range of mixed-use configurations, subject to applicable approvals.
Key Highlights
- 6,357 square feet across four usable levels
- 0.3‑acre parcel in Downtown Jackson’s Historic District
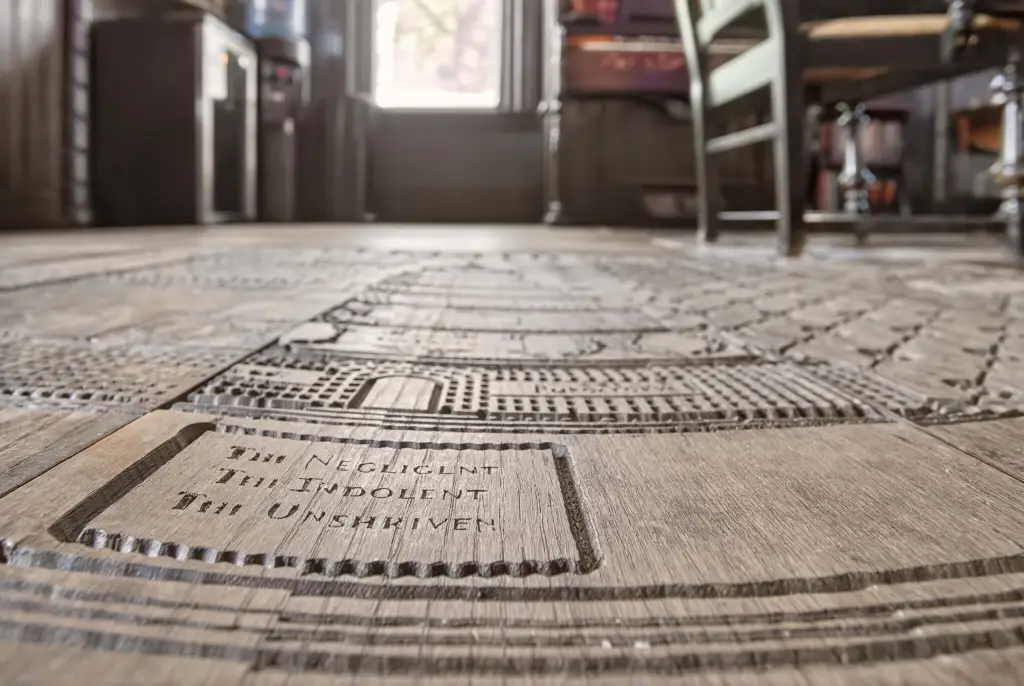
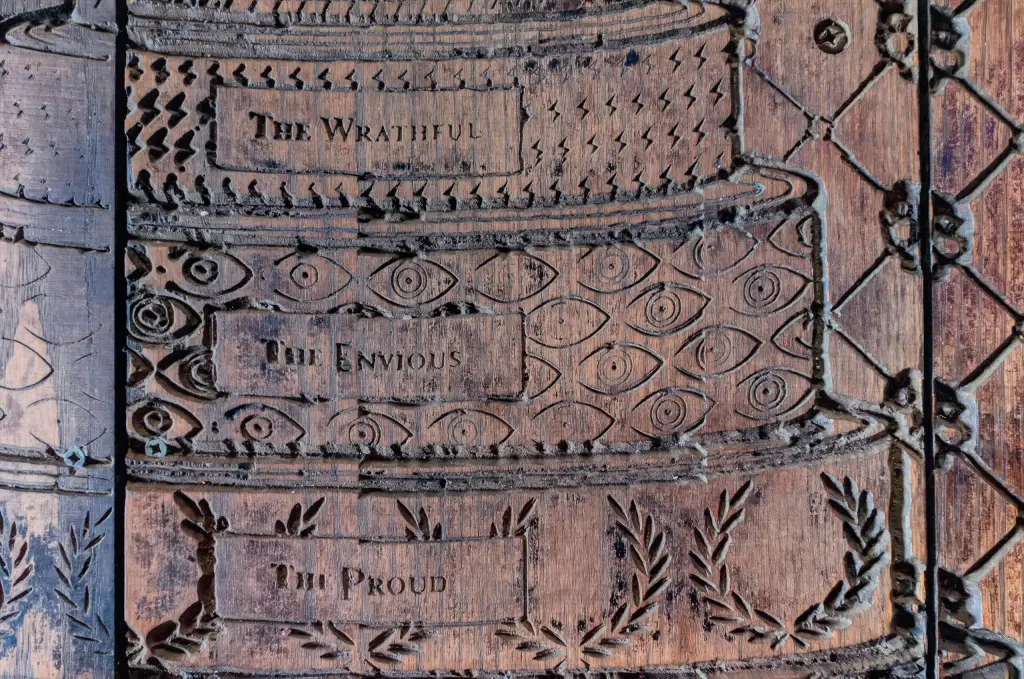
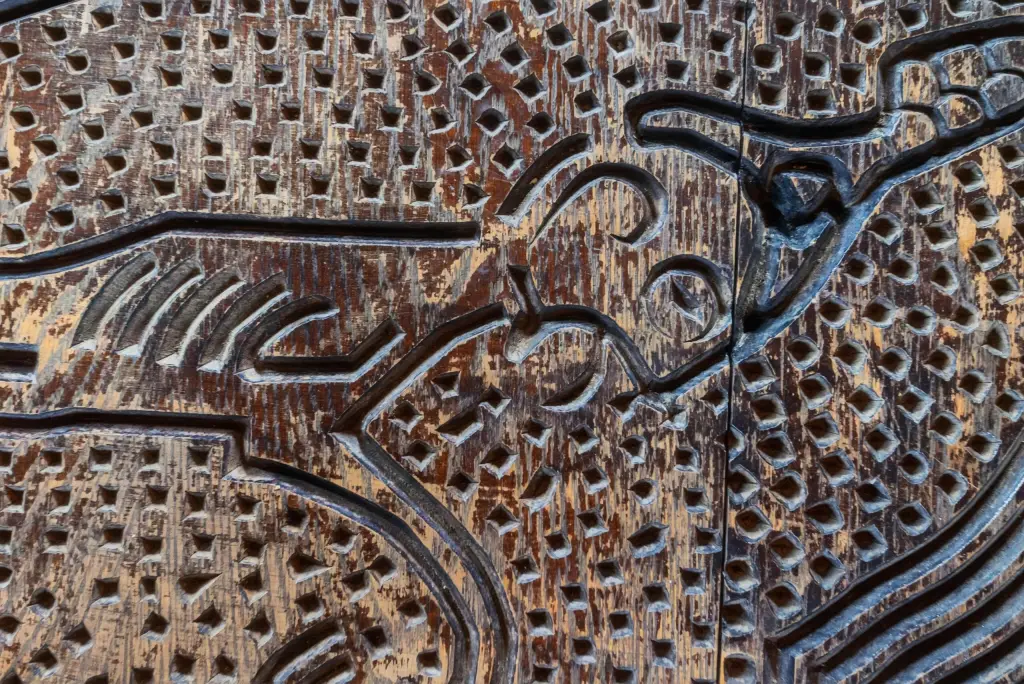
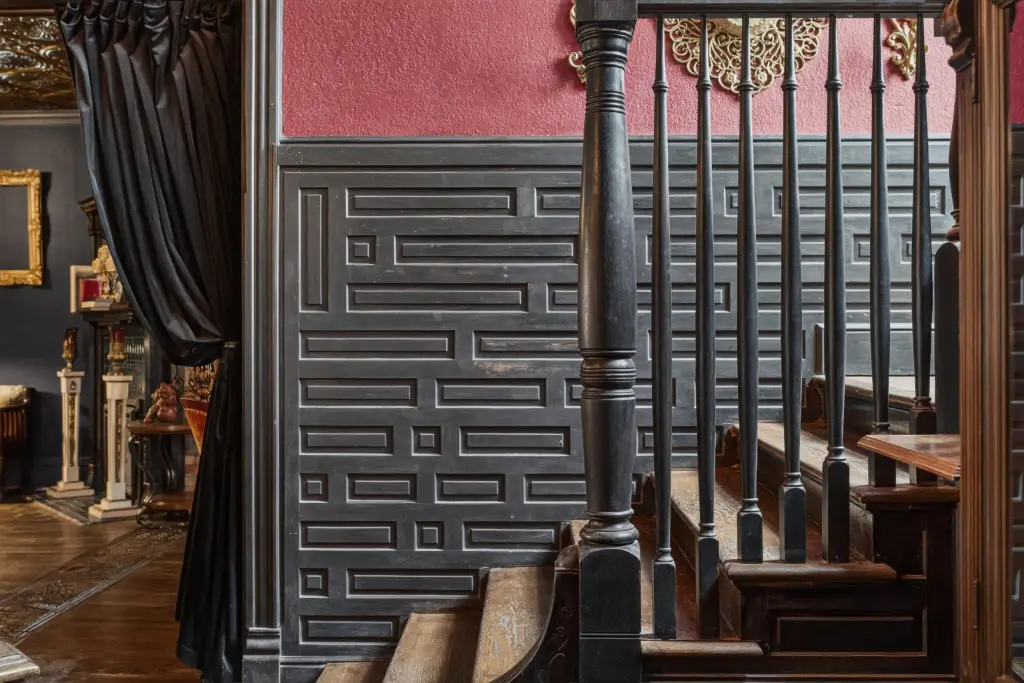
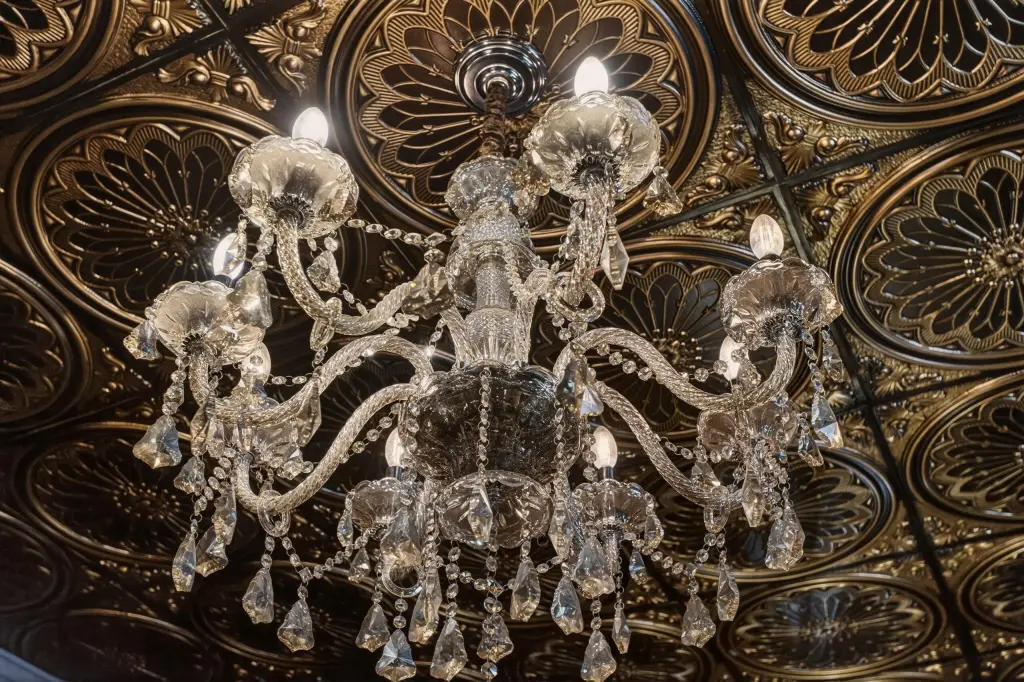
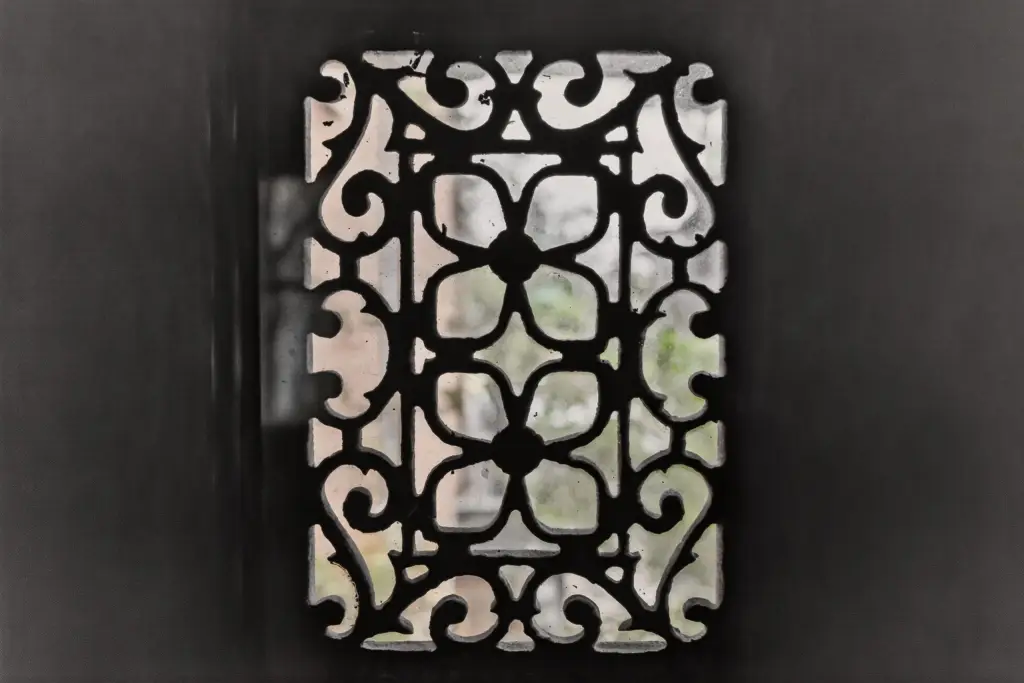
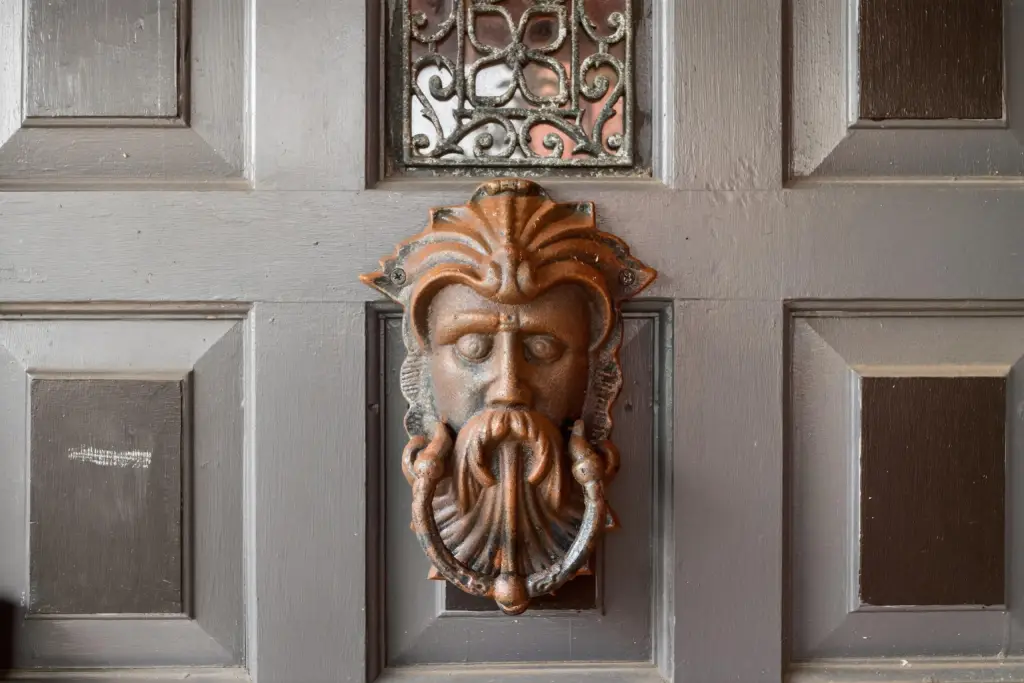
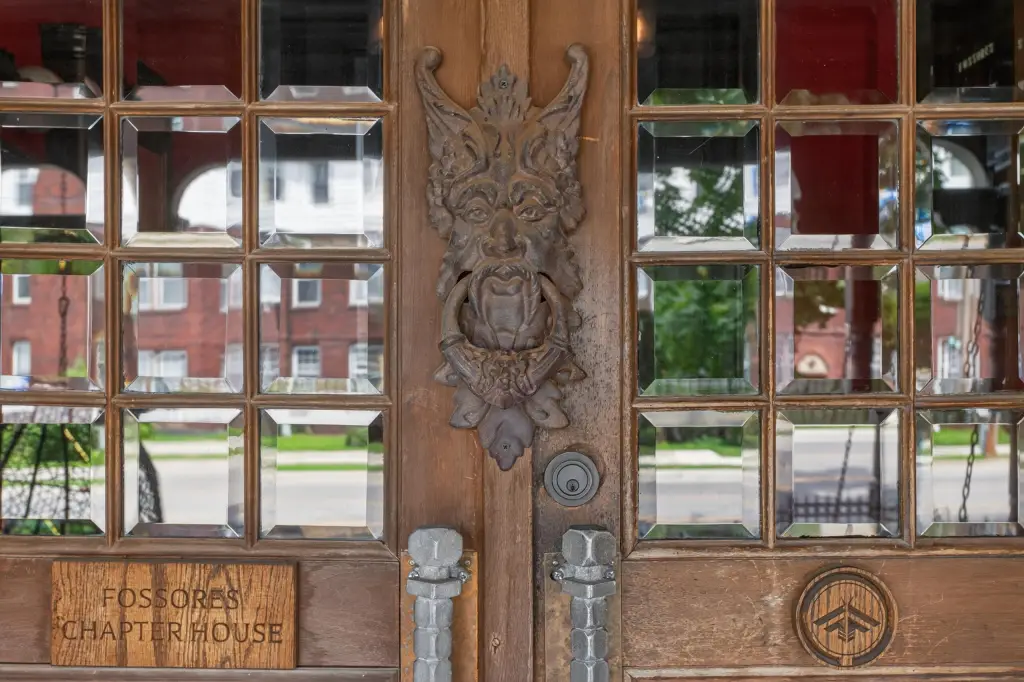
- Built in 1900 with original architectural details preserved
Property Analytics
Unlock full access to Insights
Subscribe to Realmo Intelligence
Open Analytics
Current Use
Location Intelligence
Trade Area within ½ mile
1,473
Businesses Nearby
Explore this area
Business Placement
Demographics for 49201, MI
47,747
Population
18,102
Households
2.6
Avg Household Size
41
Median Age
23%
College-Educated
92%
High-School Grad
155.0 sq mi
ZIP Area
308
Density / Sq Mi
$71,714
Median Household Income
$36,390
Median Earnings
$945
Median Rent
$202,900
Median Home Value
Check the figures for this property
Cap Rate, Value Estimation, Potential NOI and more
View Realmo Analytics
Market
Vacancy Rate% for Office in Midwest region

Questions? Ask Rey
Realmo’s AI knows this listing — price, zoning, demand, history. Ask anything.





Frequently Asked Questions
What type of property is this?
Mixed-use property - Brick downtown property with preserved historic character, flexible interior configuration, and substantial system and accessibility updates.
Where is this mixed-use property located?
The property is located at 505 Wildwood Avenue Jackson, MI.
What is the asking price?
The asking price for this property is $525,000.
What are key features of this property?
This property features: 6,357 square feet across four usable levels; 0.3‑acre parcel in Downtown Jackson’s Historic District; Built in 1900 with original architectural details preserved


