Brick Office Building with Subdividable
For Sale
$2,653,100
300-319 S Sharon Amity Rd, Charlotte, NC 28211
Brick office space built in 1985 with monument signage potential and a third floor that can be subdivided.
Property Size6,170 SF
Price / SF$430
Days on Market167
Property Features for 300-319 S Sharon Amity Rd
General Information
Standard status
Active
Size
6,170 SF
Additional Details
Office Units
2
Amenities
monument signage
abundant natural light
private lobby
conference rooms
break room
print room
large break area
Building Details
Year Built
1985
Construction
brick
Listing Agency:
Highland Realty & Development LTD
Listed By:
Lynette Glenn
(704) 877-5144
Source:
Exprealty
Added: May 9
Changed: Oct 13
Last Checked: Oct 20 at 9:29PM
Displayed information is deemed reliable but is not guaranteed and should be independently verified. All listing content including descriptions, pricing, images are the copyrighted material of Highland Realty & Development LTD

Ask AI about this property
Review the available facts, identify missing information and prepare questions for the agent.
Investment Insights
Based on property information with market context.
This brick office building was constructed in 1985 and offers efficient layouts with abundant natural light. The available third floor can be subdivided into two office condos. Condo A is a 2,744 SF unit featuring 6 offices, 3 conference rooms, a break room, and a private lobby. Condo B is a 3,426 SF unit with 8 offices, a reception area, a print room, and a large break area. Monument signage is available, and ample parking is supported by a 5/1000 parking ratio.
The property is located directly across from Cotswold Village Shops, providing an established retail presence immediately adjacent to the building.
The seller prefers to sell the third floor together, which may appeal to an owner-user looking for flexible interior configuration within a single acquisition.
The property is located directly across from Cotswold Village Shops, providing an established retail presence immediately adjacent to the building.
The seller prefers to sell the third floor together, which may appeal to an owner-user looking for flexible interior configuration within a single acquisition.
Key Highlights
- Brick office building built in 1985, located directly across from Cotswold Village Shops
- Third‑floor space can be subdivided into two condo offices: 2,744 SF and 3,426 SF
- Condo A includes 6 offices, 3 conference rooms, break room, and private lobby (listed price $1,234,400)
Financial Insights
Estimated NOI and Cap Rate
NOI / Yr
$95,289
Cap Rate
3.59%
Suggested Prices Based on Cap Rates
Cap Rate 5%
$1,905,780
$1.9M
Cap Rate 7%
$1,361,271
$1.4M
Cap Rate 9%
$1,058,767
$1.1M
Market Conditions
NOI Build-Up for 6,170 SF
Gross rent
$154.0K $24.96/SF
− Vacancy
−$27.0K −$4.37/SF
EGI
$127.1K $20.59/SF
− OpEx
−$31.8K −$5.15/SF
NOI
$95.3K $15.44/SF
Area
Charlotte, NC
Vacancy
17.50%
Lease Rate
$24.96 /SF/Yr
Expense Ratio
25.00%
Simulate Cap Rate and NOI
Suggested Prices Based on Cap Rates
Cap Rate 5%
$1,905,780
Cap Rate 7%
$1,361,271
Cap Rate 9%
$1,058,767
Alternative Uses
Best Use
Office B
$1.36M
$1.19M – $1.59M
NOI $95,289 @ 7.0% cap · market cap 3.59%
Second Best
—
—
no second resolved use
Theoretical Best
Office A
$2.05M
$1.80M – $2.40M
NOI $143,824 @ 7.0% cap · market cap 5.42%
Zoning and permitted uses should be independently verified with authorities.
How Realmo checks its estimates
Property Analytics
Current Use
Lease Details
2
Office units
Location Intelligence
Trade Area within ½ mile
1,041
Businesses Nearby
Explore this area
Business Placement
Demographics for 28211, NC
31,917
Population
15,061
Households
2.1
Avg Household Size
39
Median Age
69%
College-Educated
96%
High-School Grad
11.0 sq mi
ZIP Area
2,902
Density / Sq Mi
$130,221
Median Household Income
$66,412
Median Earnings
$1,660
Median Rent
$701,900
Median Home Value
Market
Vacancy Rate% for Office in Charlotte, NC




Frequently Asked Questions
What type of property is this?
Office unit - Brick office space built in 1985 with monument signage potential and a third floor that can be subdivided.
Where is this office unit located?
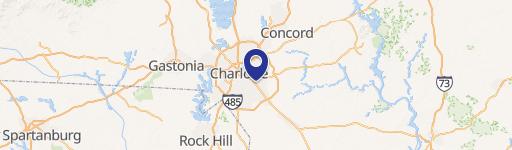
The property is located at 300-319 S Sharon Amity Rd Charlotte, NC.
What is the asking price?
The asking price for this property is $2,653,100.
What are key features of this property?
This property features: Brick office building built in 1985, located directly across from Cotswold Village Shops; Third‑floor space can be subdivided into two condo offices: 2,744 SF and 3,426 SF; Condo A includes 6 offices, 3 conference rooms, break room, and private lobby (listed price $1,234,400)