Renovated Six-Unit Apartment
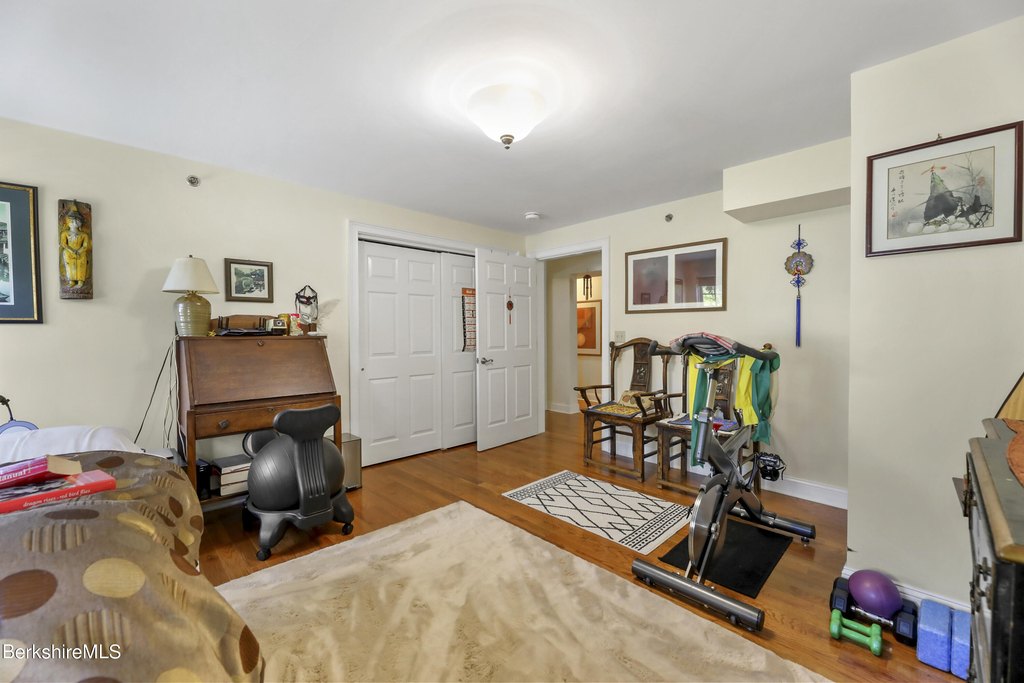
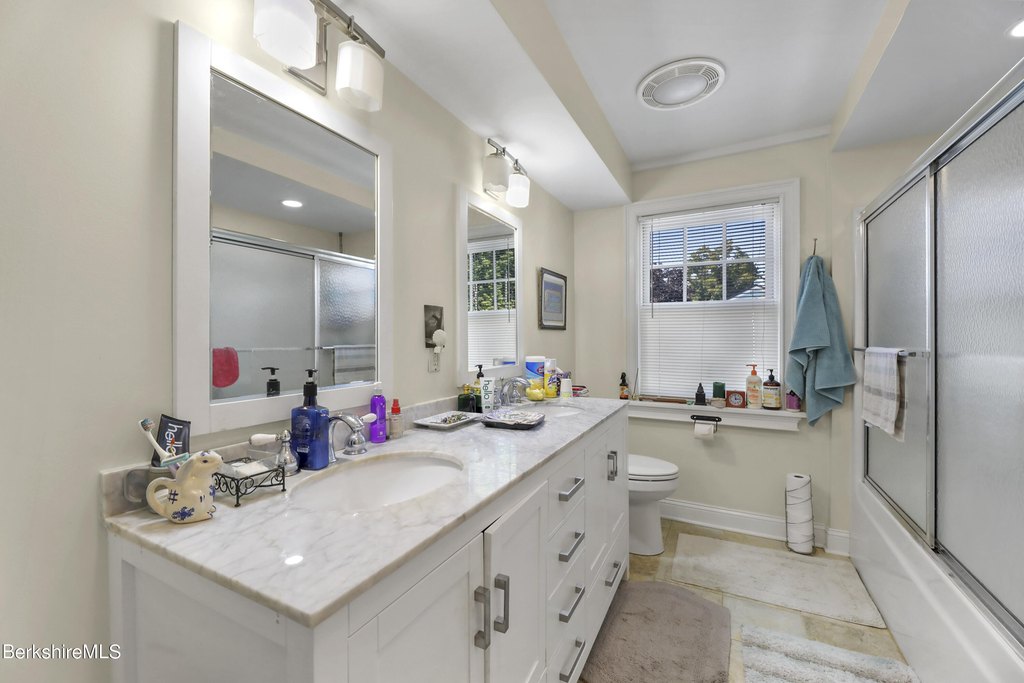
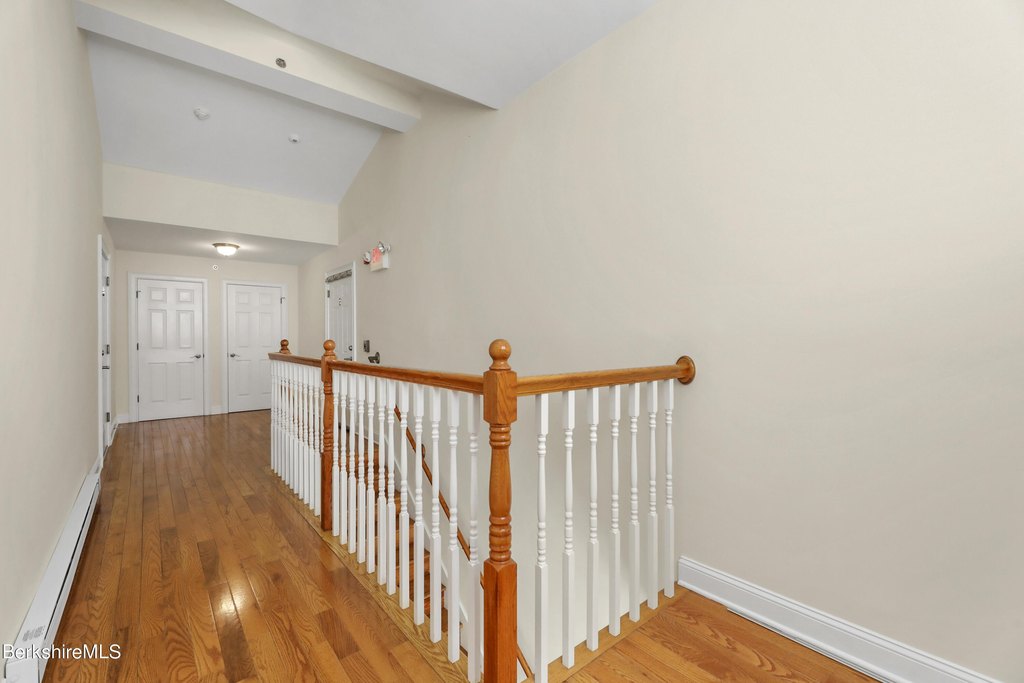
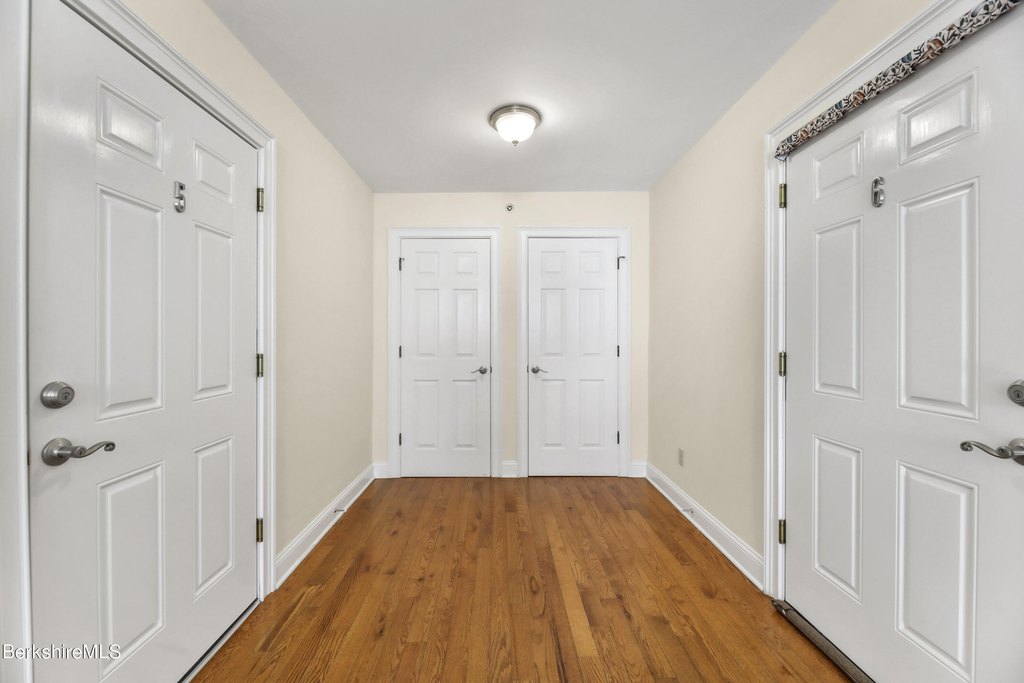
For Sale
$1,579,000
29 Main St, West Stockbridge, MA 01266
MultiFamily, West Stockbridge, MA
Property Size8,881 SF
Lot Size0.30 Acres
Price / SF$177.80
Days on Market754
Property Features for 29 Main St
General Information
Property type
Residential Multi Family
Property subtype
Other
Zoning description
Multi
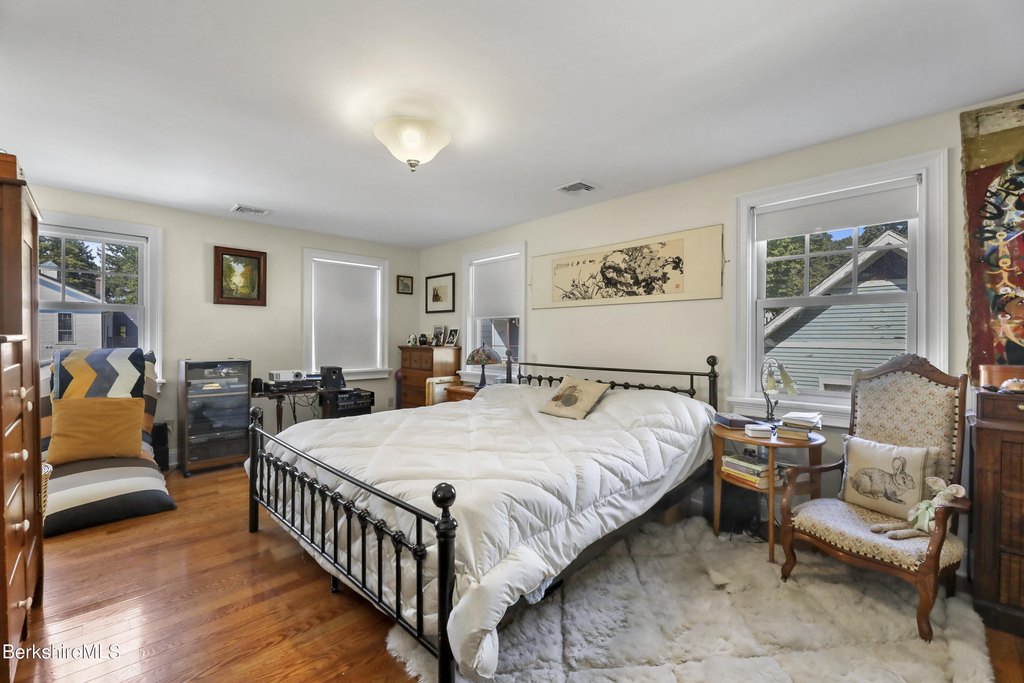
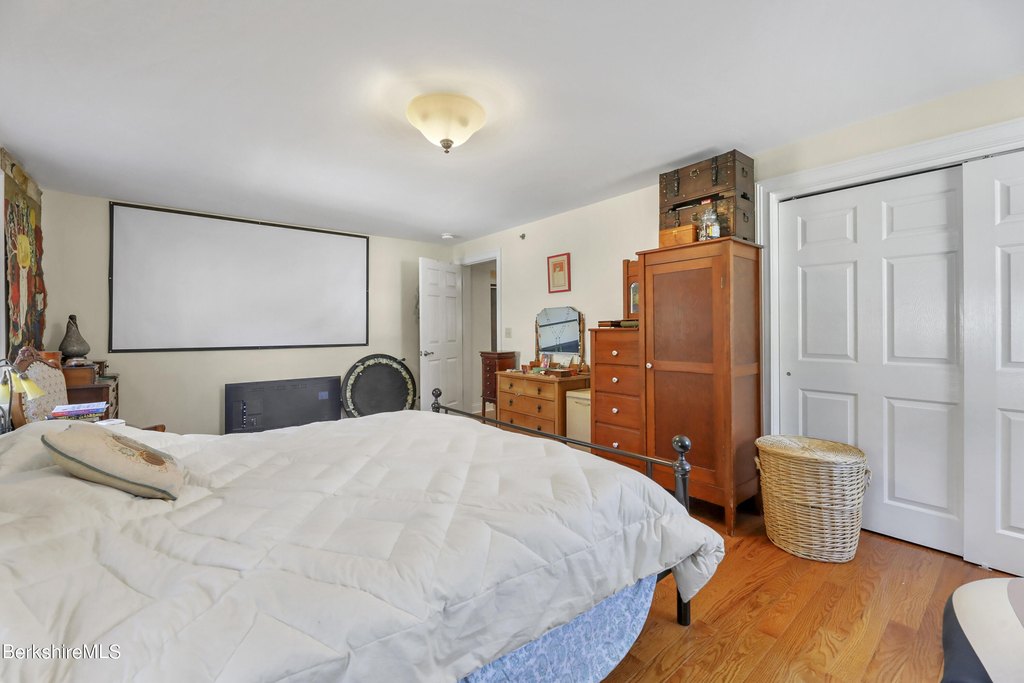
Bedrooms
12
Bathrooms
7
Full bathrooms
7
Rooms
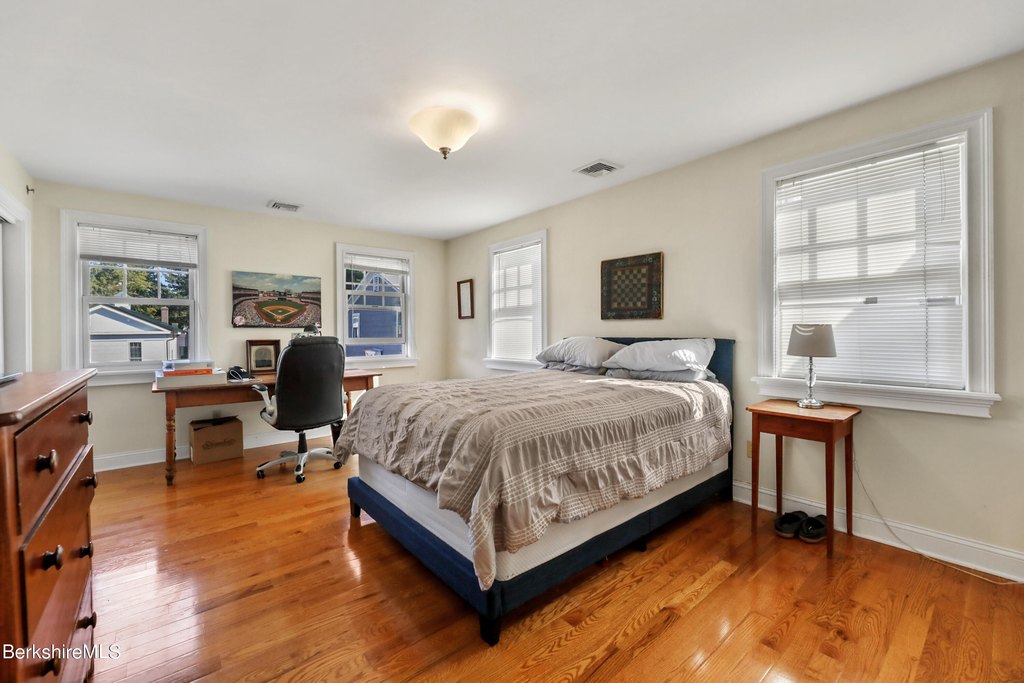
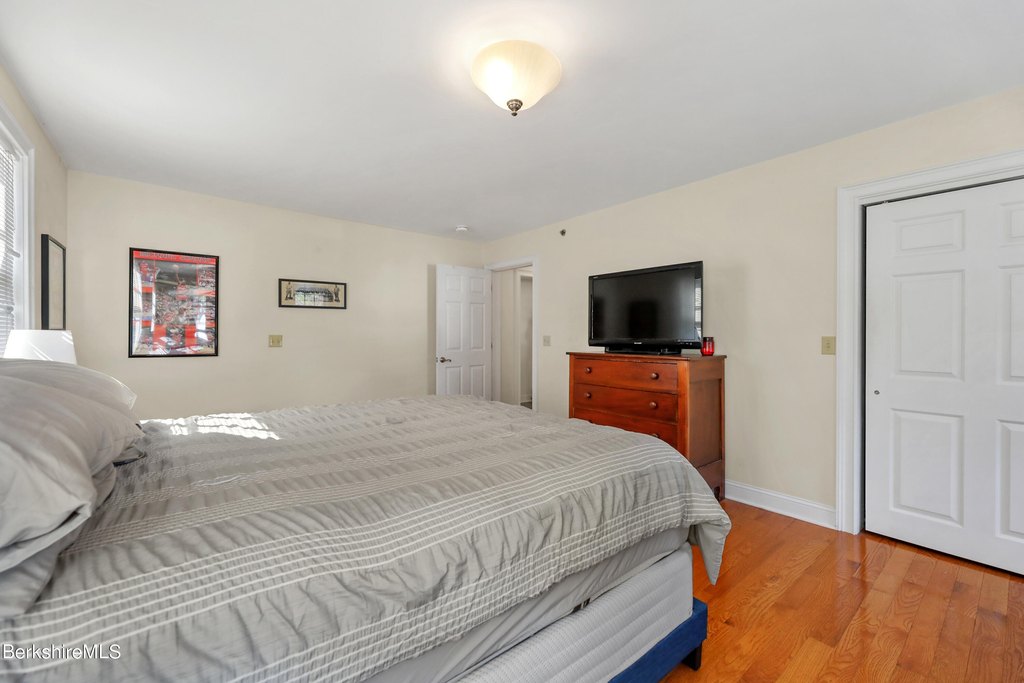
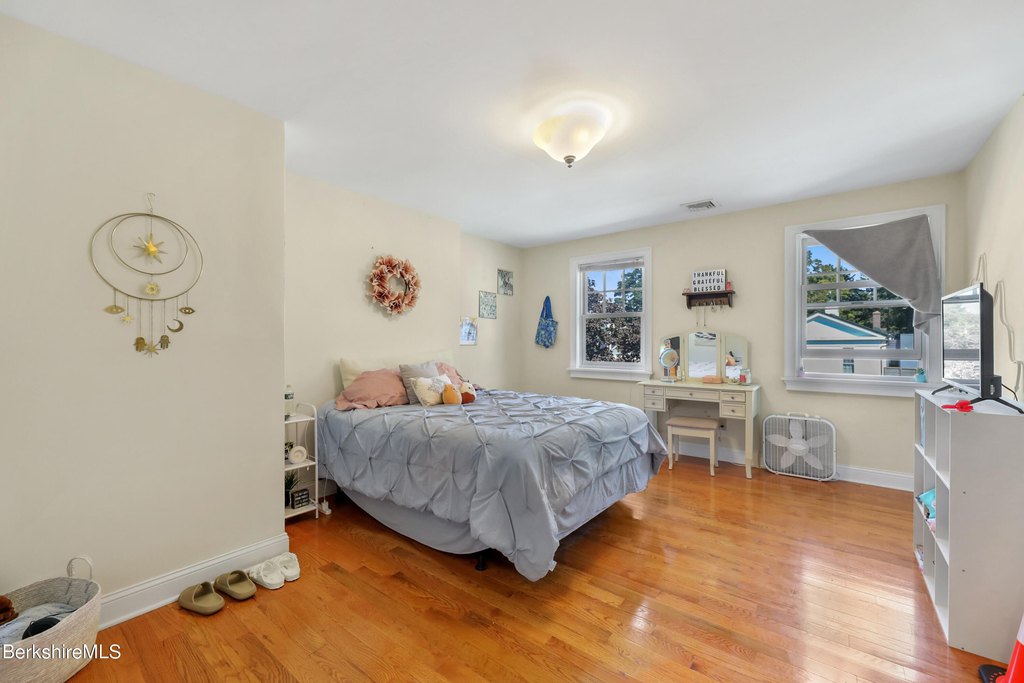
Bedroom 12, Bedroom 11, Bedroom 5, Bedroom 3, Bedroom 10, Bedroom 1, Bedroom 6, Bedroom 2, Bathroom 7, Bathroom 5, Bedroom 7, Bedroom 8, Bedroom 4, Bedroom 9, Bathroom 2, Bathroom 4, Bathroom 6, Bathroom 3, Bathroom 1, Basement
Parking
12
Parking features
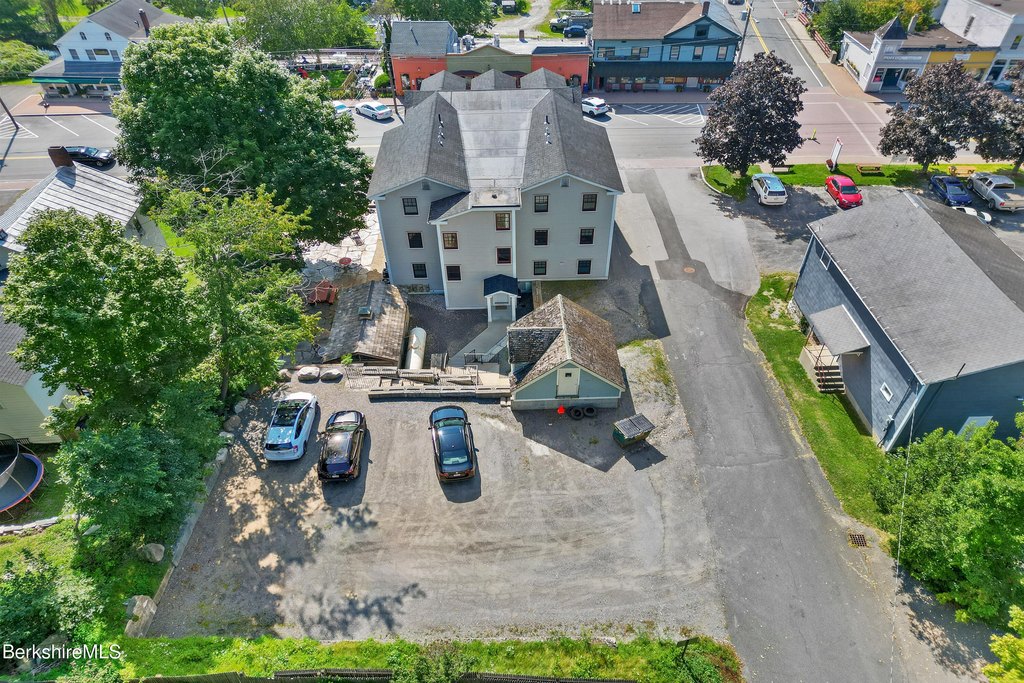
Off Street
Interior features
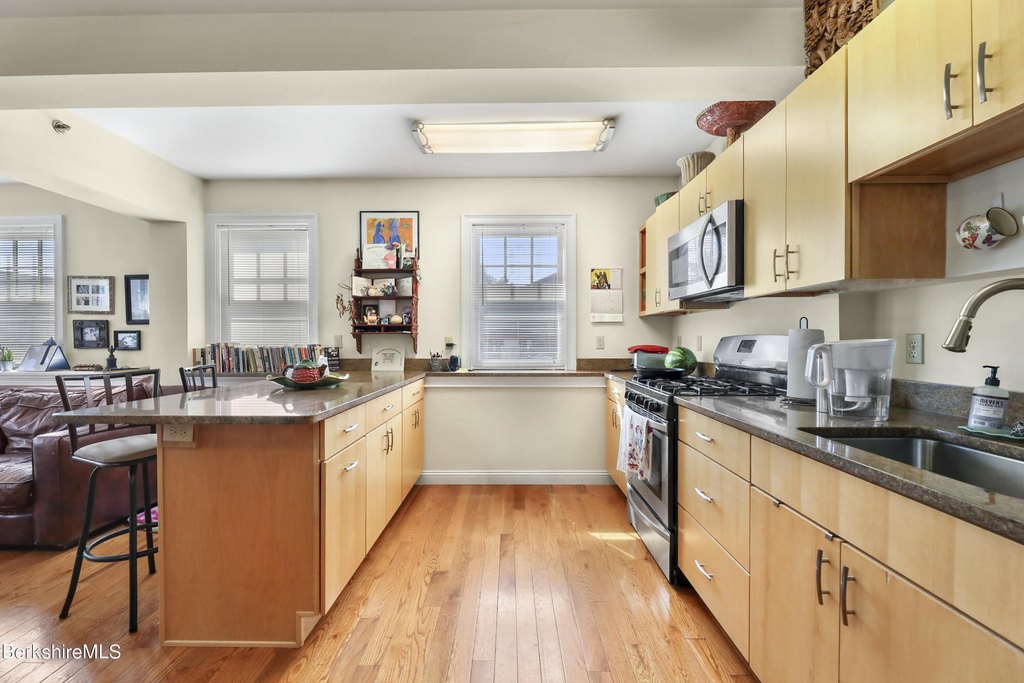
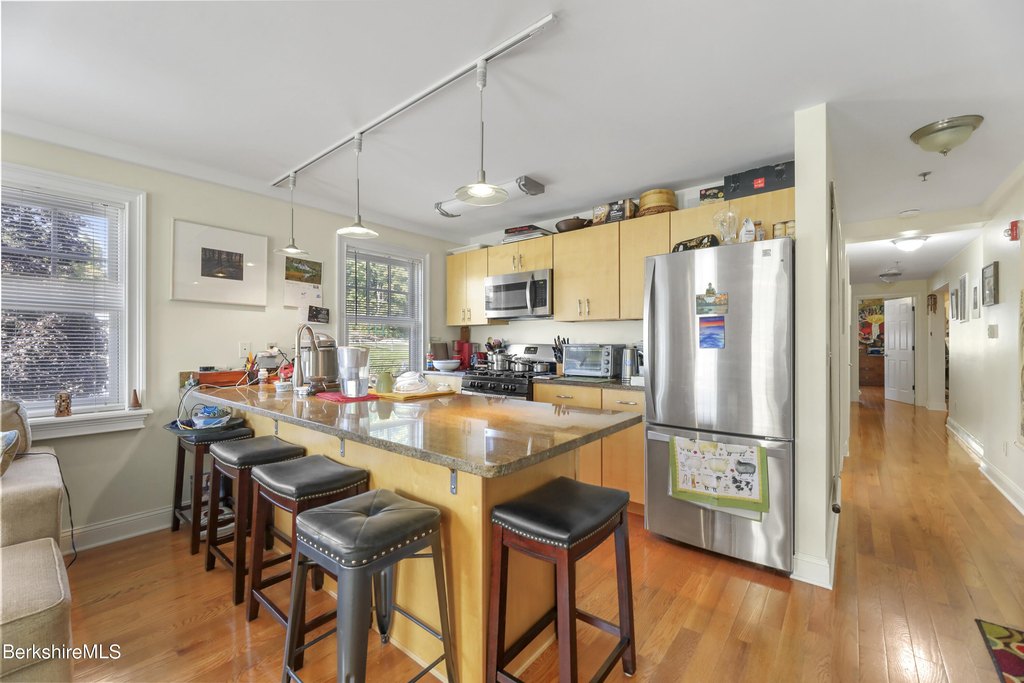
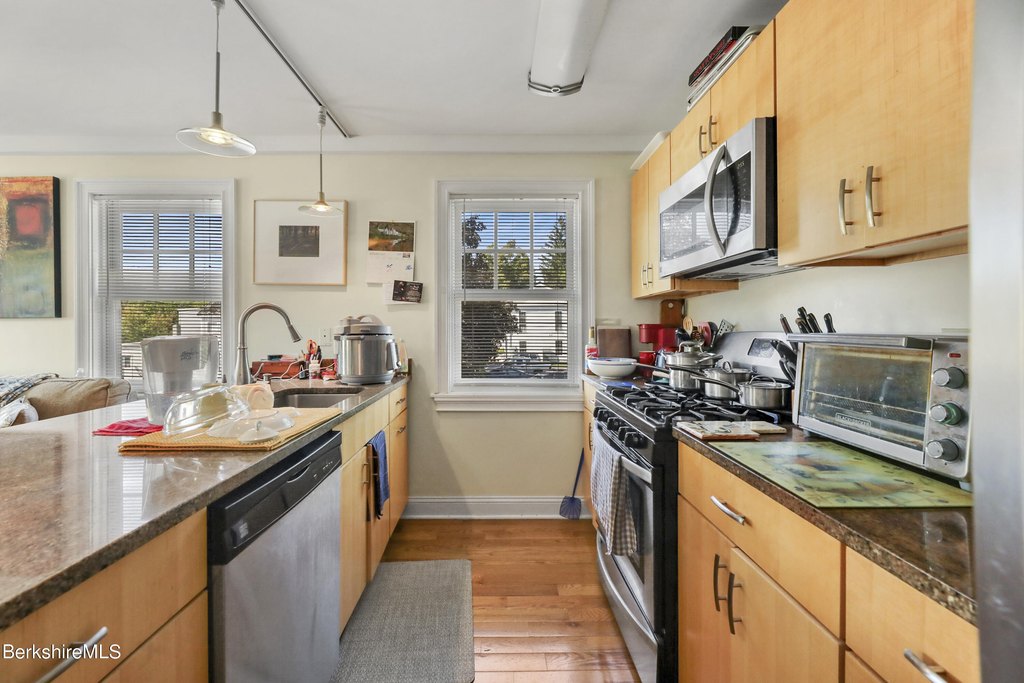
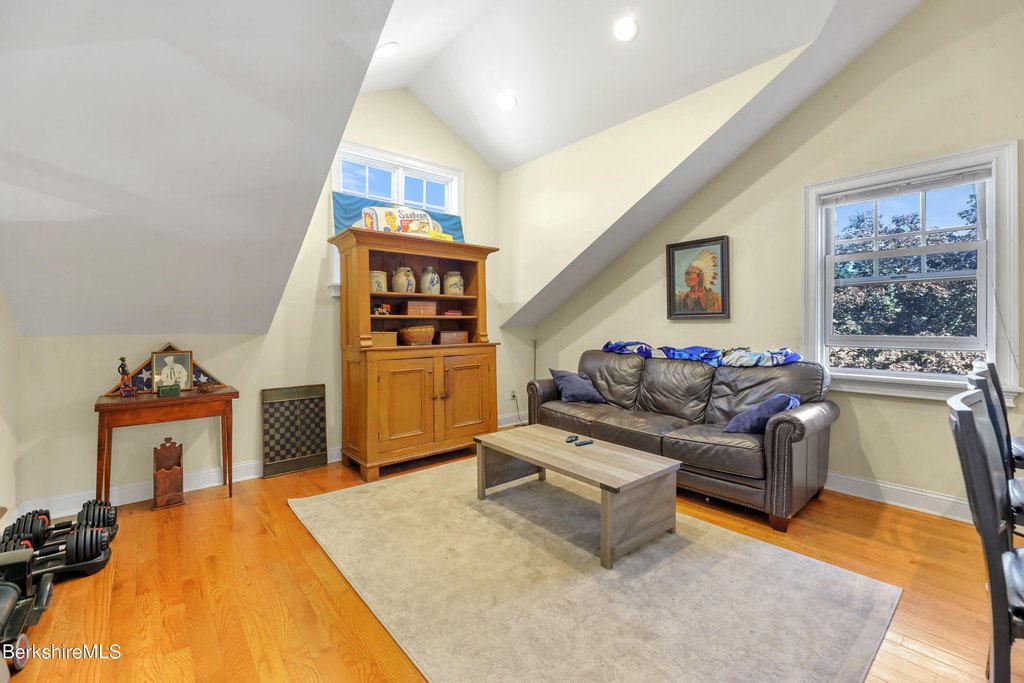
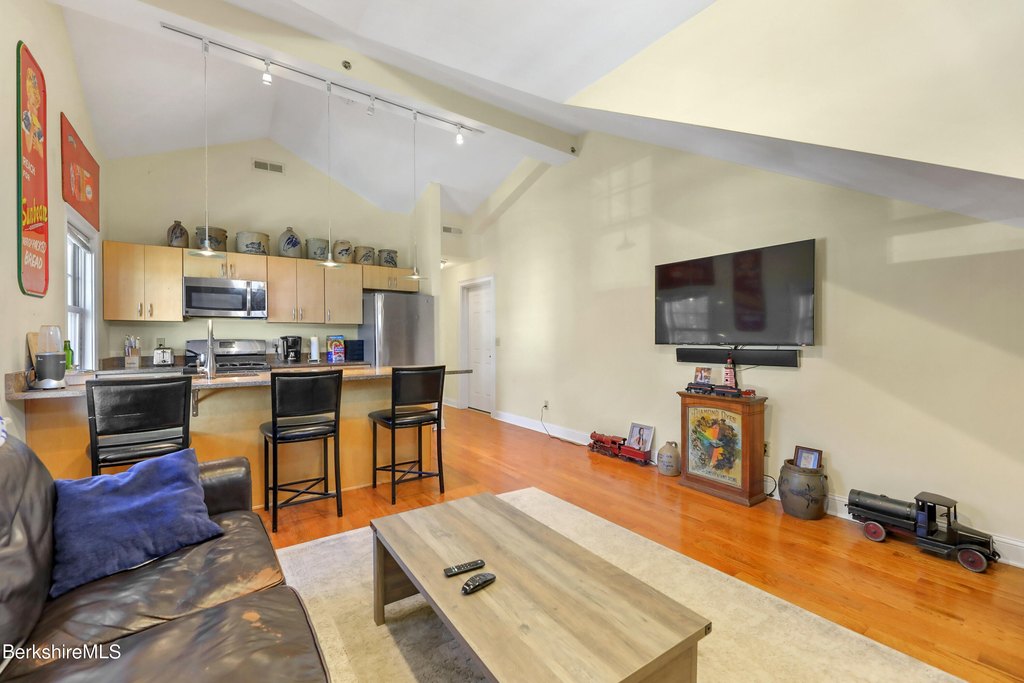
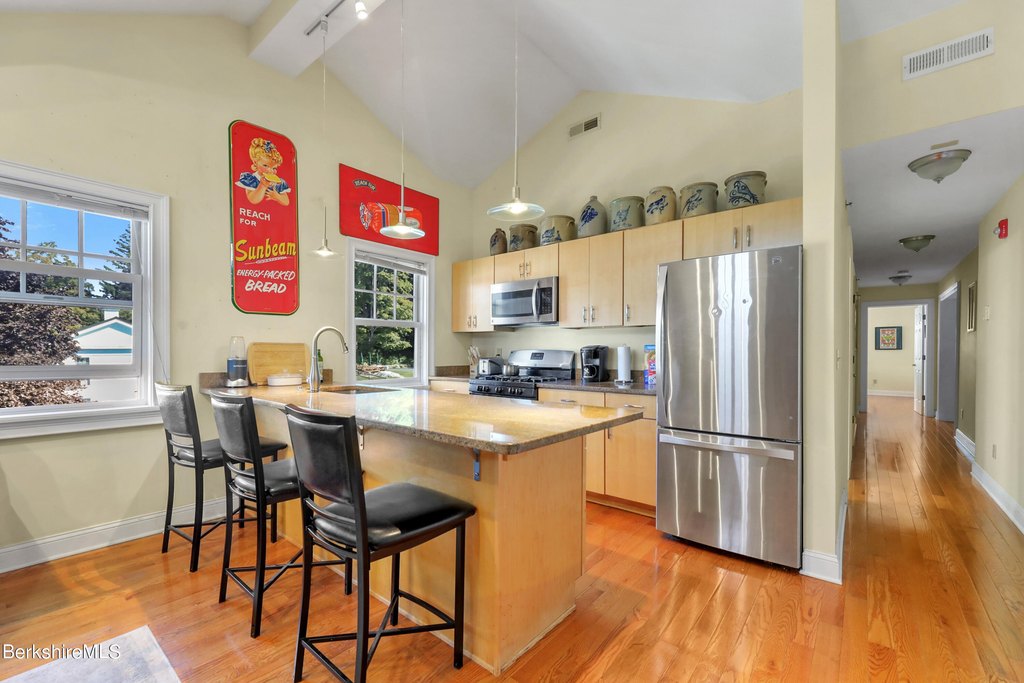
Alarm System, Elevator, High Speed Wiring, Pets Allowed, Granite Counter, Vaulted Ceilings, Cathedral Ceilings, Soapstone Counter
Exterior features
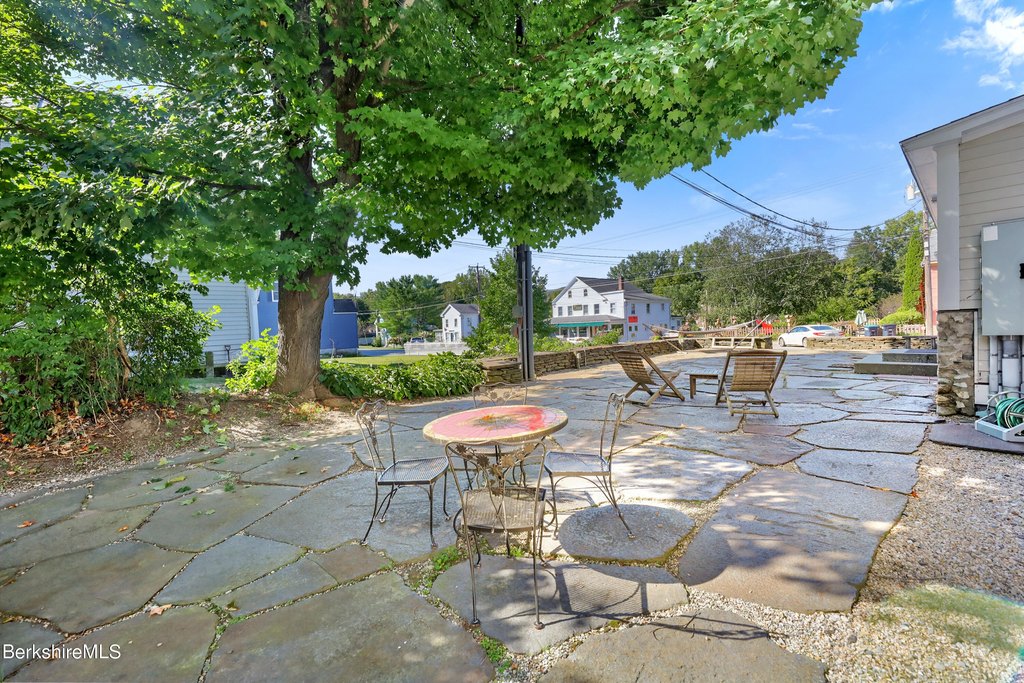
Outbuilding
Basement
Concrete
Accessibility
Accessible Elevator Installed
Appliances
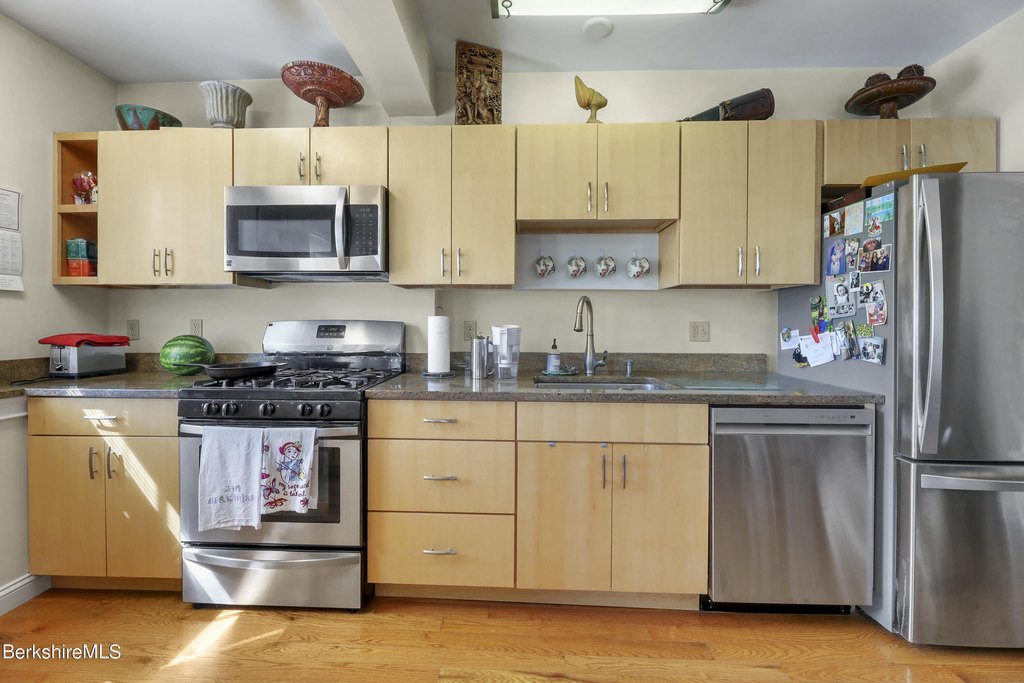
Washer, Refrigerator, Range Hood, Dryer, Dishwasher
Elementary school
Muddy Brook Reg.
Middle school
W.E.B. Du Bois Reg.
High school
Monument Mountain
Directions
From Rt 102 to 29 Main Street West Stockbridge
Subdivision
South Registry
Standard status
Active
Size
8,881 SF
Lot size
0.30 Acres
Taxes and HOA fees
Tax Year
2024
Tax Annual Amount
9416
Utilities
Sewer type
Public Sewer
Heating system
Forced Air, Central
Water source
Public
Water front
1
Amenities
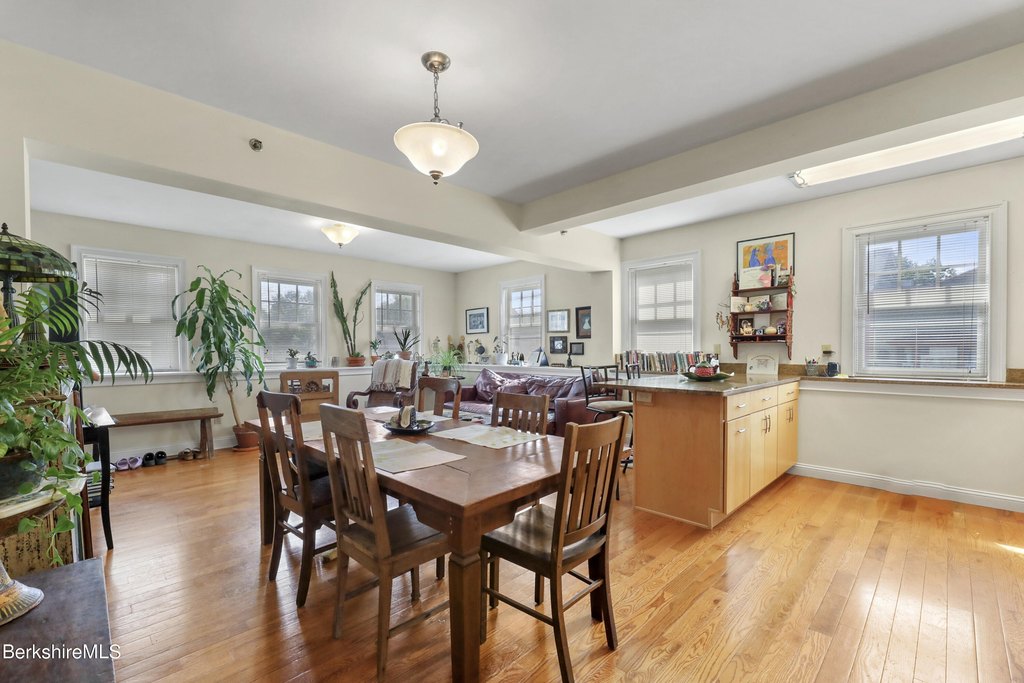
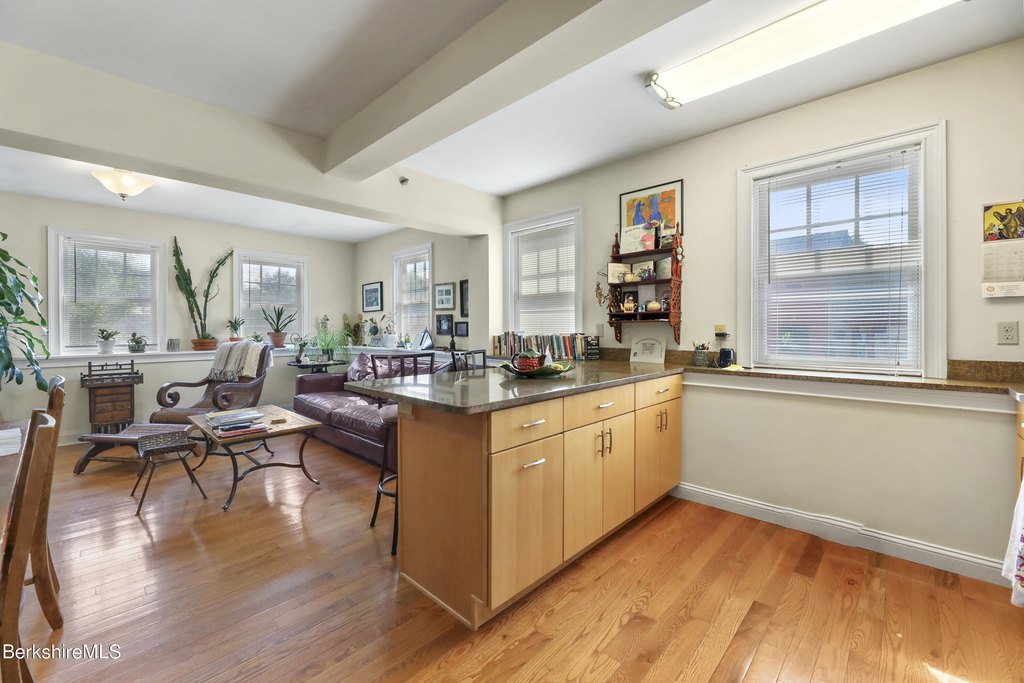
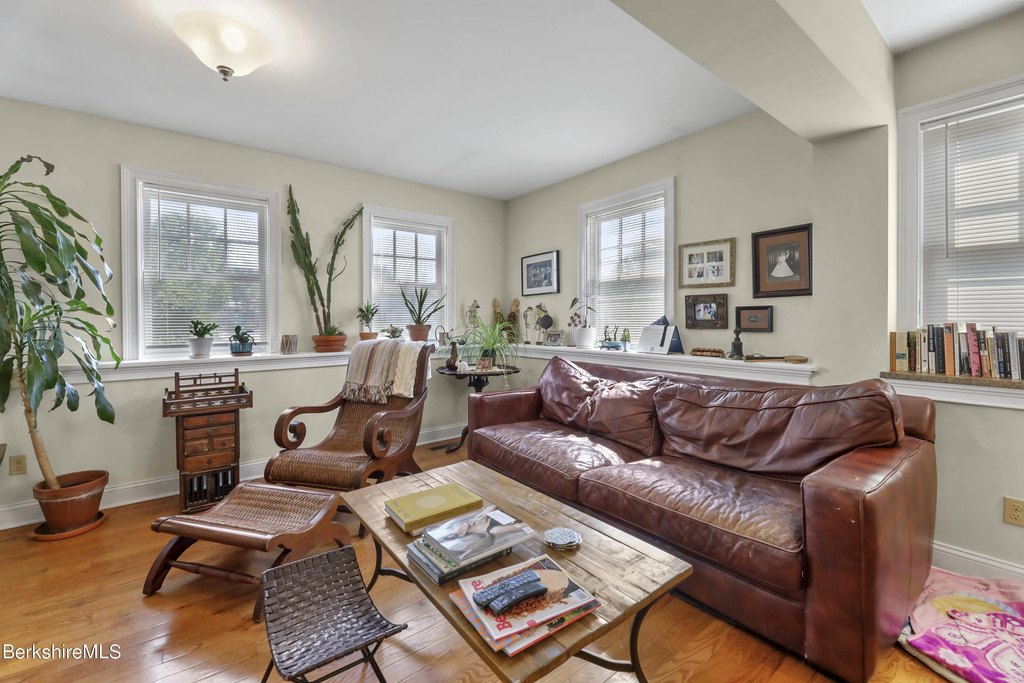
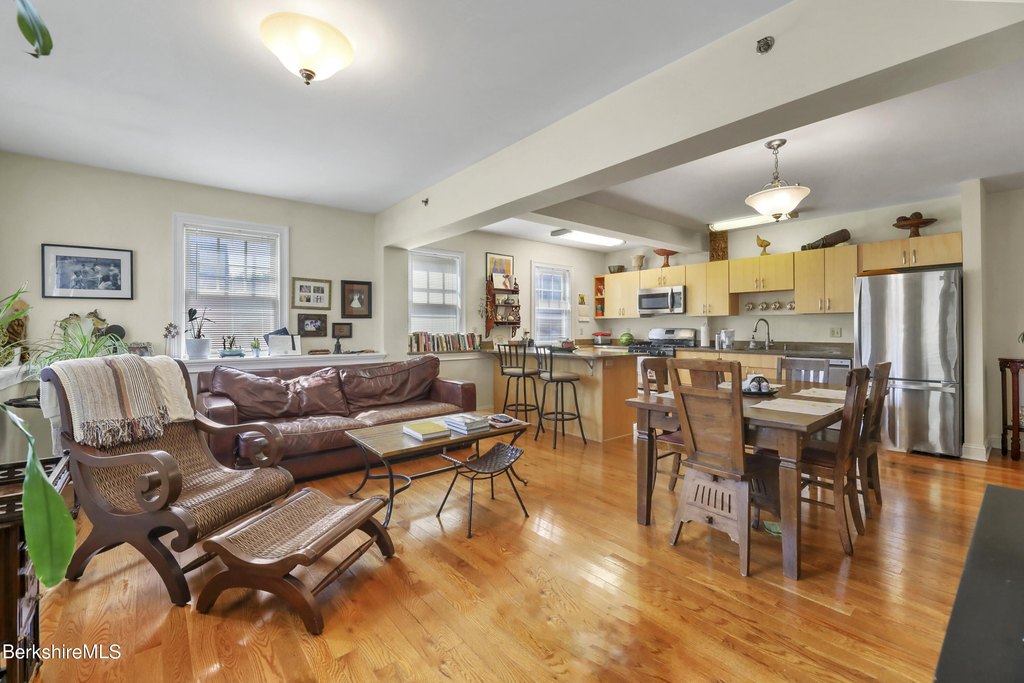
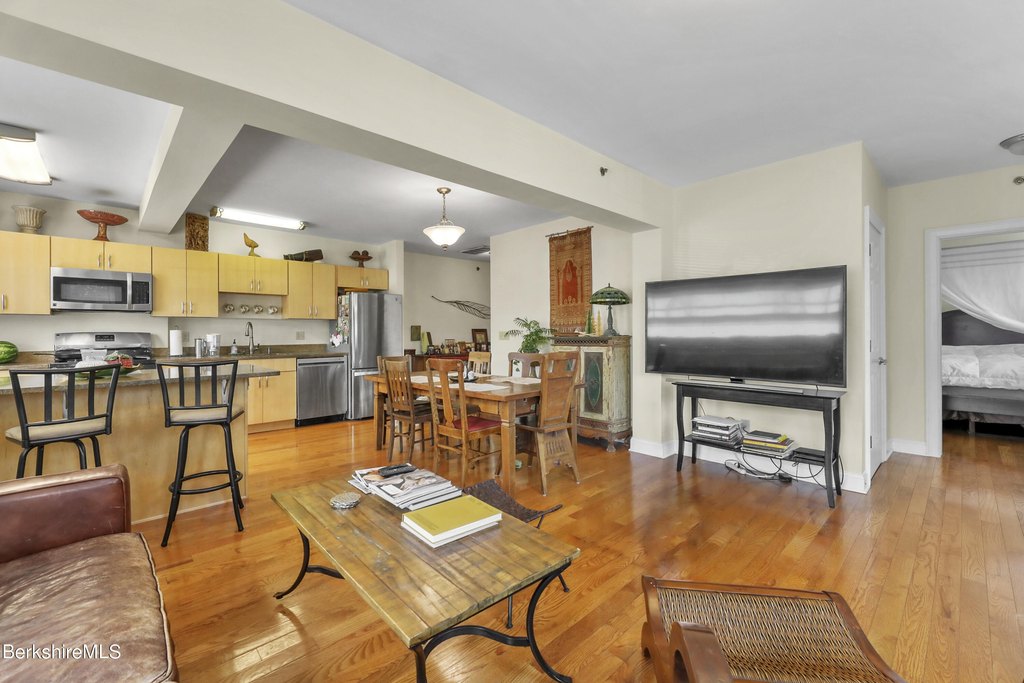
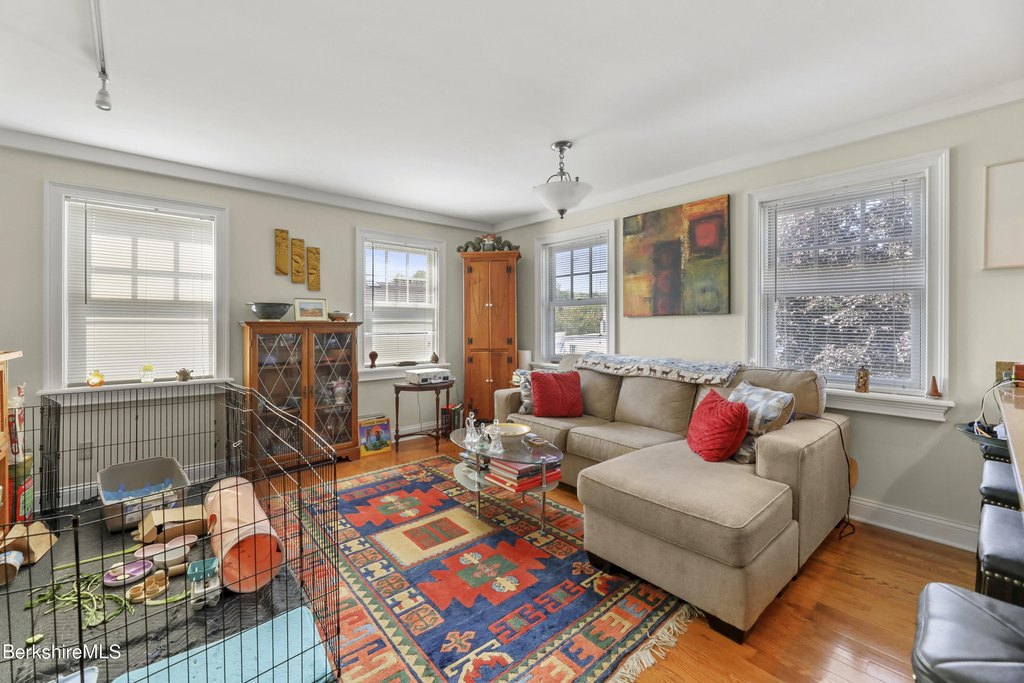
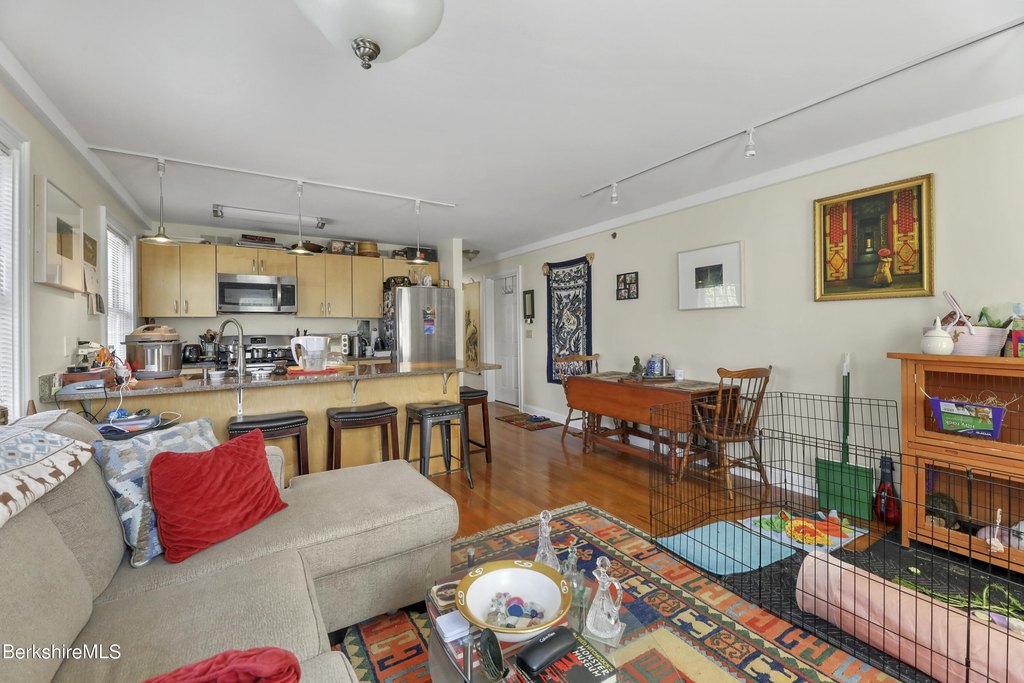
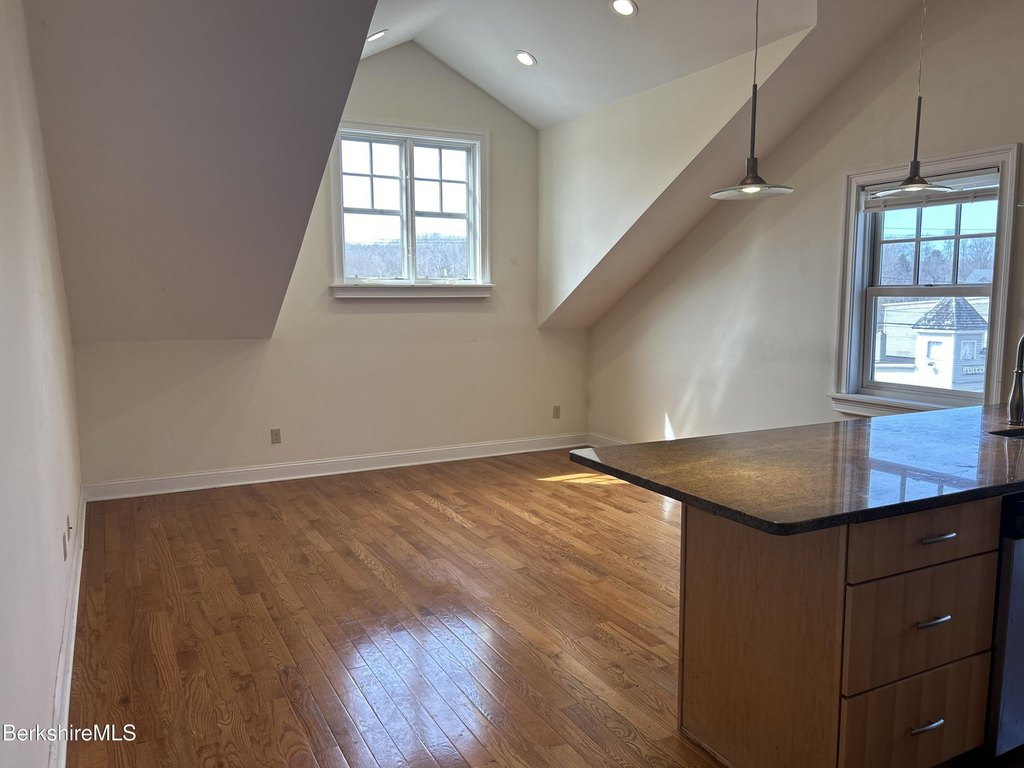
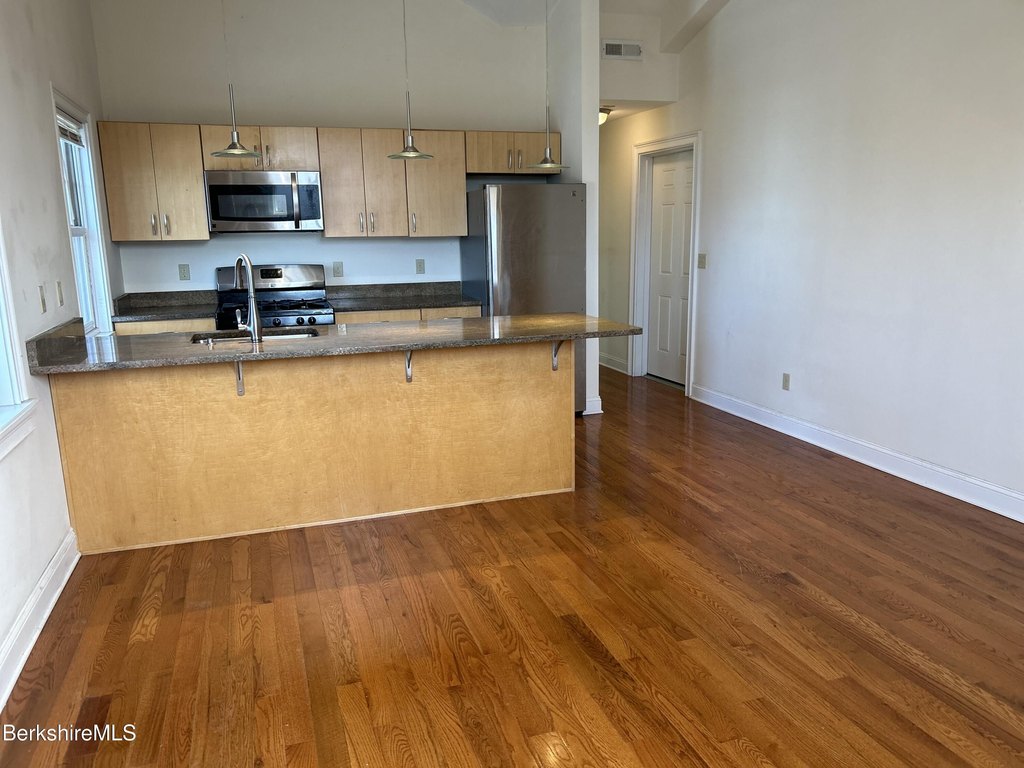
wood floors
appliances
dishwashers
in-unit laundry
central air conditioning
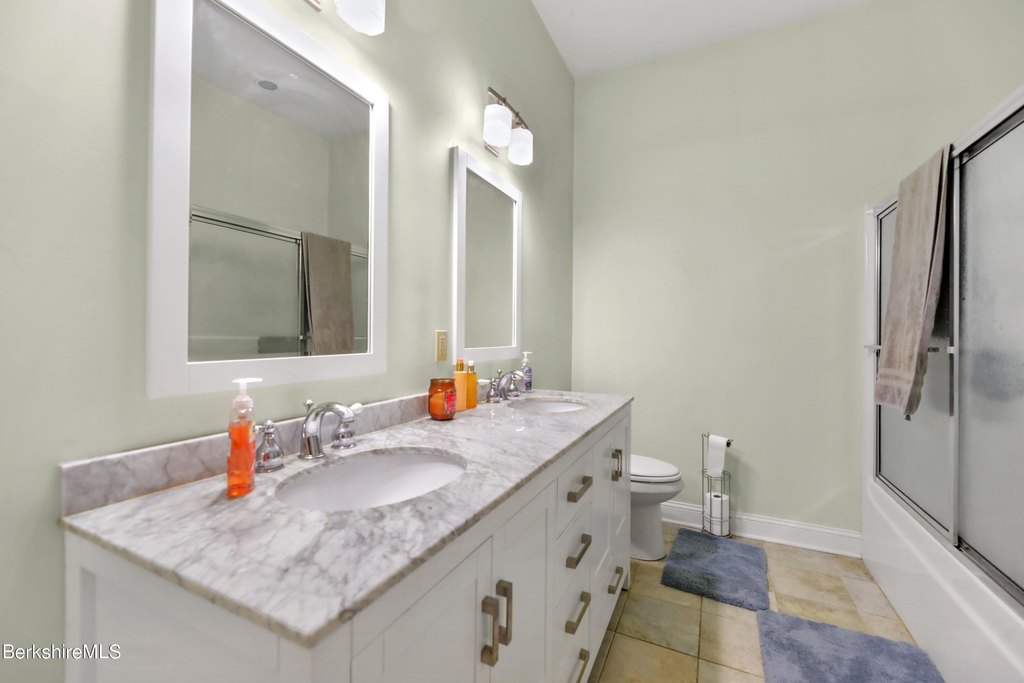
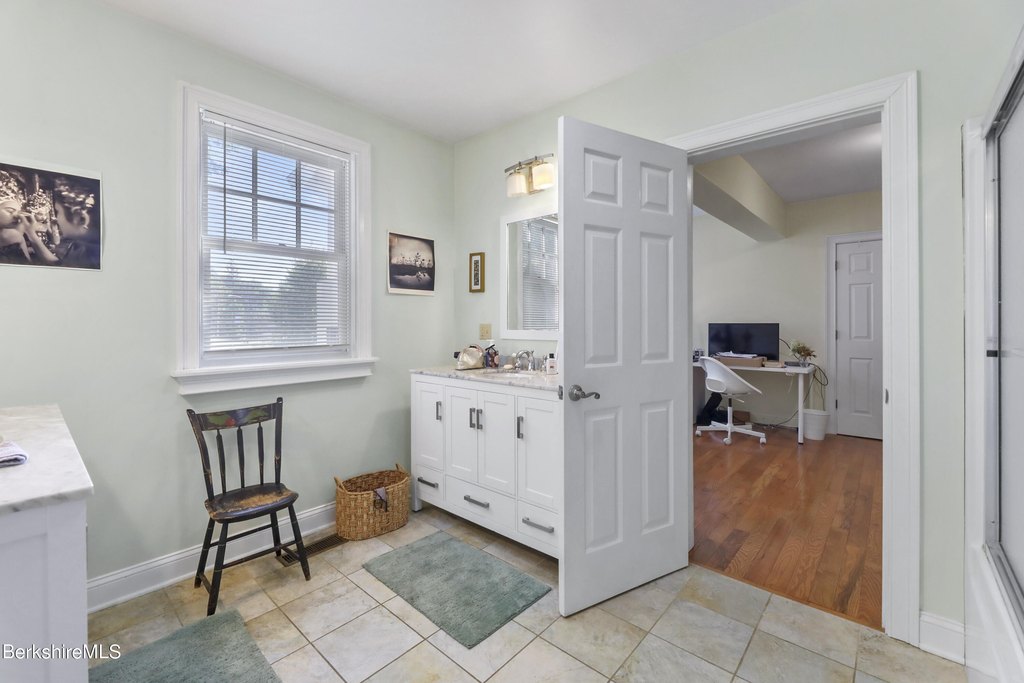
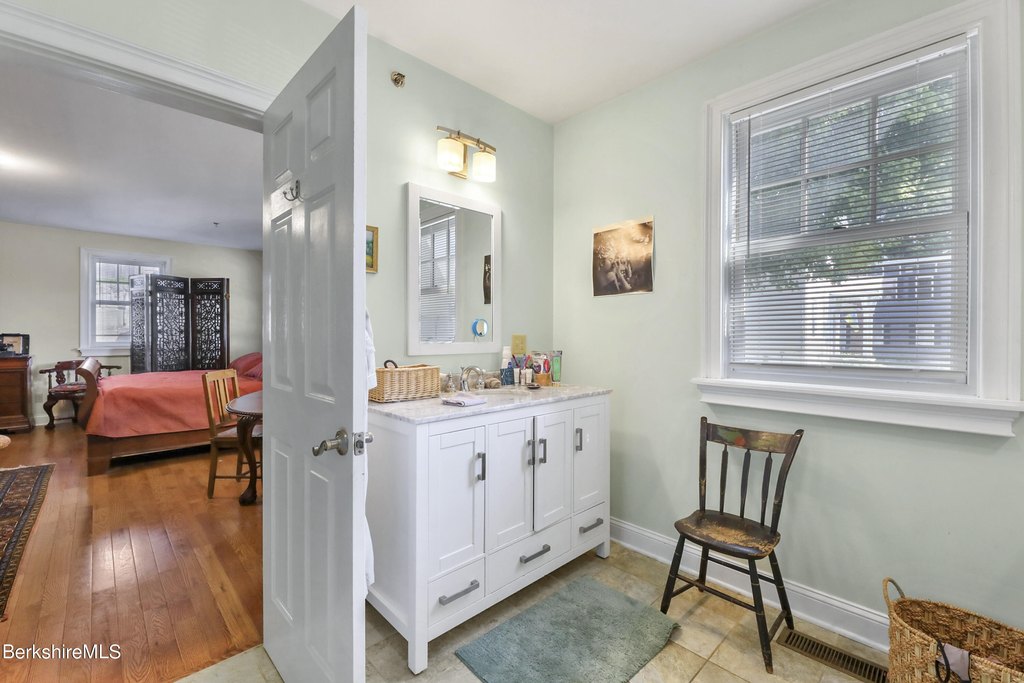
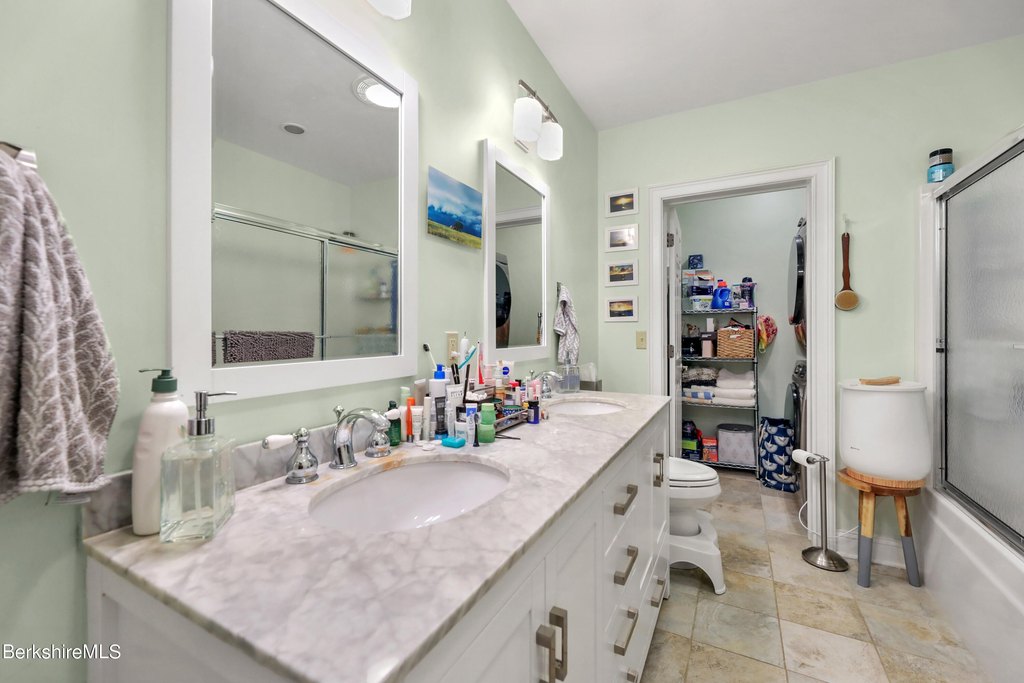
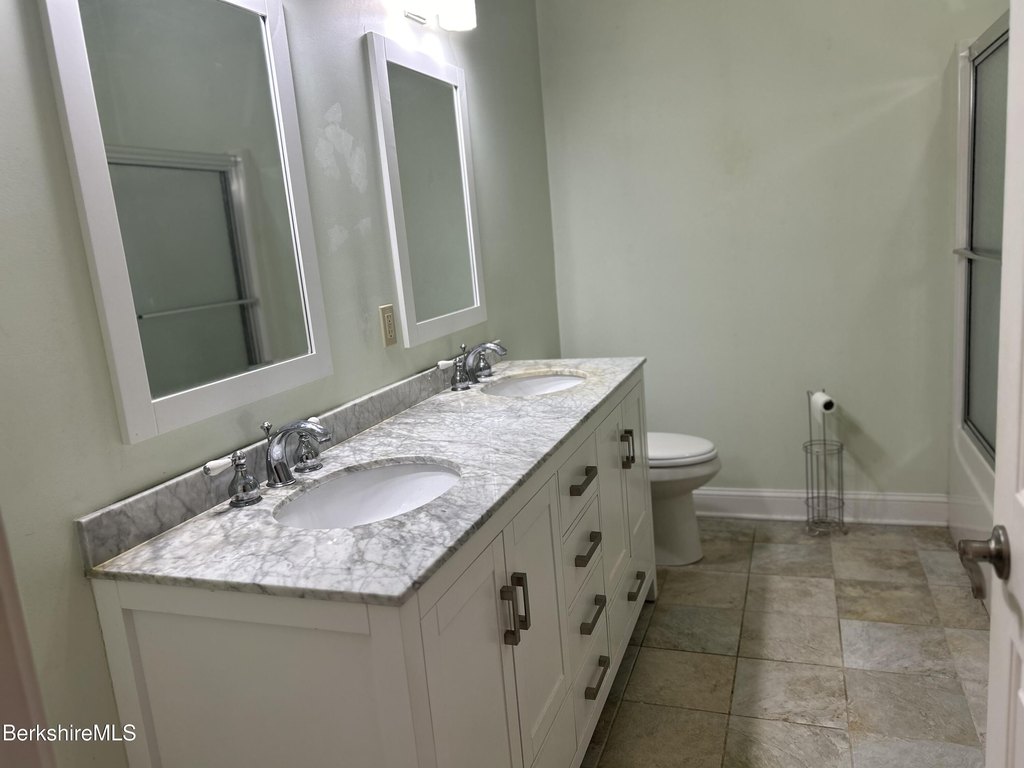
tiled double-sink bathrooms
ample storage
Building Details
Year built
1900
Number of units
6
Flooring type
Wood, Tile - Ceramic
Building materials
Wood Frame
Roof type
Asphalt
Architectural style
Colonial
Additional Structures
Outbuilding
Listing Agency:
HOUSATONIC REAL ESTATE
(413) 274-5065
Listed By:
Suzann Laverack Ward · License #9588333
(413) 329-3031
Added: Sep 13, 2024
Changed: Oct 1
Last Checked: Oct 6 at 10:06PM
MLS# 245690
Copyright © 2026 Berkshire County Board of Realtors. All rights reserved. All information provided by the listing agent/broker is deemed reliable but is not guaranteed and should be independently verified.
Investment Insights
Based on property information with market context.
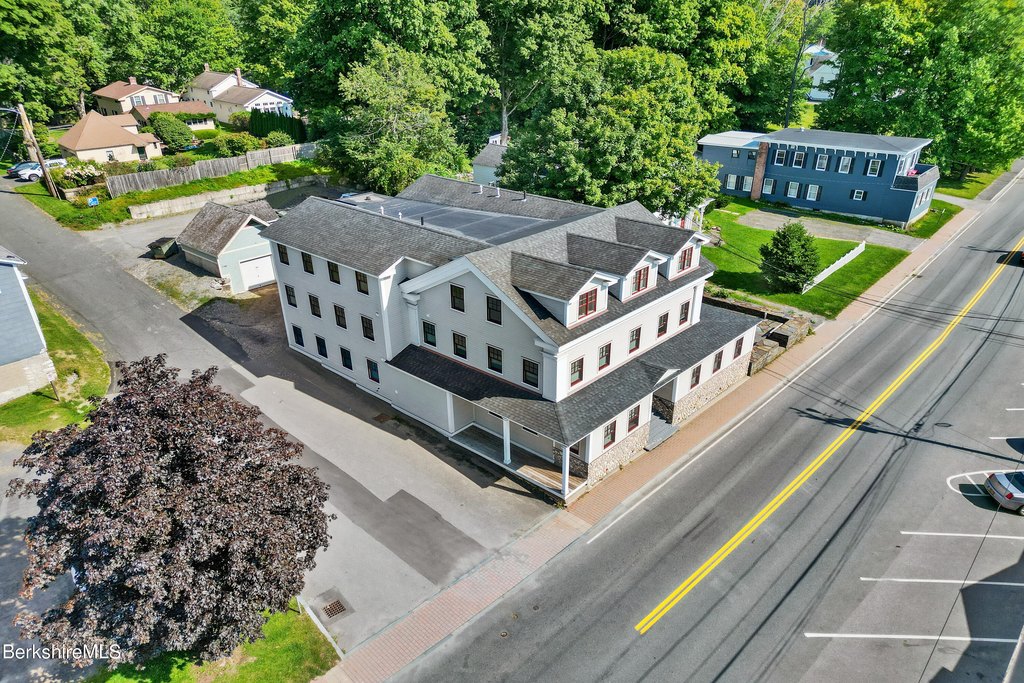
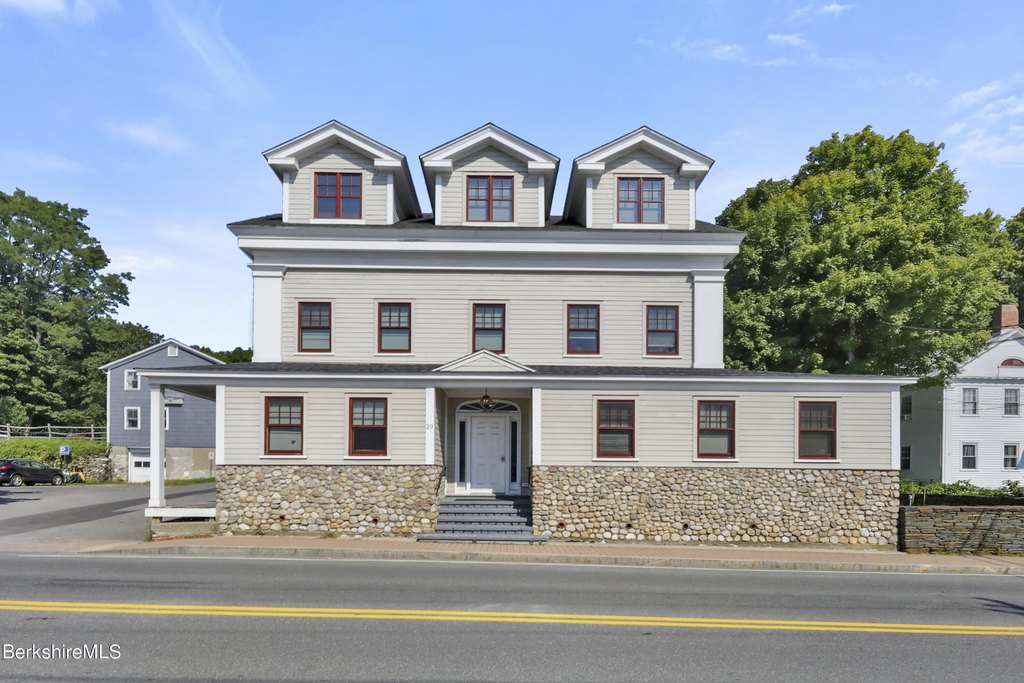
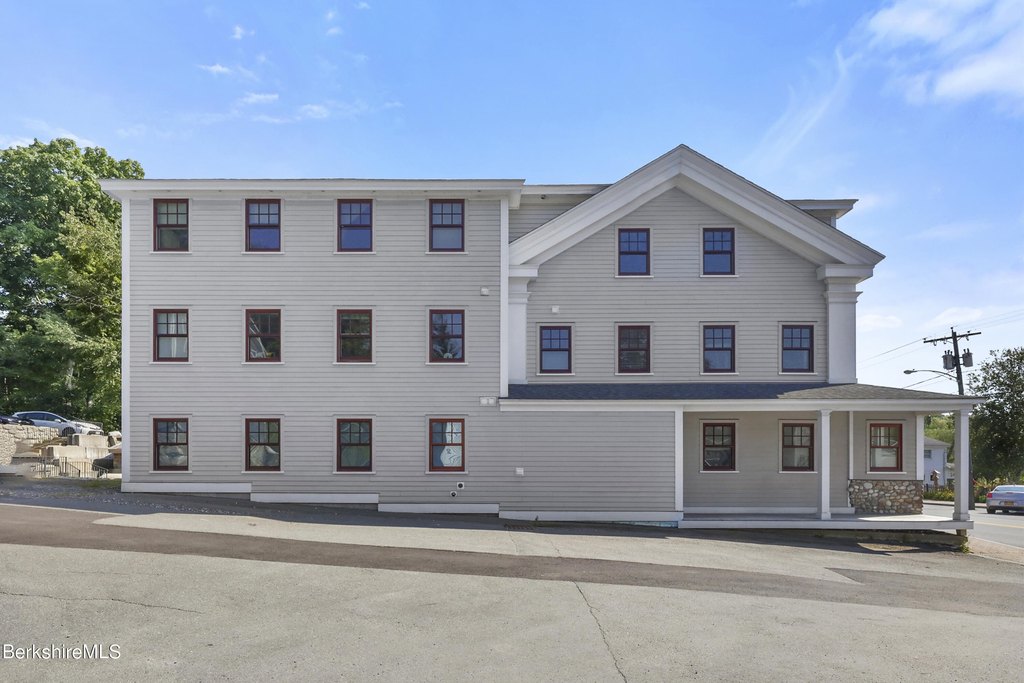
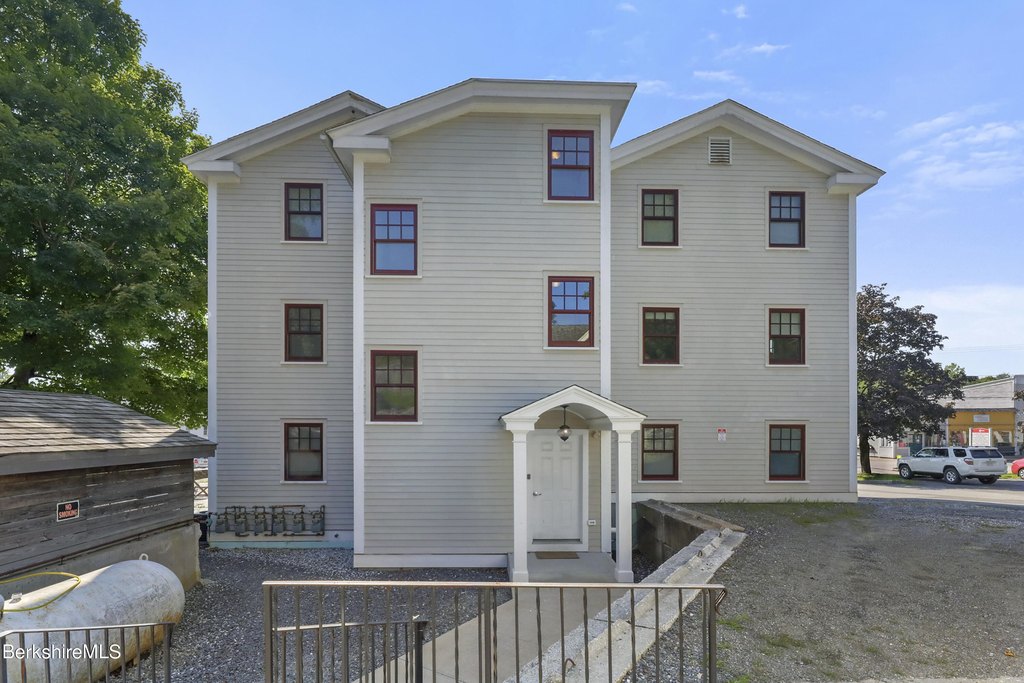
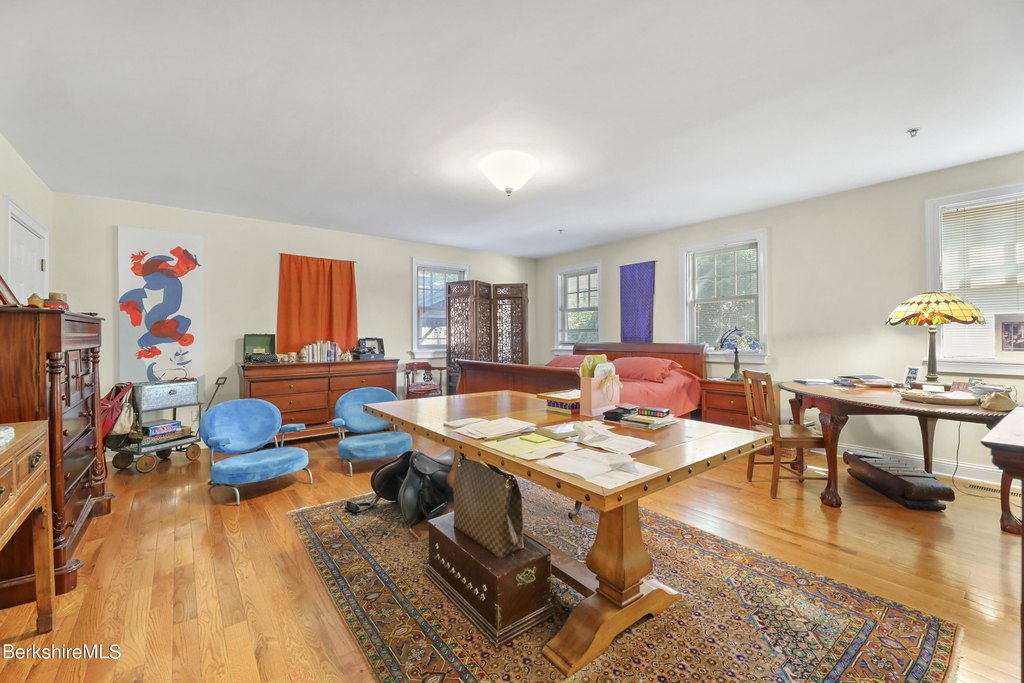
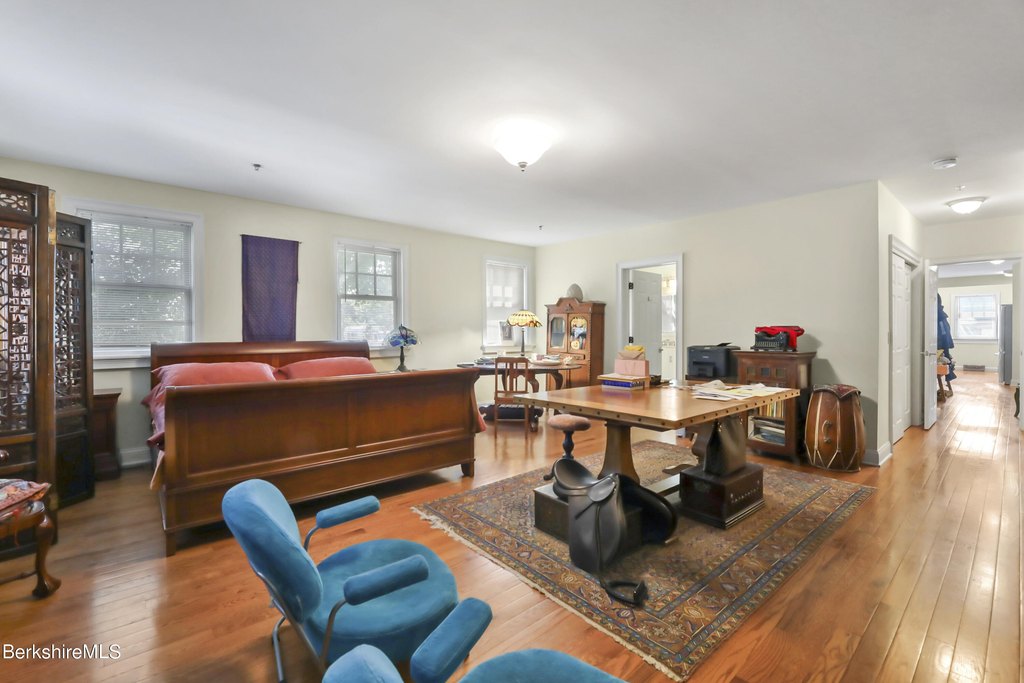
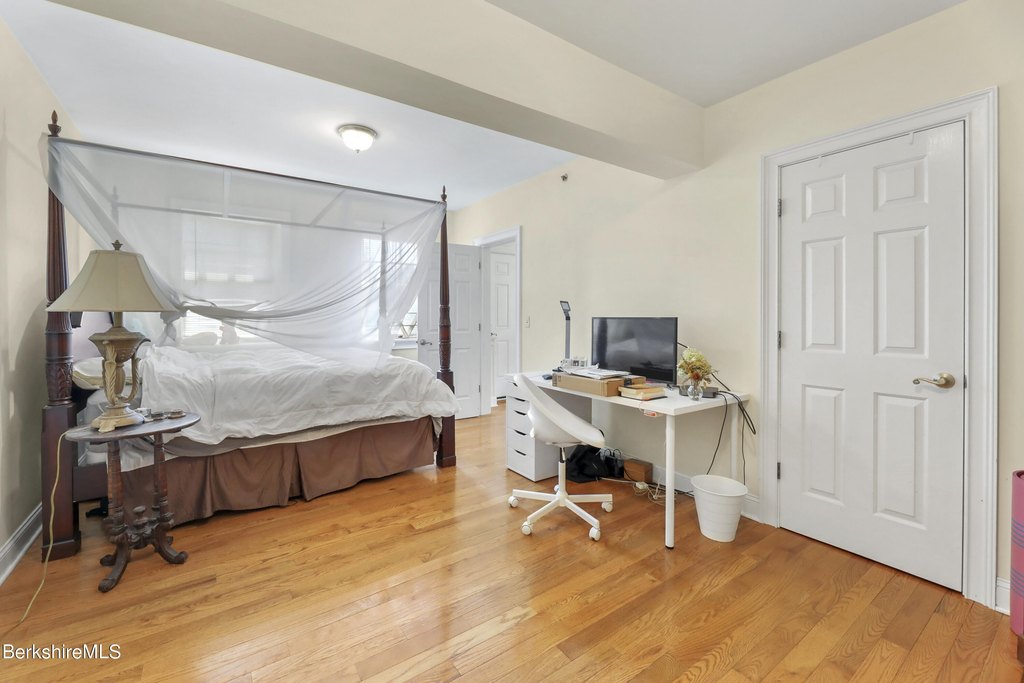
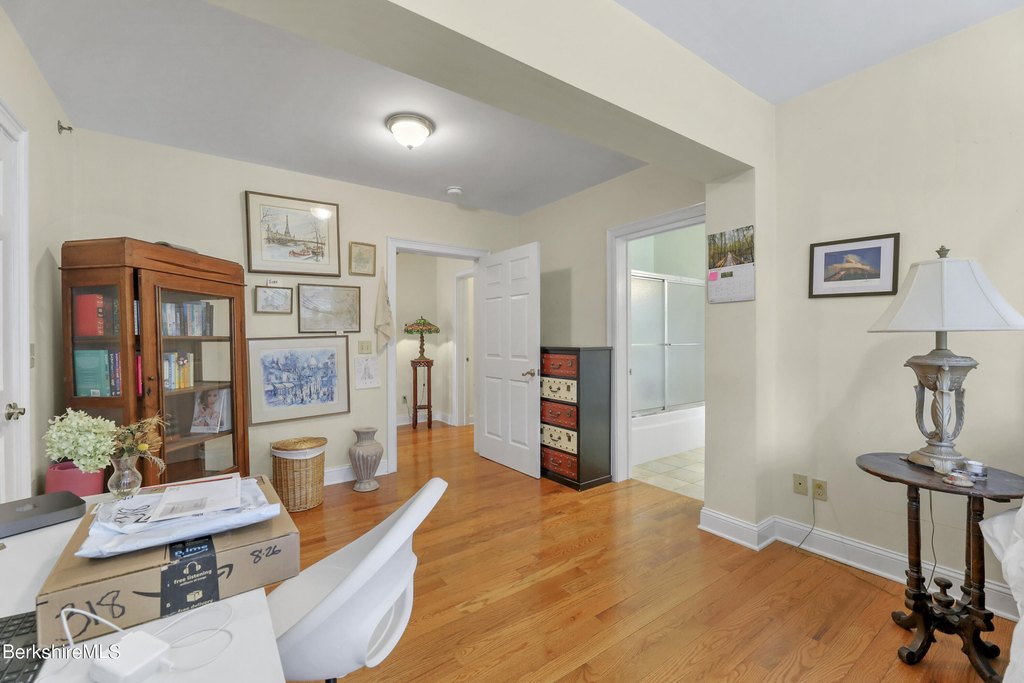
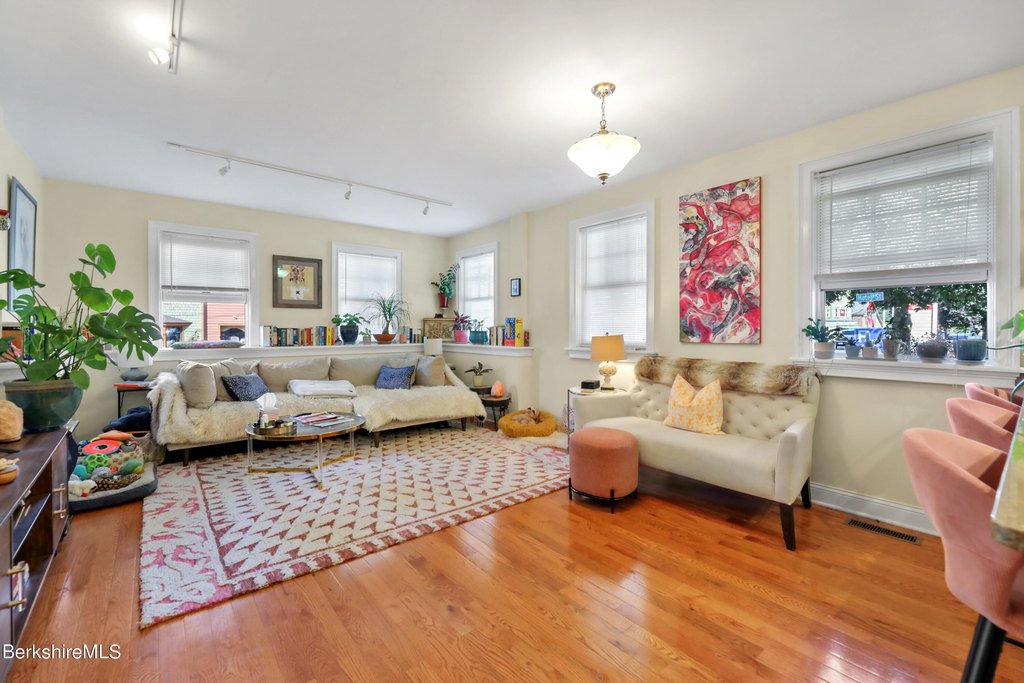
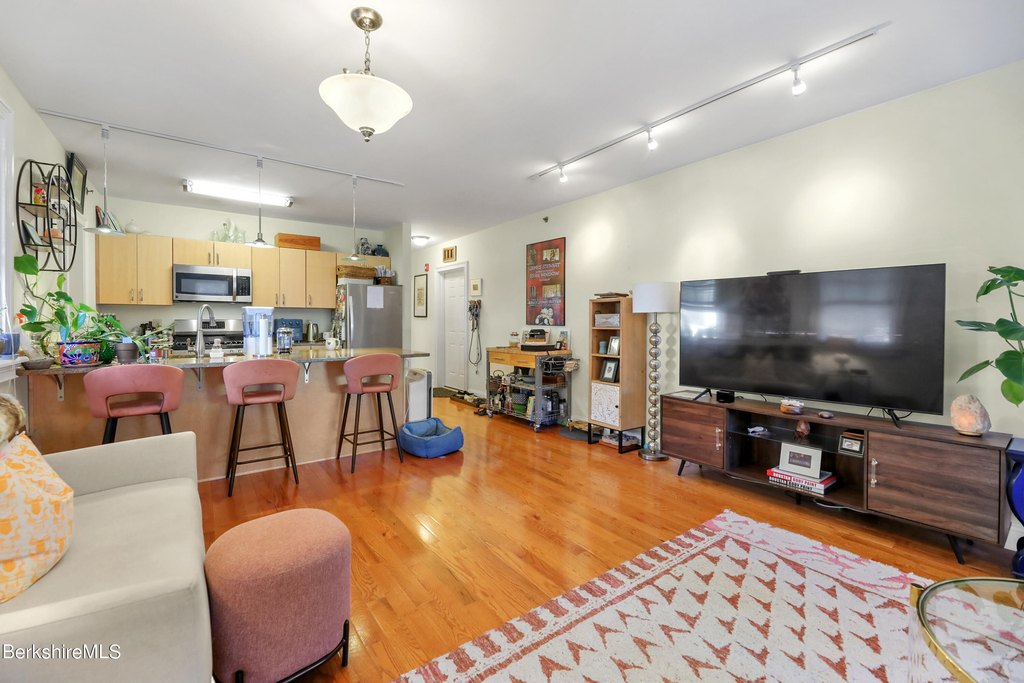
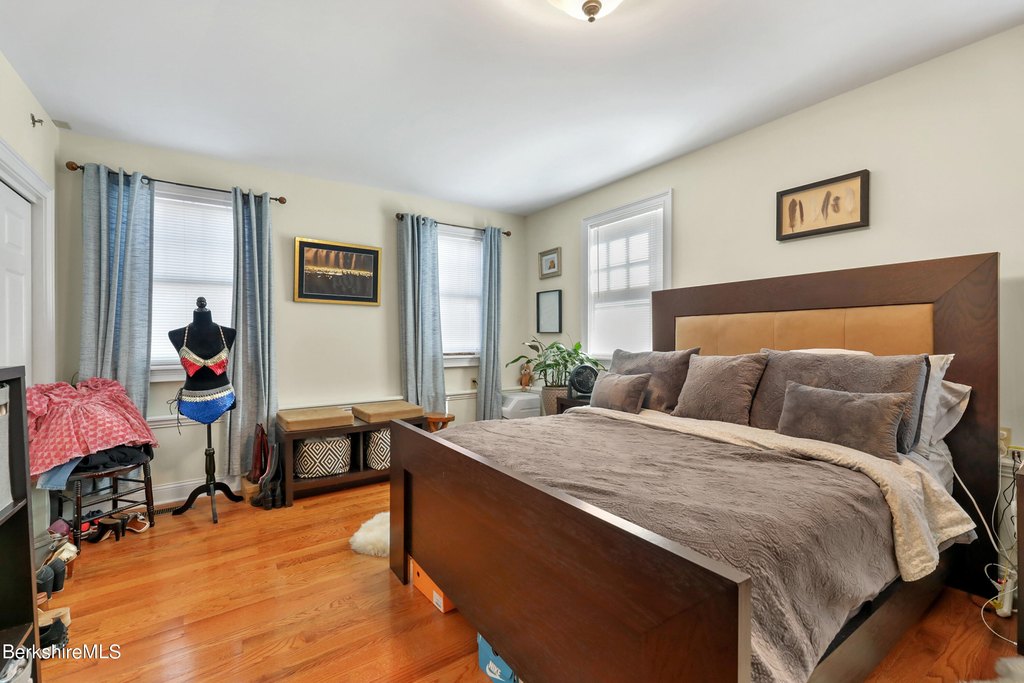
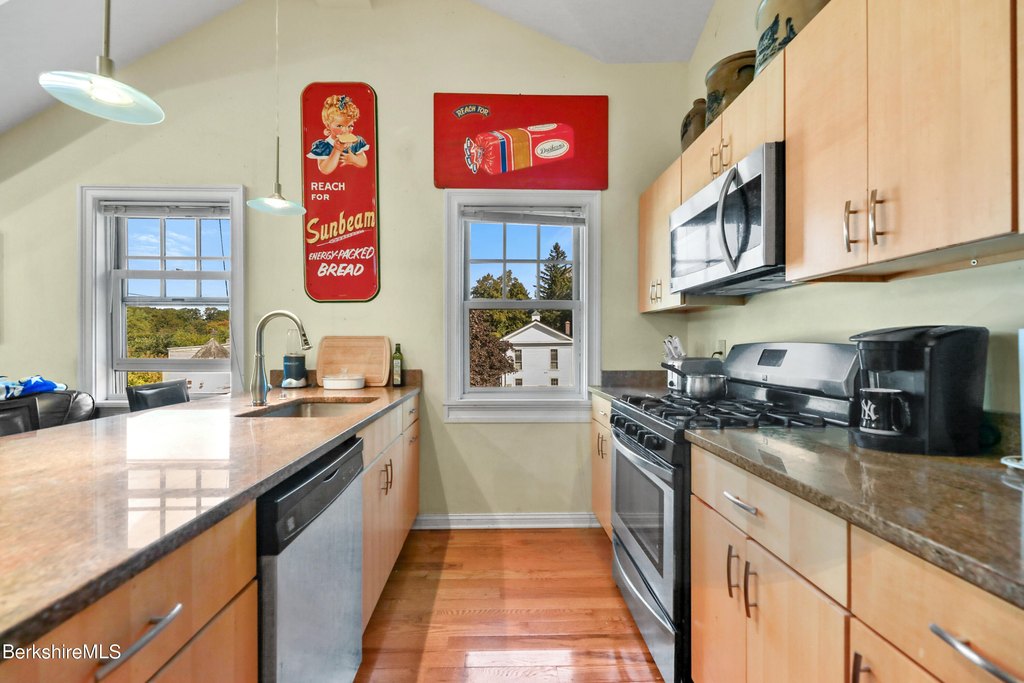
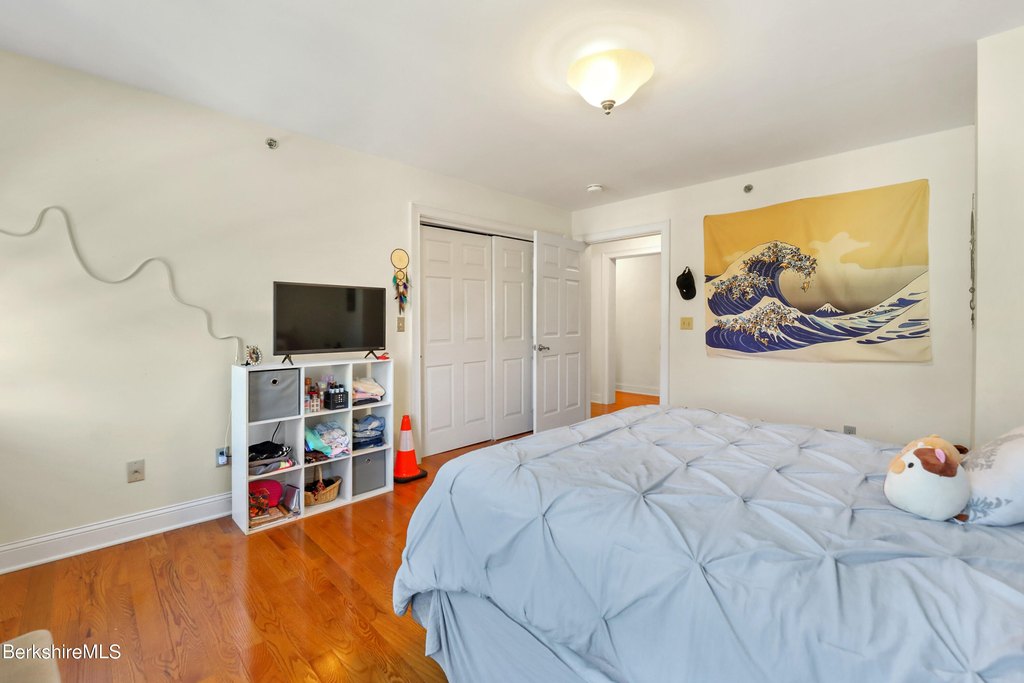
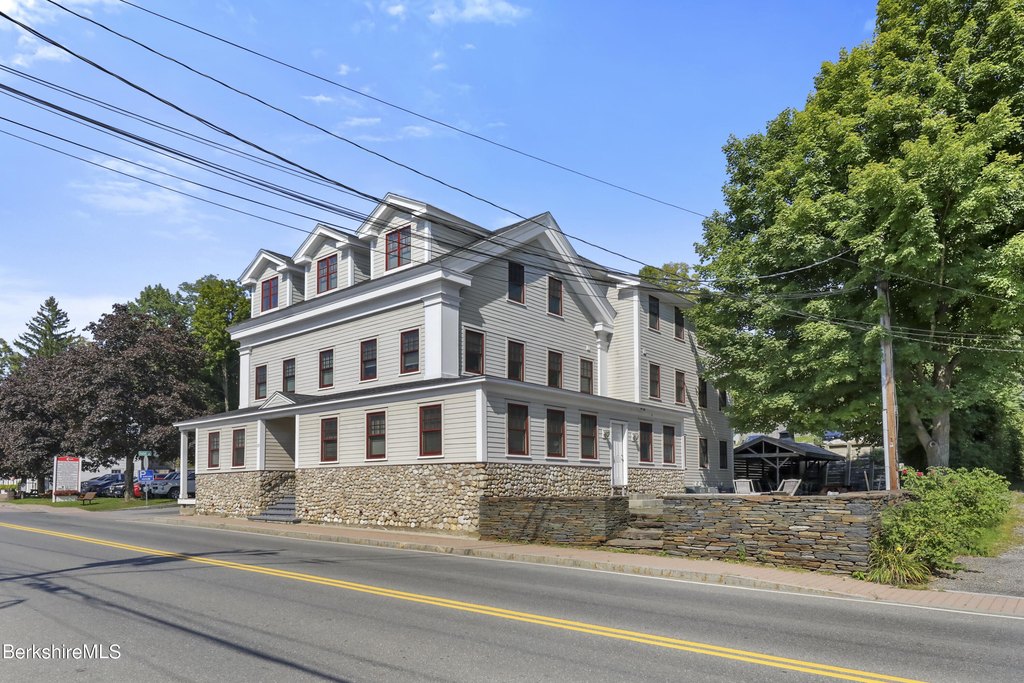
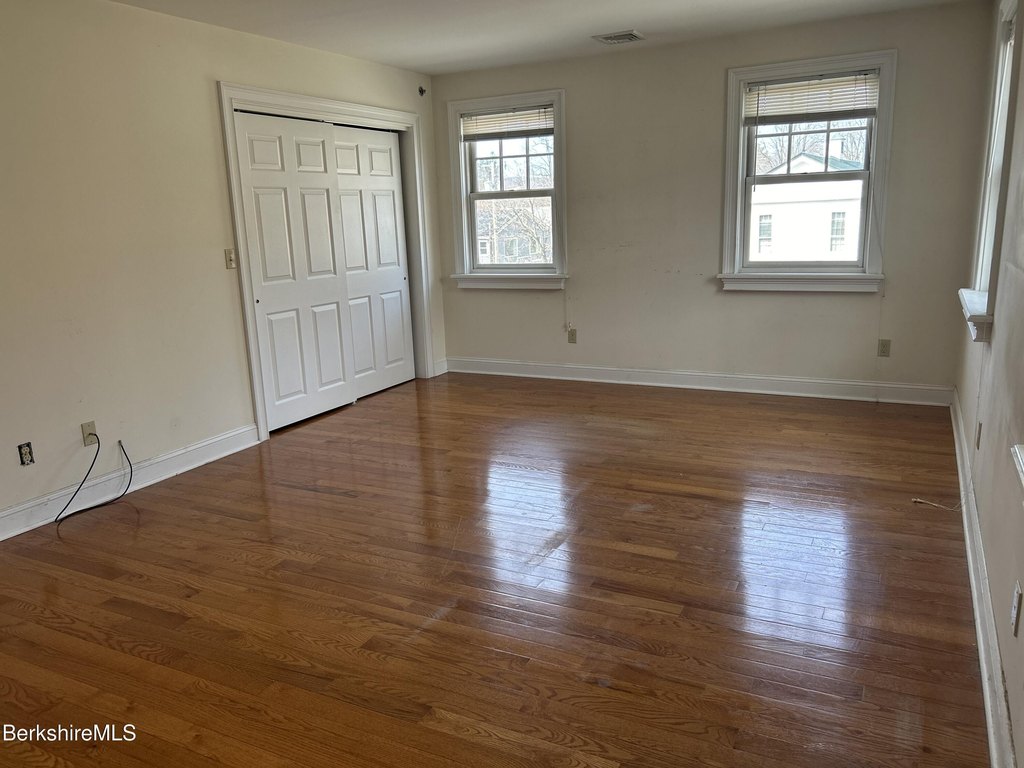
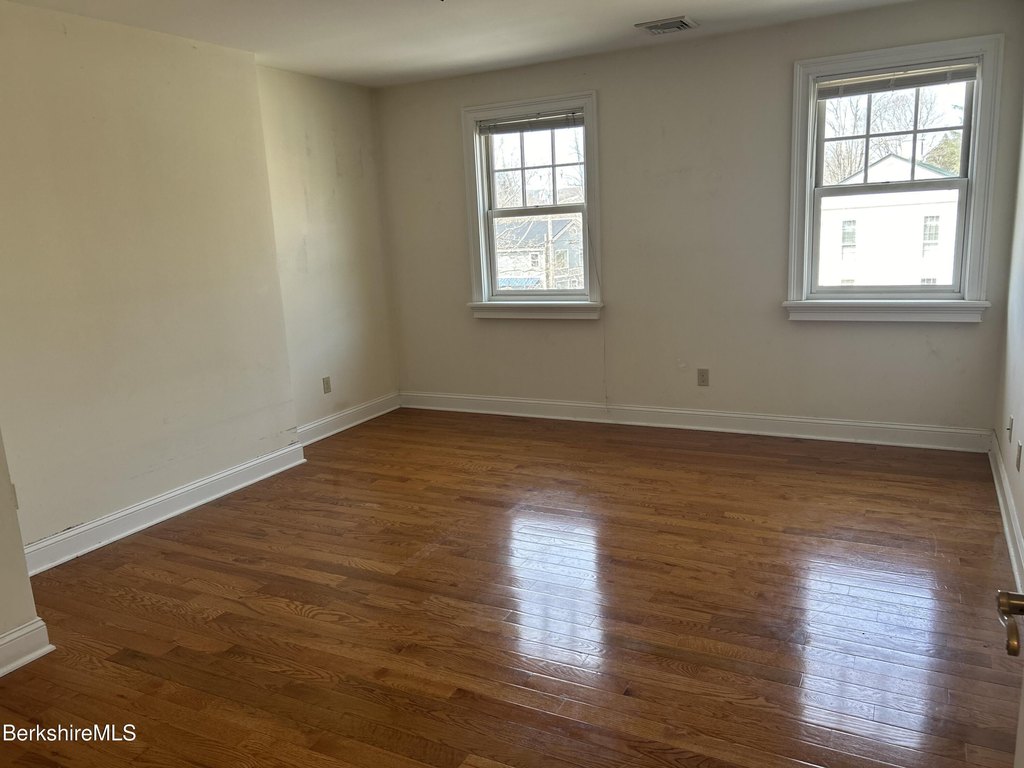
This 1900 Colonial building contains six renovated apartments within 8881 square feet. Residential features include wood and ceramic tile flooring, dishwashers, in-unit laundry, central air conditioning, tiled bathrooms with double sinks, and individual storage. An elevator, accessible elevator installation, high-speed wiring, and off-street parking add practical support for residents. The property also includes an outbuilding and wood-frame construction.
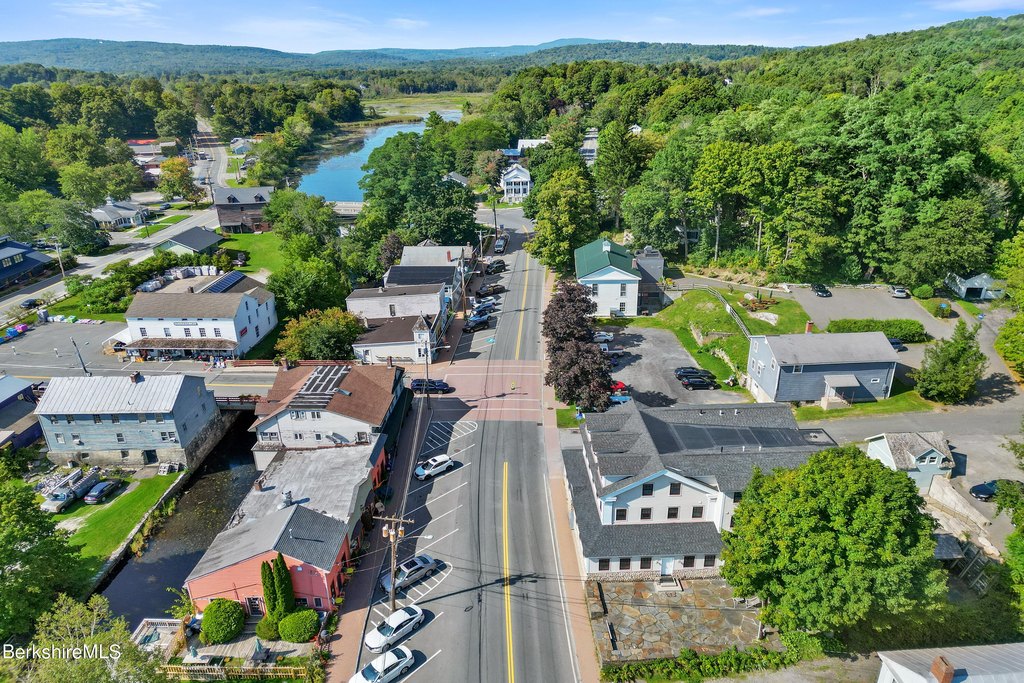
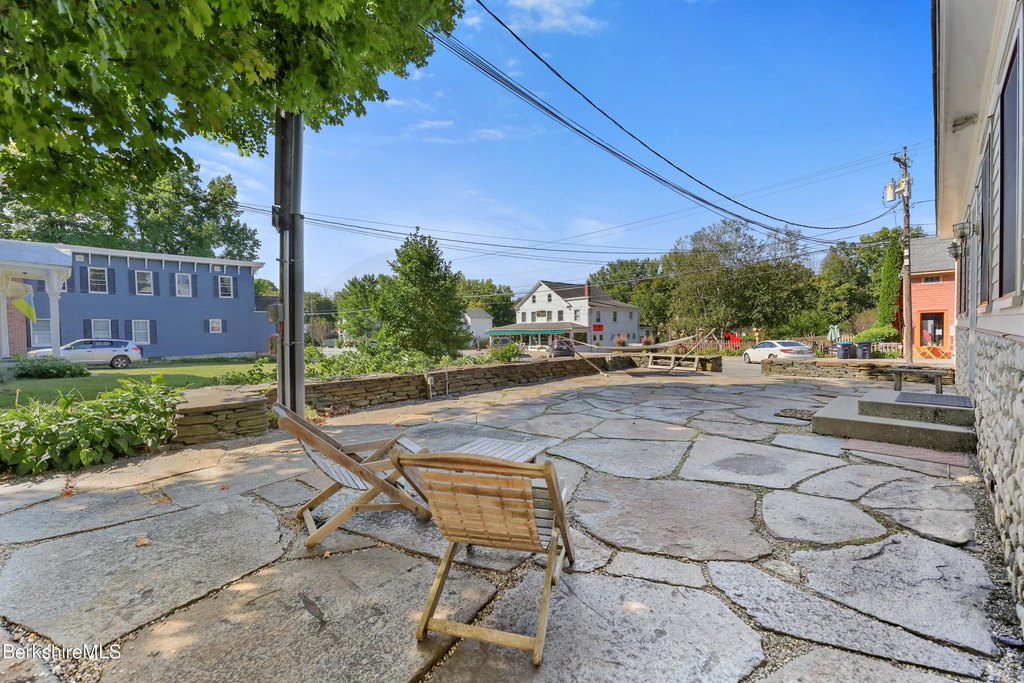
Set on 0.3 acres at 29 Main St in West Stockbridge, the building is situated in the downtown area. Public water and public sewer serve the property. Interior details include granite and soapstone counters, vaulted or cathedral ceilings, and a Colonial architectural style. The room inventory includes 12 bedrooms and 7 bathrooms, while the building’s apartment configuration provides a six-unit residential income property.
Set on 0.3 acres at 29 Main St in West Stockbridge, the building is situated in the downtown area. Public water and public sewer serve the property. Interior details include granite and soapstone counters, vaulted or cathedral ceilings, and a Colonial architectural style. The room inventory includes 12 bedrooms and 7 bathrooms, while the building’s apartment configuration provides a six-unit residential income property.
Key Highlights
- Six renovated apartments in a 8881‑square‑foot building
- Set on 0.3 acres at 29 Main St in downtown West Stockbridge
- 1900 Colonial architecture with wood‑frame construction
Financial Insights
Estimated NOI and Cap Rate
NOI / Yr
$121,367
Cap Rate
7.69%
Suggested Prices Based on Cap Rates
Cap Rate 5%
$2,427,340
$2.4M
Cap Rate 7%
$1,733,814
$1.7M
Cap Rate 9%
$1,348,522
$1.3M
Market Conditions
NOI Build-Up for 8,881 SF
Gross rent
$223.8K $25.20/SF
− Vacancy
−$3.1K −$0.35/SF
EGI
$220.7K $24.85/SF
− OpEx
−$99.3K −$11.18/SF
NOI
$121.4K $13.67/SF
Area
Berkshire County, MA
Vacancy
1.40%
Lease Rate
$25.20 /SF/Yr
Expense Ratio
45.00%
Simulate Cap Rate and NOI
Suggested Prices Based on Cap Rates
Cap Rate 5%
$2,427,340
Cap Rate 7%
$1,733,814
Cap Rate 9%
$1,348,522
Alternative Uses
Best Use
Apartment 5plus
$1.73M
$1.52M – $2.02M
NOI $121,367 @ 7.0% cap · market cap 7.69%
Second Best
—
—
no second resolved use
Theoretical Best
Office A
$2.60M
$2.28M – $3.03M
NOI $182,025 @ 7.0% cap · market cap 11.53%
Zoning and permitted uses should be independently verified with authorities.
Property Analytics
Unlock full access to Insights
Subscribe to Realmo Intelligence
Open Analytics
Current Use
Lease Details
6
Residential units
Location Intelligence
Trade Area within ½ mile
136
Businesses Nearby
Explore this area
Business Placement
Demographics for 01266, MA
1,208
Population
798
Households
1.5
Avg Household Size
54
Median Age
73%
College-Educated
95%
High-School Grad
20.2 sq mi
ZIP Area
60
Density / Sq Mi
$98,828
Median Household Income
$42,438
Median Earnings
$1,471
Median Rent
$481,600
Median Home Value
Check the figures for this property
Cap Rate, Value Estimation, Potential NOI and more
View Realmo Analytics
Market
Vacancy Rate% for Multifamily in Northeast region

Questions? Ask Rey
Realmo’s AI knows this listing — price, zoning, demand, history. Ask anything.
Frequently Asked Questions
What type of property is this?
Apartment building - 1900 Colonial property with elevator access, in-unit laundry, and central air conditioning.
Where is this apartment building located?
The property is located at 29 Main St West Stockbridge, MA.
What is the asking price?
The asking price for this property is $1,579,000.
What are key features of this property?
This property features: Six renovated apartments in a 8881‑square‑foot building; Set on 0.3 acres at 29 Main St in downtown West Stockbridge; 1900 Colonial architecture with wood‑frame construction


