Renovated Professional Office
For Sale
$345,000
2878 South Osceola Avenue Unit 5E, Orlando, FL 32806
Renovated 958 SF office condo with two office areas, natural light, recessed lighting, updated flooring, and a renovated break room.
Property Size958 SF
Price / SF$360.13
Days on Market115
Property Features for 2878 South Osceola Avenue Unit 5E
General Information
Standard status
Active
Size
958 SF
Class
B
Property subtype
Single Tenant Office
Zoning
O-2/SP
Site & Location
Highway Access
Yes
Road Access
Yes
Building Details
Building Size
958 SF
Year Built
1973
Listing Agency:
Blueprint Commercial
Listed By:
Brooke Grahl-Quttaineh, CCIM
(407) 432-7675
Source:
Thebrokerlist
Added: Jun 22
Changed: Oct 4
Last Checked: Oct 12 at 4:42PM
Displayed information is deemed reliable but is not guaranteed and should be independently verified. All listing content including descriptions, pricing, images are the copyrighted material of Blueprint Commercial
Investment Insights
Based on property information with market context.
This well-maintained professional office condominium offers approximately 958 SF of renovated interior space. The layout includes two separate office areas with natural light and oversized windows, plus a dedicated printer area. Interior improvements include a completely renovated break room and a bathroom with a bonus shower, along with new tile flooring and recessed lighting. A recently replaced roof and continued condominium upkeep support a clean, ready-to-occupy environment.
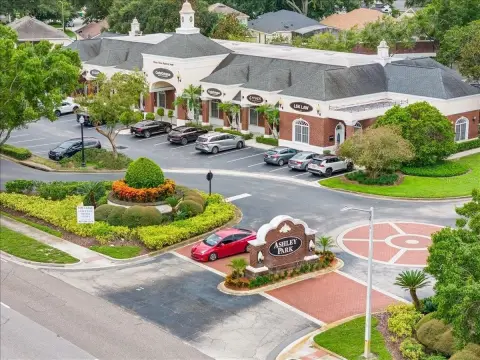
The unit is located on South Osceola Avenue in Orlando’s SODO district. The property provides convenient accessibility with ample parking and well-maintained landscaping, and it is described as having easy access to Orange Avenue and Michigan Street, as well as 408 and I-4. The remarks also note proximity to the Orlando Health Downtown Campus and convenient connectivity to downtown Orlando.
Zoned O-2/SP, the space is described as accommodating a variety of professional office and medical uses, offering flexibility for qualified operations within the permitted zoning framework.
The unit is located on South Osceola Avenue in Orlando’s SODO district. The property provides convenient accessibility with ample parking and well-maintained landscaping, and it is described as having easy access to Orange Avenue and Michigan Street, as well as 408 and I-4. The remarks also note proximity to the Orlando Health Downtown Campus and convenient connectivity to downtown Orlando.
Zoned O-2/SP, the space is described as accommodating a variety of professional office and medical uses, offering flexibility for qualified operations within the permitted zoning framework.
Key Highlights
- Well‑maintained 958 SF professional office condominium (condo unit) built in 1973
- Two separate office areas with natural light and oversized windows
- Recent renovations include new tile flooring and recessed lighting
Financial Insights
Estimated NOI and Cap Rate
NOI / Yr
$17,891
Cap Rate
5.19%
Suggested Prices Based on Cap Rates
Cap Rate 5%
$357,820
$357.8K
Cap Rate 7%
$255,586
$255.6K
Cap Rate 9%
$198,789
$198.8K
Market Conditions
NOI Build-Up for 958 SF
Gross rent
$28.7K $30.00/SF
− Vacancy
−$4.9K −$5.10/SF
EGI
$23.9K $24.90/SF
− OpEx
−$6.0K −$6.23/SF
NOI
$17.9K $18.67/SF
Area
Orlando, FL
Vacancy
17.00%
Lease Rate
$30.00 /SF/Yr
Expense Ratio
25.00%
Simulate Cap Rate and NOI
Suggested Prices Based on Cap Rates
Cap Rate 5%
$357,820
Cap Rate 7%
$255,586
Cap Rate 9%
$198,789
Alternative Uses
Best Use
Office B
$255.6K
$223.6K – $298.2K
NOI $17,891 @ 7.0% cap · market cap 5.19%
Second Best
—
—
no second resolved use
Theoretical Best
Office A
$308.6K
$270.0K – $360.0K
NOI $21,602 @ 7.0% cap · market cap 6.26%
Zoning and permitted uses should be independently verified with authorities.
How Realmo checks its estimates
Property Analytics
Unlock full access to Insights
Subscribe to Realmo Intelligence
Open Analytics
Current Use
Lease Details
Yes
Highway access
Yes
Paved road access
Location Intelligence
Trade Area within ½ mile
2,002
Businesses Nearby
Explore this area
Business Placement
Demographics for 32806, FL
26,582
Population
12,529
Households
2.1
Avg Household Size
40
Median Age
55%
College-Educated
95%
High-School Grad
6.8 sq mi
ZIP Area
3,909
Density / Sq Mi
$86,653
Median Household Income
$54,012
Median Earnings
$1,500
Median Rent
$415,800
Median Home Value
Check the figures for this property
Cap Rate, Value Estimation, Potential NOI and more
View Realmo Analytics
Market
Vacancy Rate% for Office in Orlando, FL

Questions? Ask Rey
Realmo’s AI knows this listing — price, zoning, demand, history. Ask anything.




Frequently Asked Questions
What type of property is this?
Office units - Renovated 958 SF office condo with two office areas, natural light, recessed lighting, updated flooring, and a renovated break room.
Where is this office units located?
The property is located at 2878 South Osceola Avenue Unit 5E Orlando, FL.
What is the asking price?
The asking price for this property is $345,000.
What are key features of this property?
This property features: Well‑maintained 958 SF professional office condominium (condo unit) built in 1973; Two separate office areas with natural light and oversized windows; Recent renovations include new tile flooring and recessed lighting


