Single-Story Medical Office
2802 Leonard Drive Valparaiso, IN 46383
For Sale
$950,000
SINGLE_FAMILY - Valparaiso, IN
Property Size5,596 SF
Lot Size1.05 Acres
Price / SF$169.76
Days on Market405
Property Features for 2802 Leonard Drive
General Information
Property type
Residential
Property subtype
Office
Parking
50
Exterior features
Lighting
Standard status
Active
APN
641029153002000029
Size
5,596 SF
Lot size
1.05 Acres
Taxes and HOA fees
Tax Year
2025
Tax Description
REPLAT OF LOT 5 EASTPORT CENTRE FOR COMMERCE & INDUSTRY NW 29-35-5 LOT 5A 1.05A TIF DITCH
Tax Annual Amount
15421
Utilities
Sewer type
Public Sewer
Heating system
Forced Air
Water source
Public
Building Details
Year built
2005
Listing Agency:
BHHS Indiana Realty
(219) 464-8521
Listed By:
Debbie Miller · License #RB14018538
(219) 405-8648
Added: Jun 18, 2025
Changed: Jun 10
Last Checked: Jul 27 at 1:06PM
MLS# 822856
Copyright © 2026 Greater Northwest Indiana Association of REALTORS. All rights reserved. All information provided by the listing agent/broker is deemed reliable but is not guaranteed and should be independently verified.
Investment Insights
Based on property information with market context.
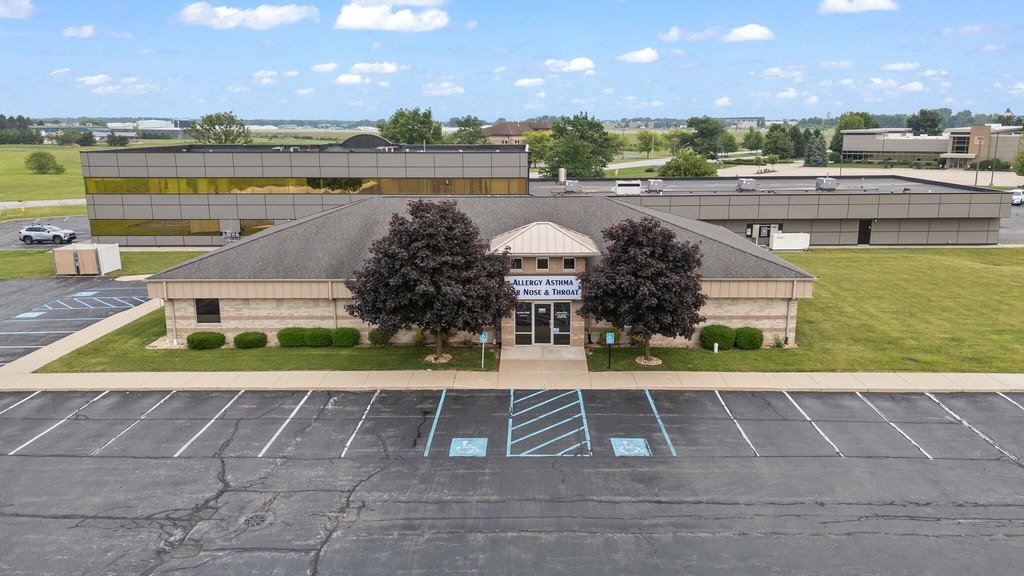
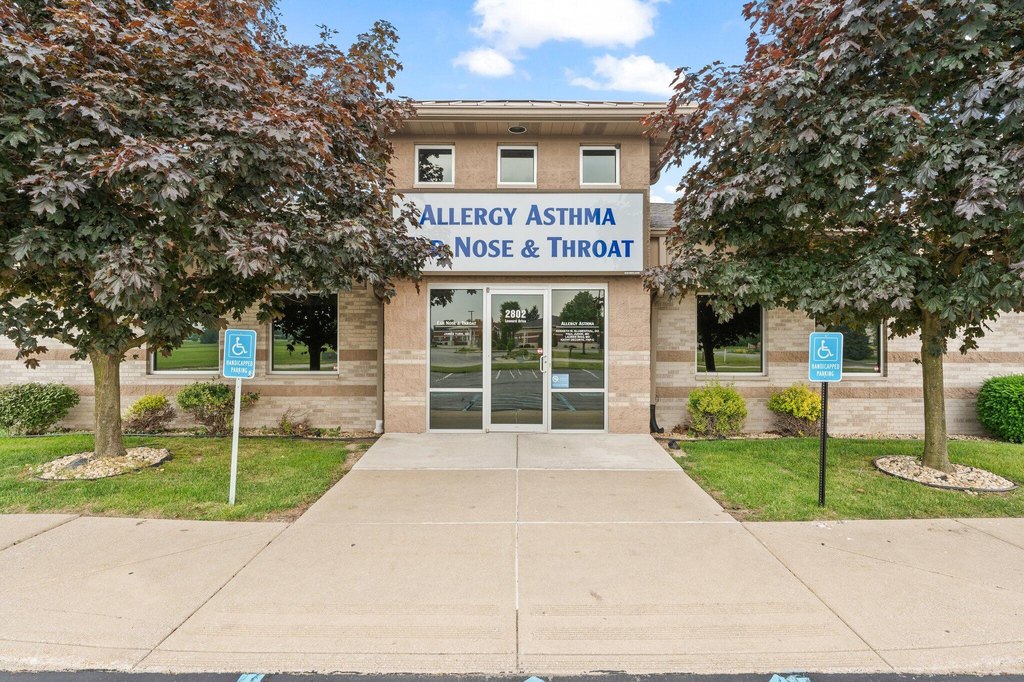
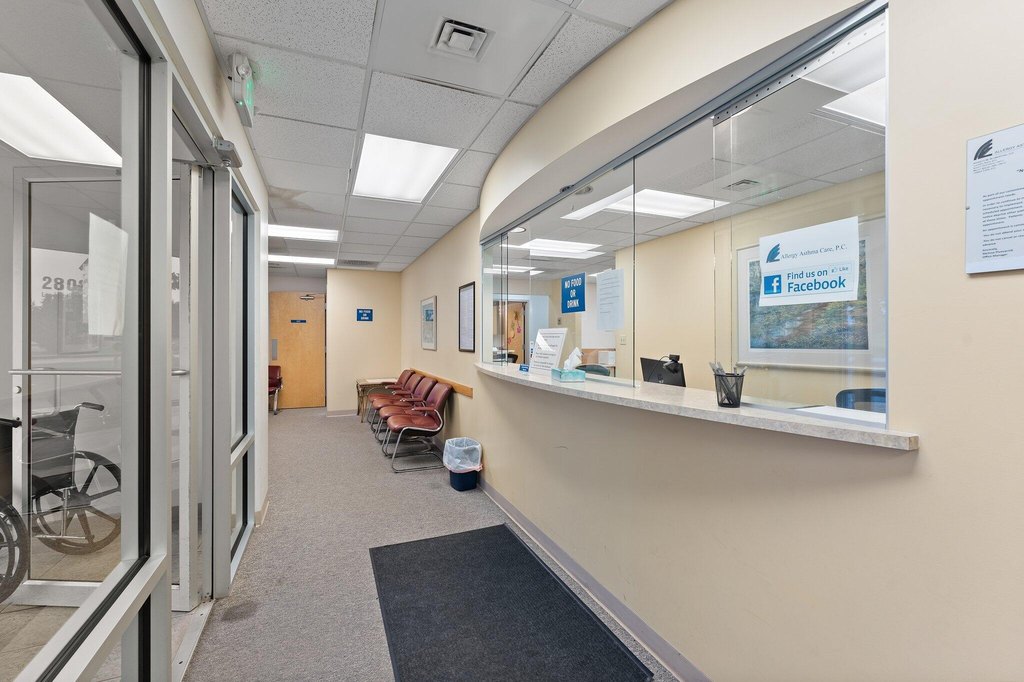
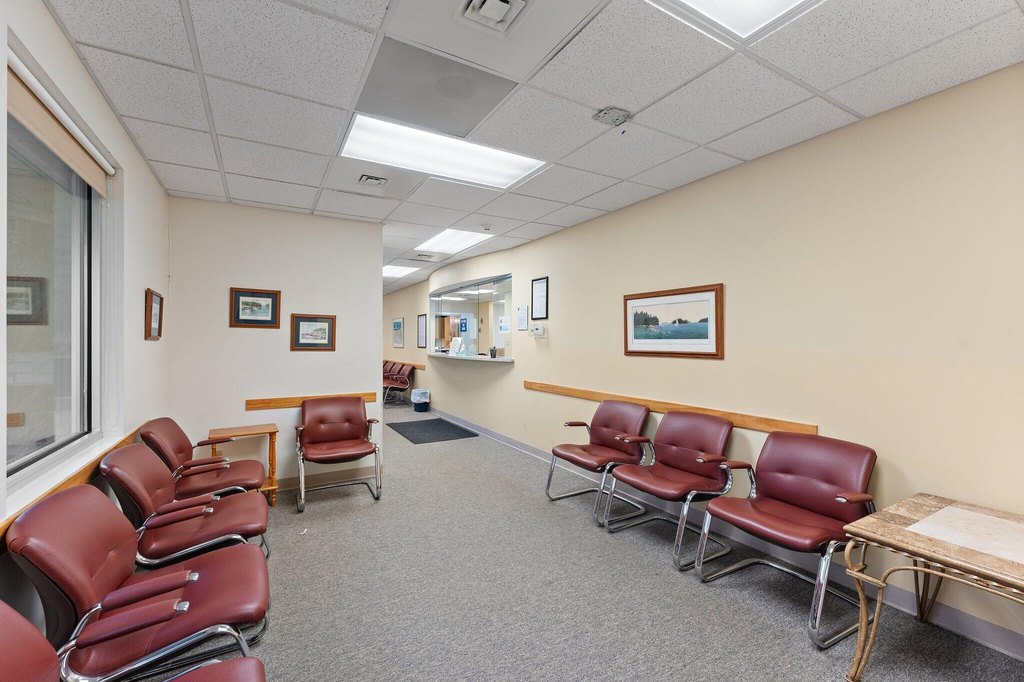
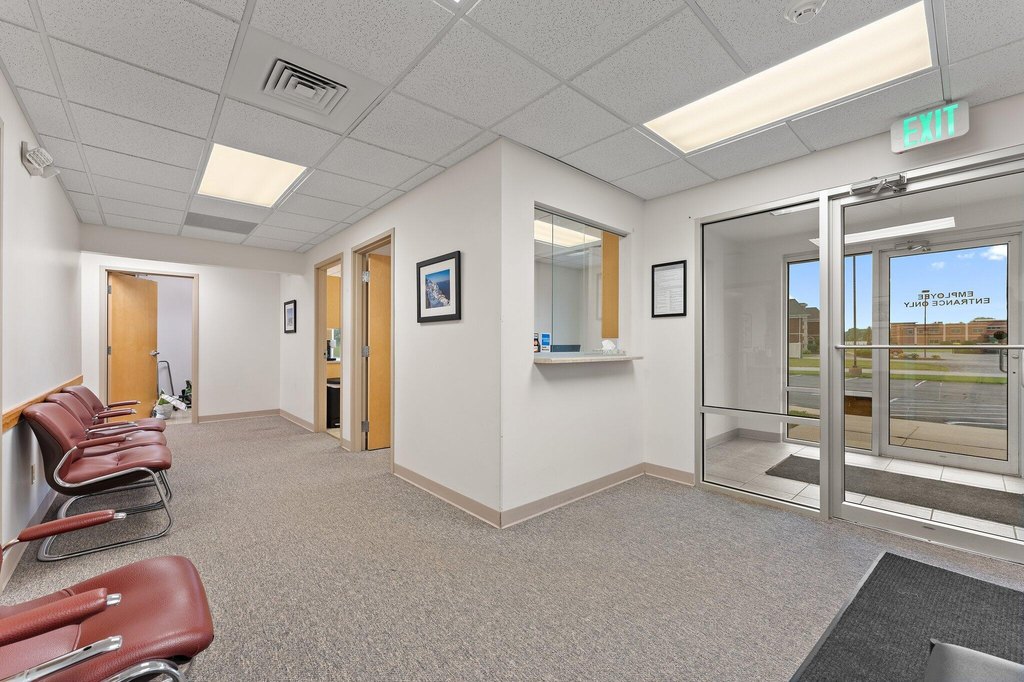
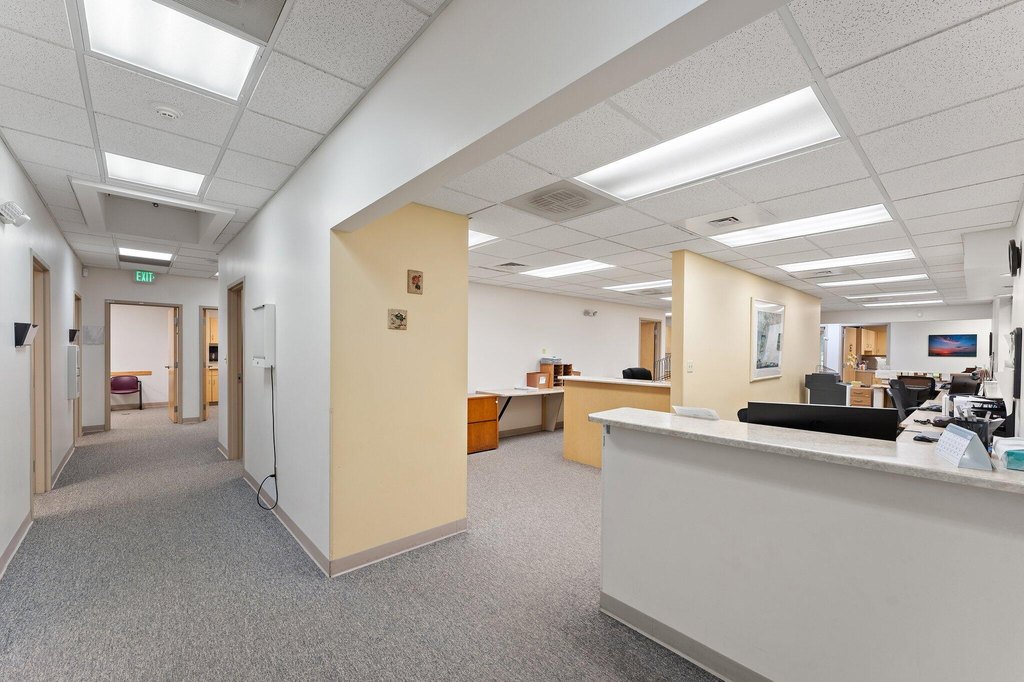
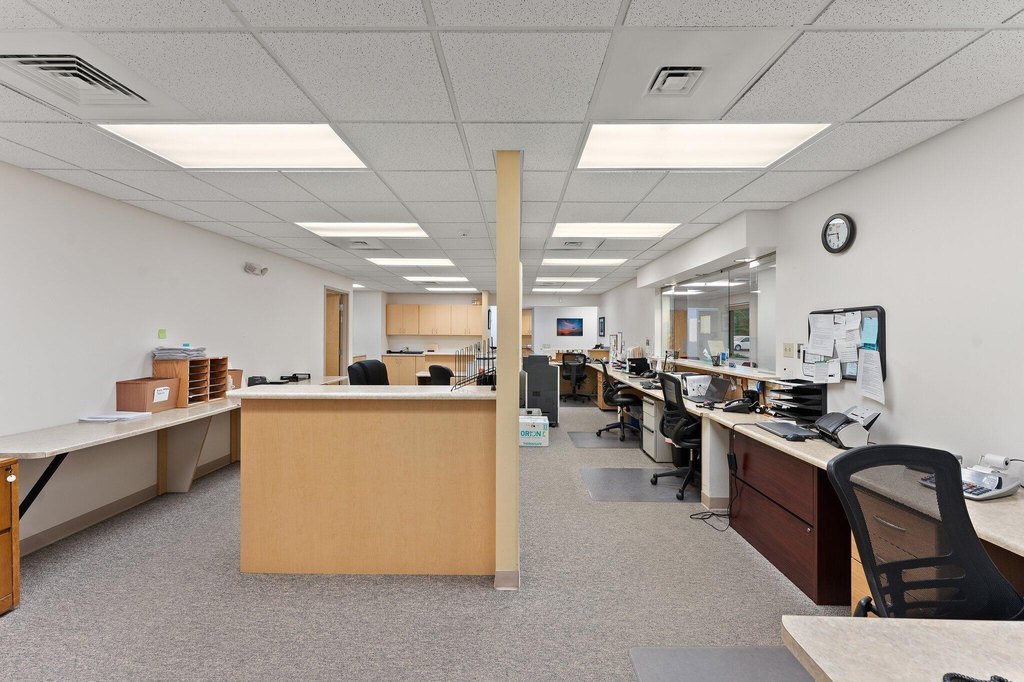
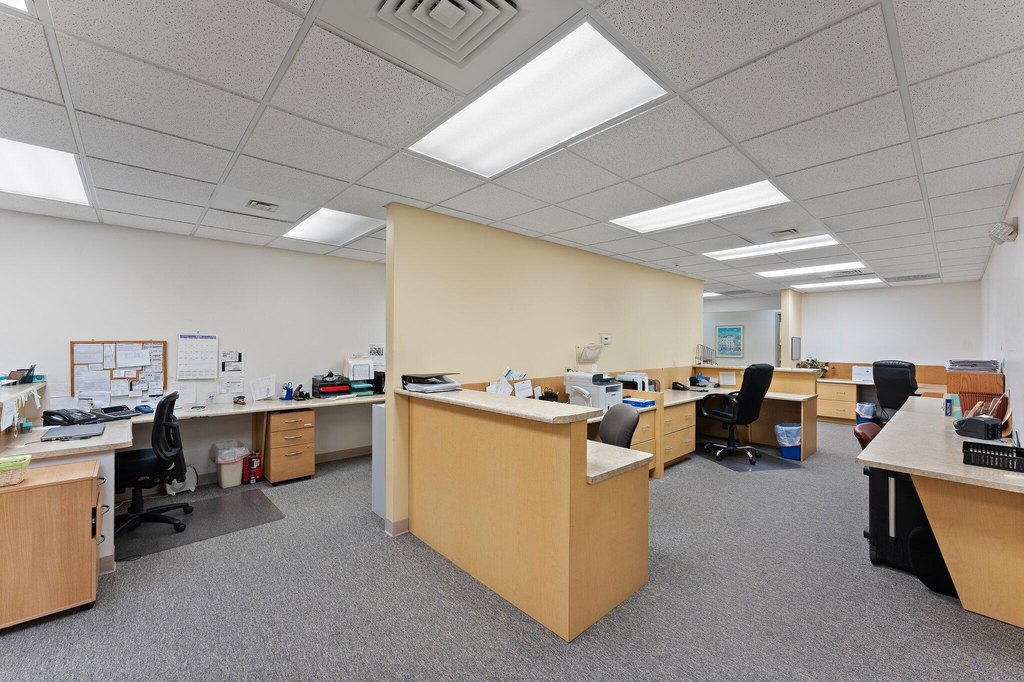
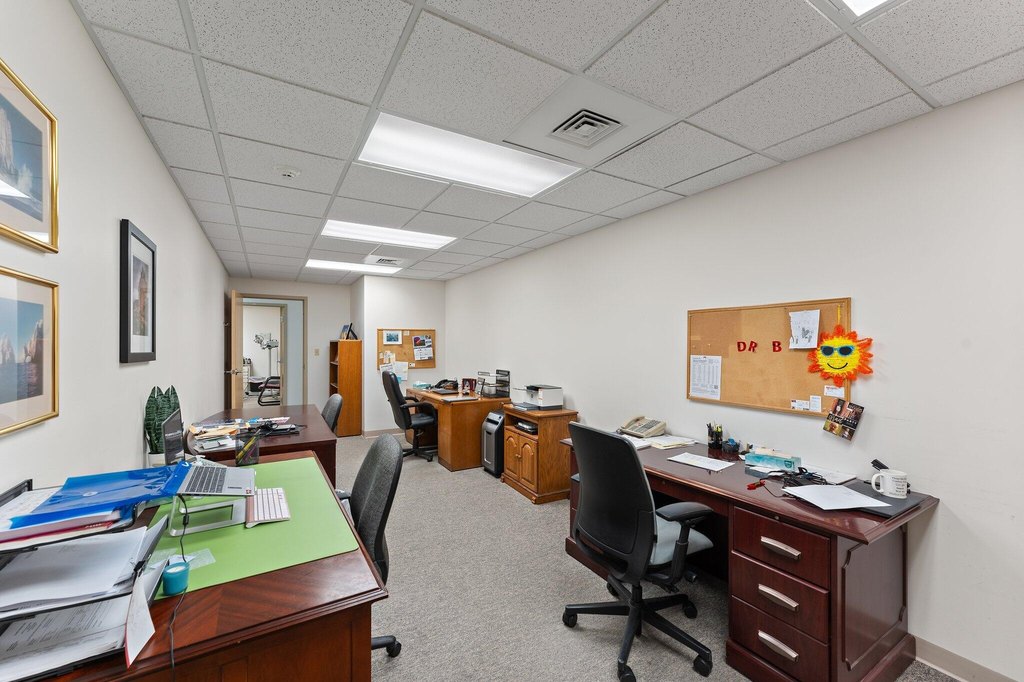
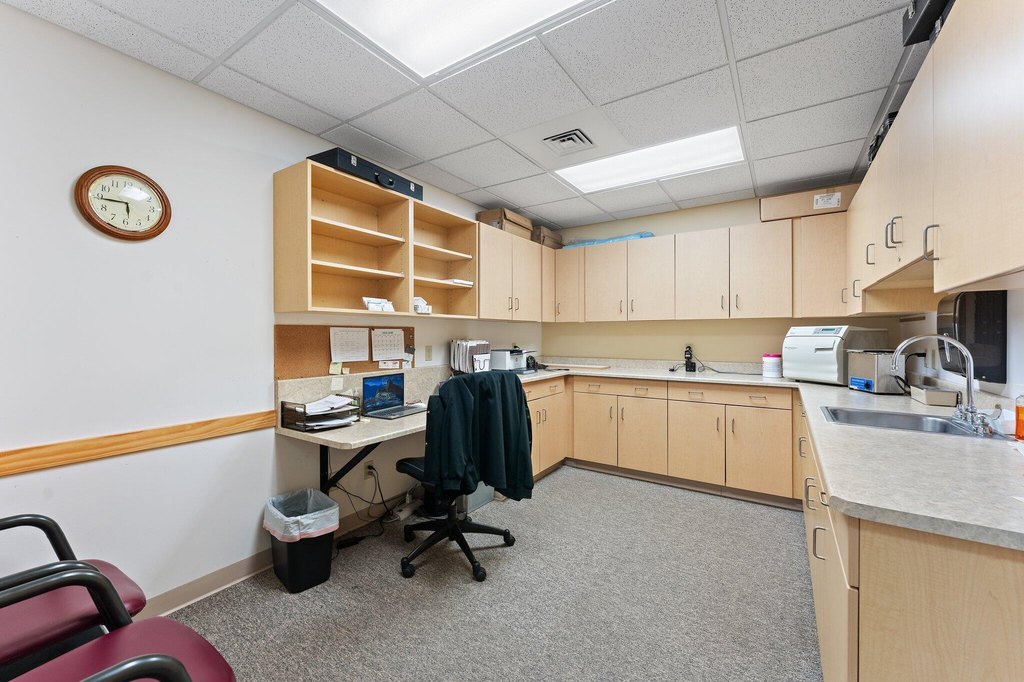
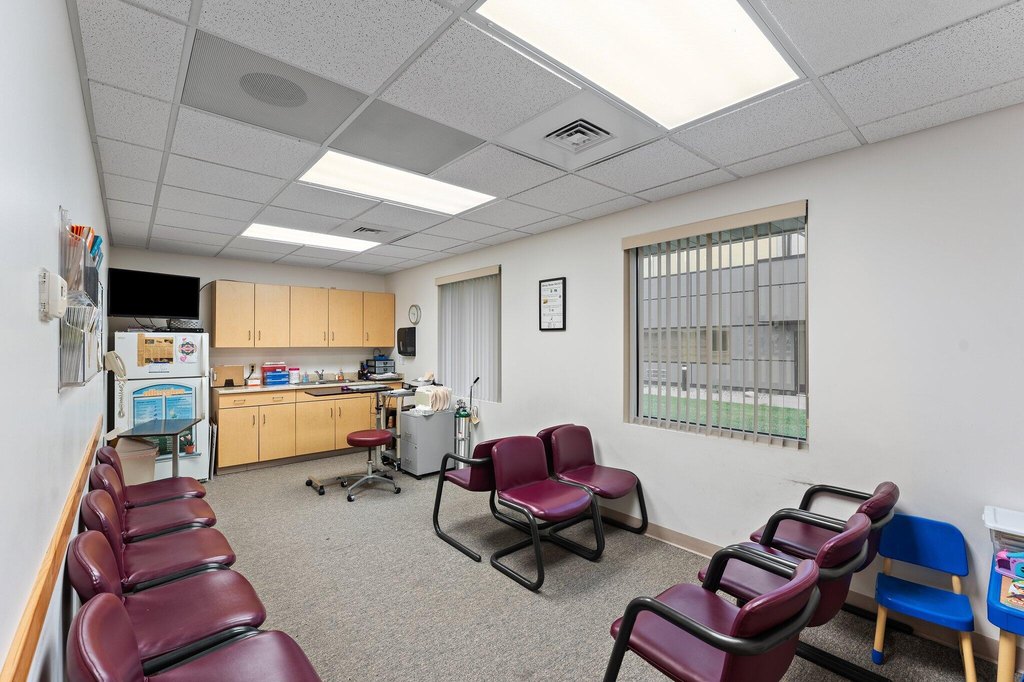
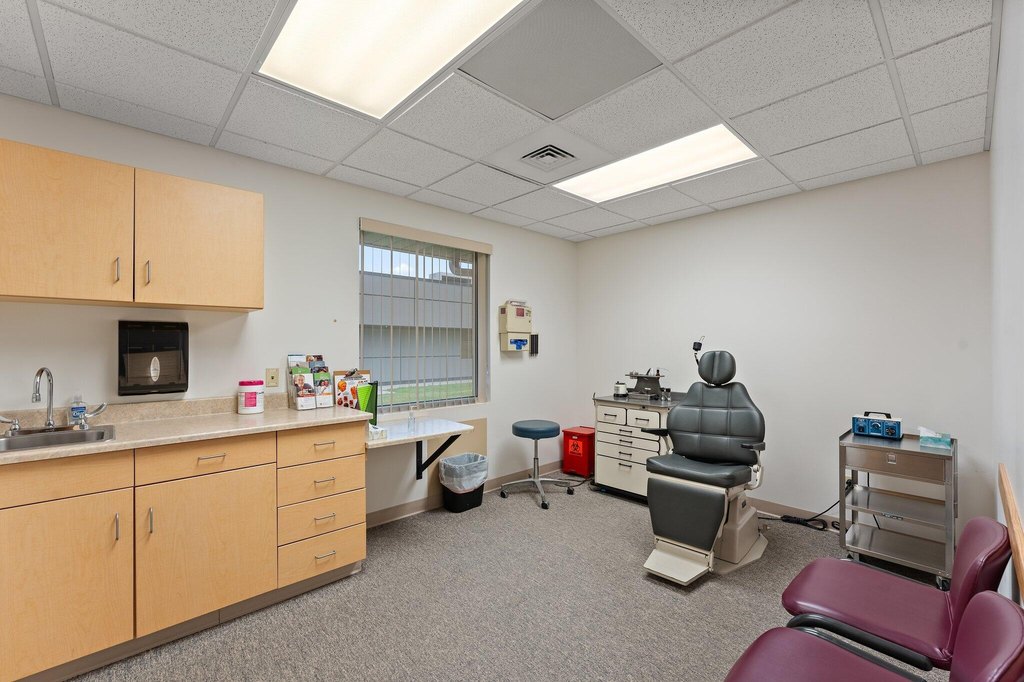
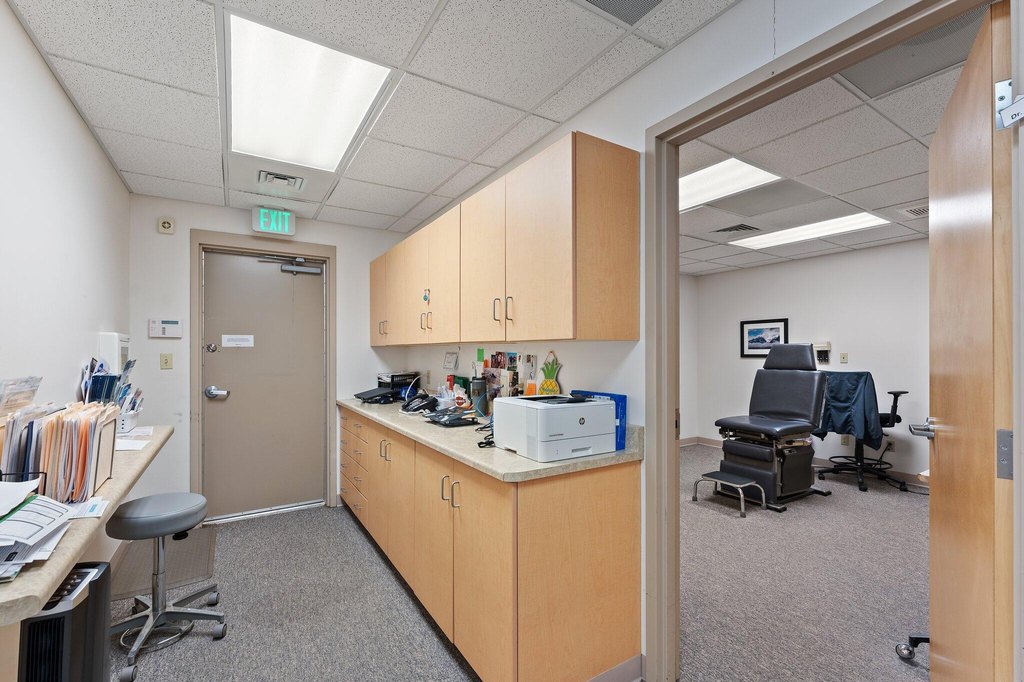
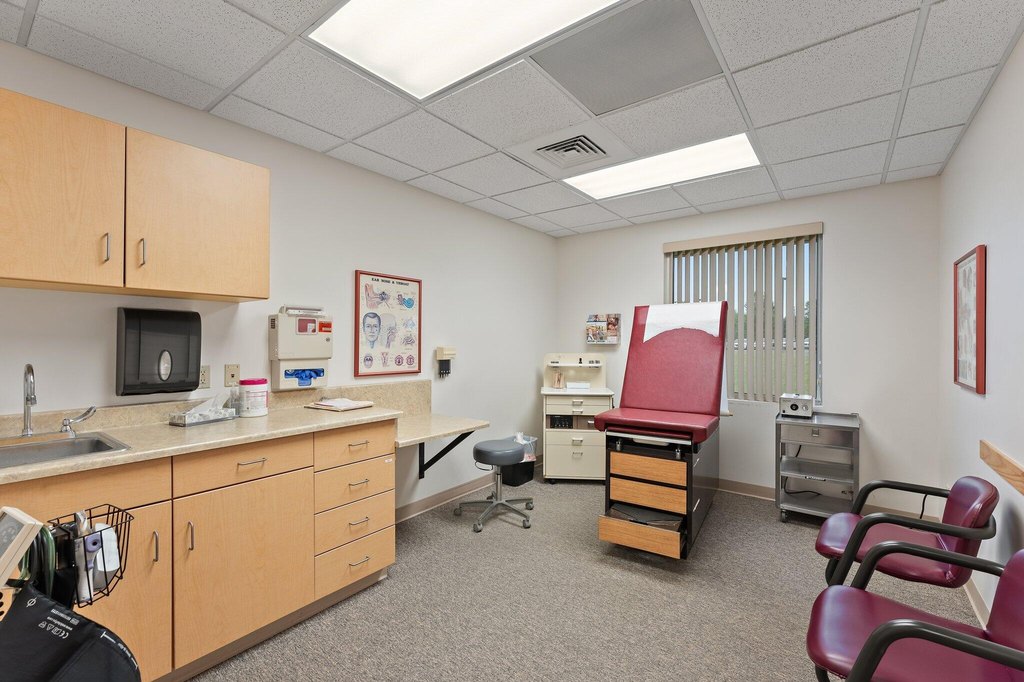
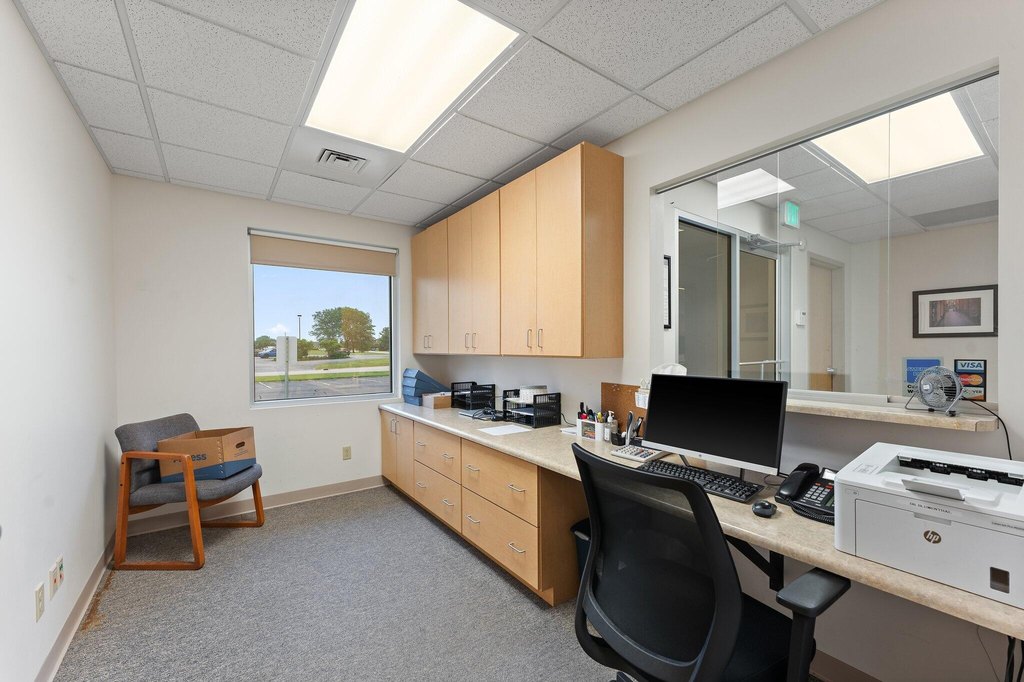
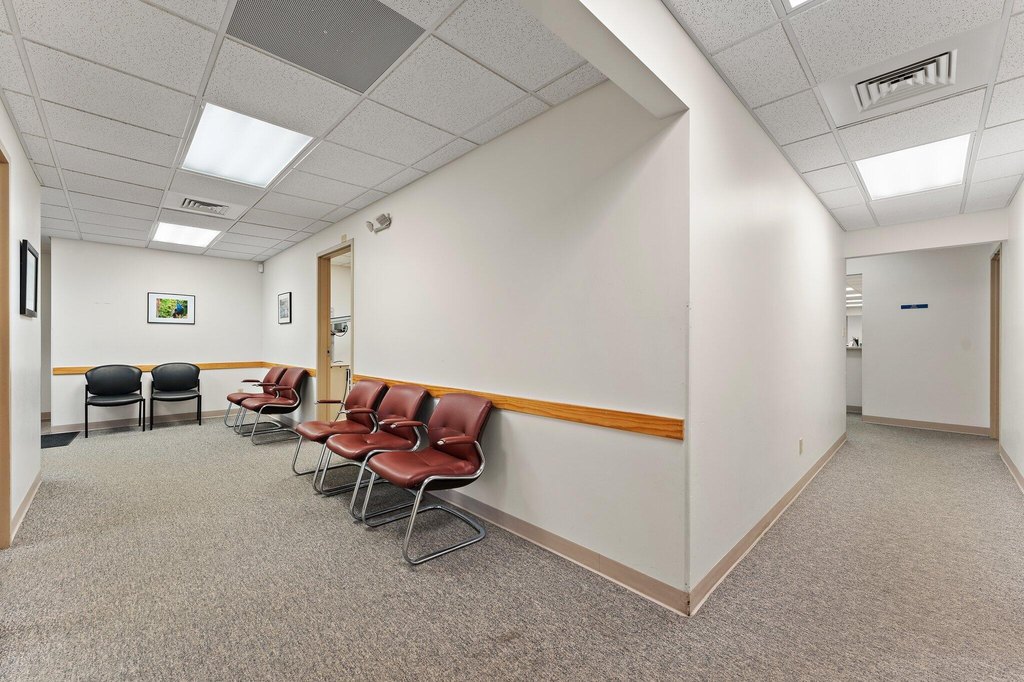
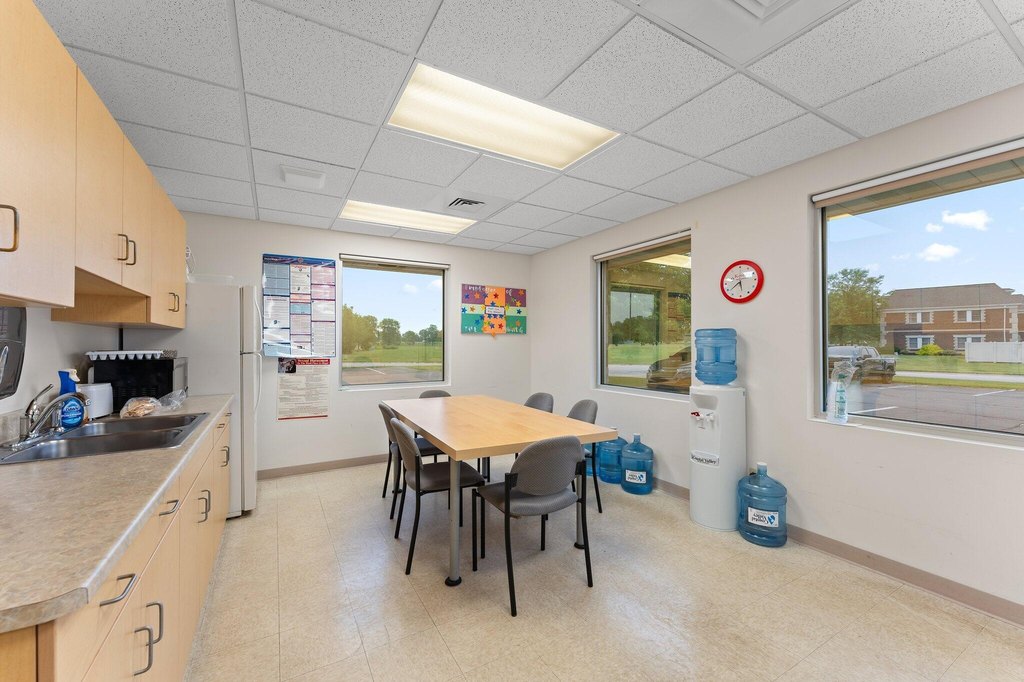
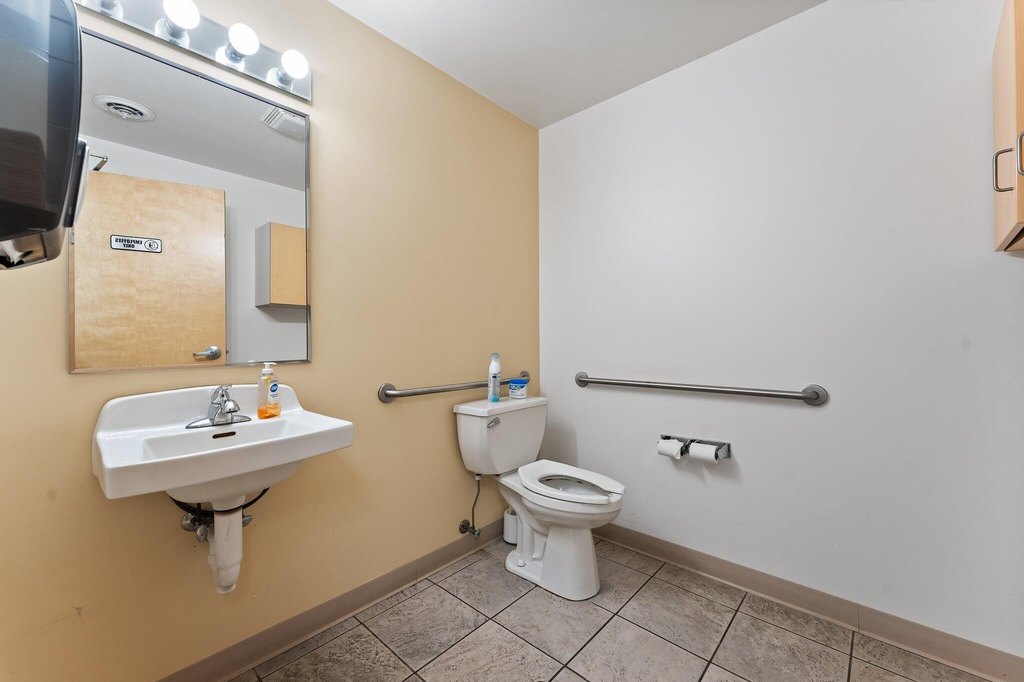
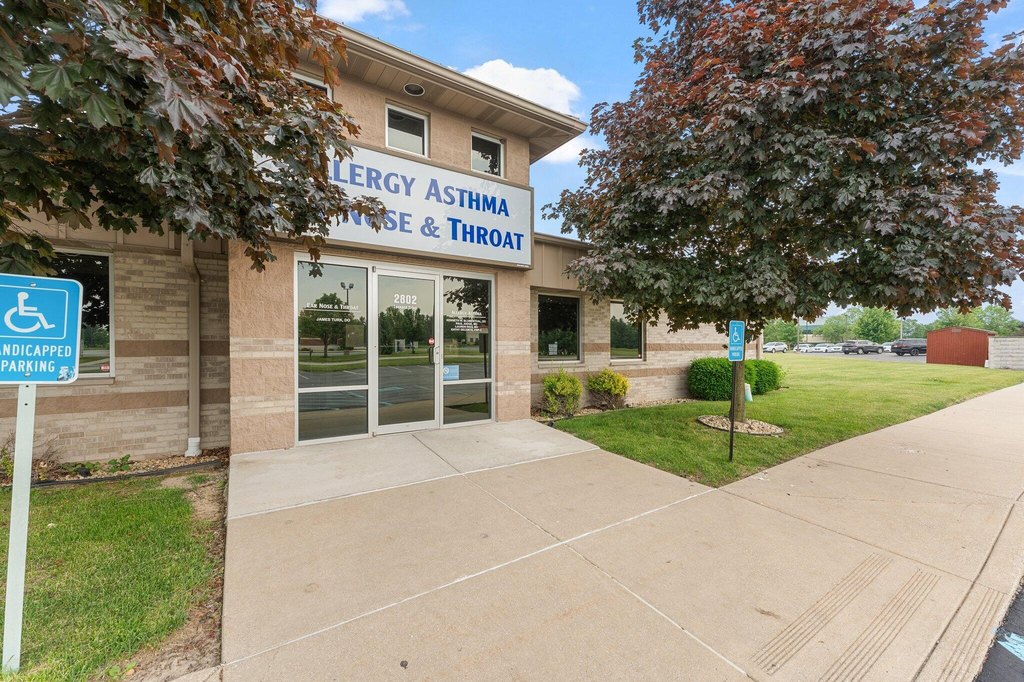
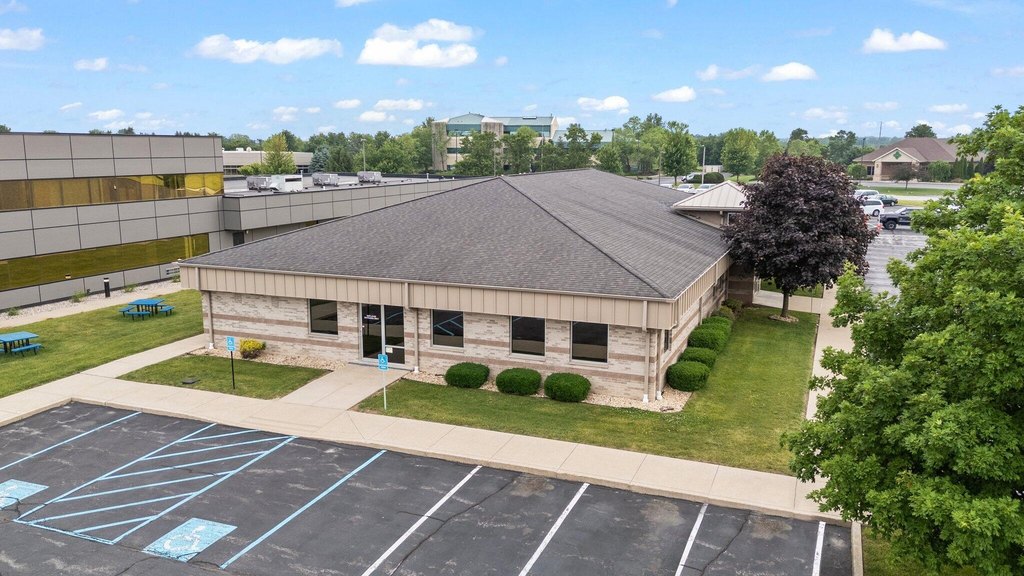
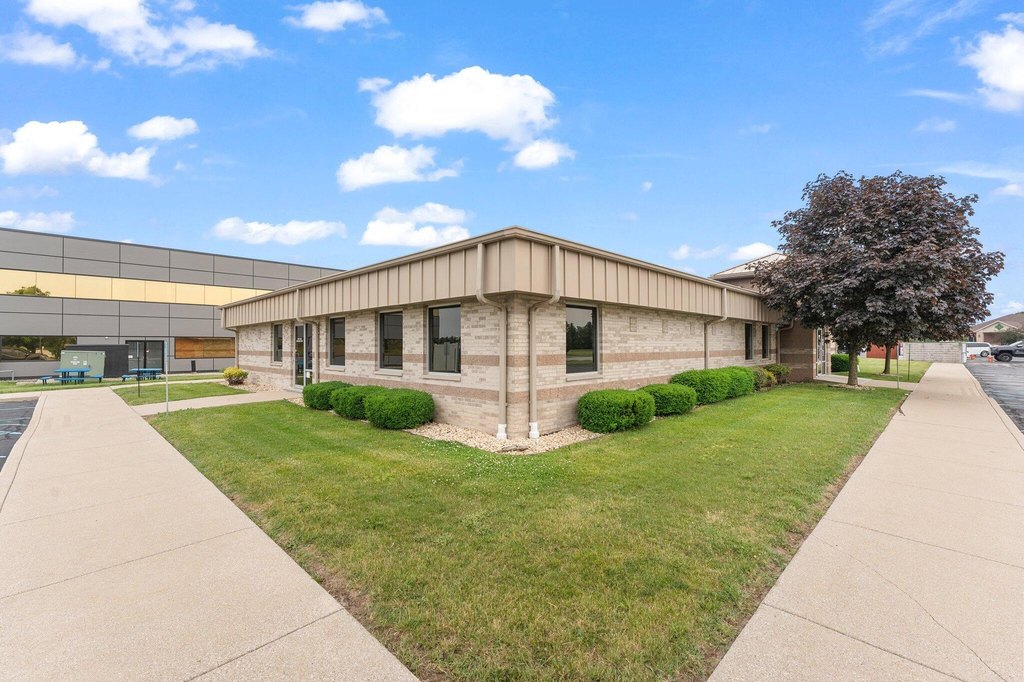
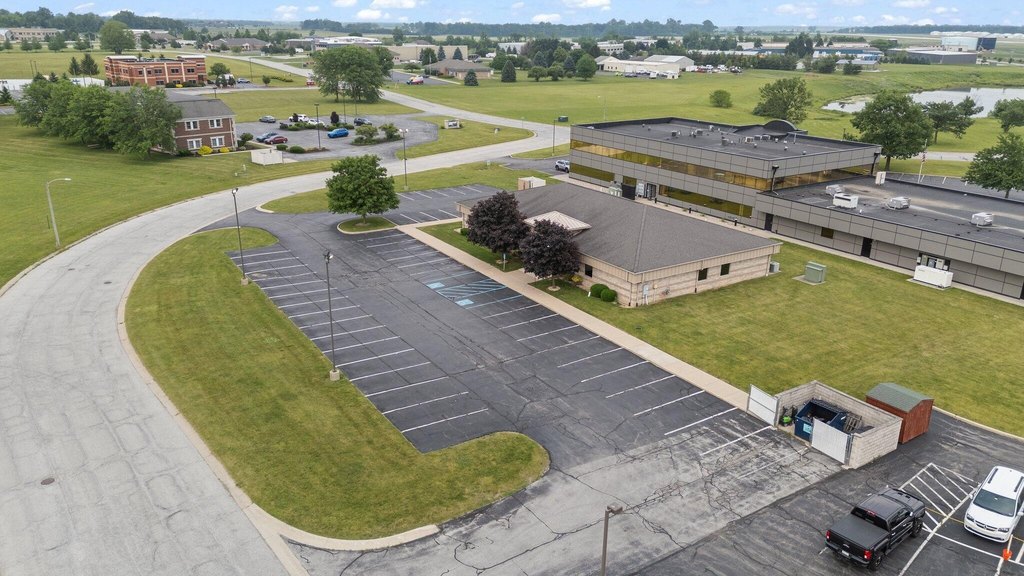
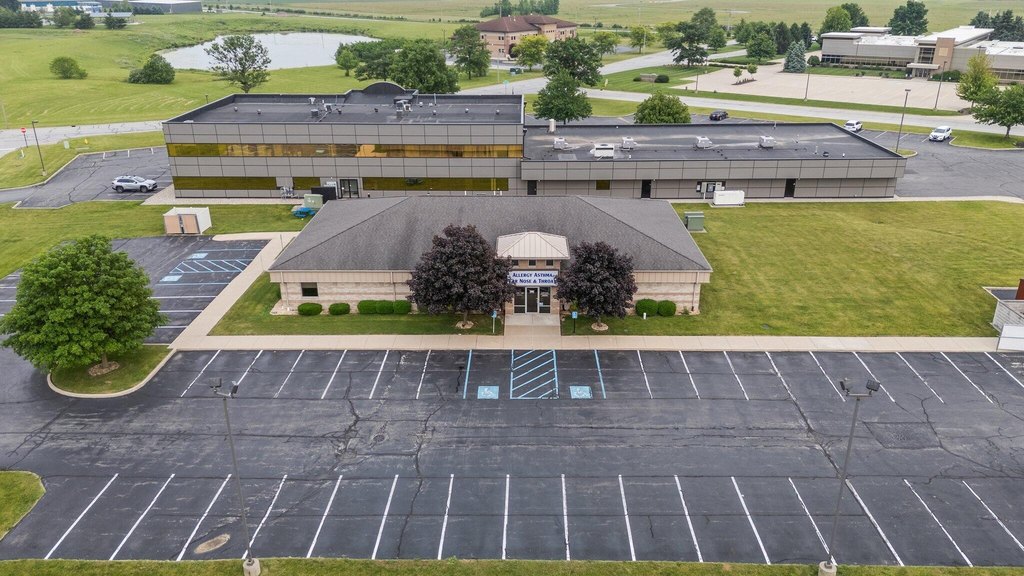
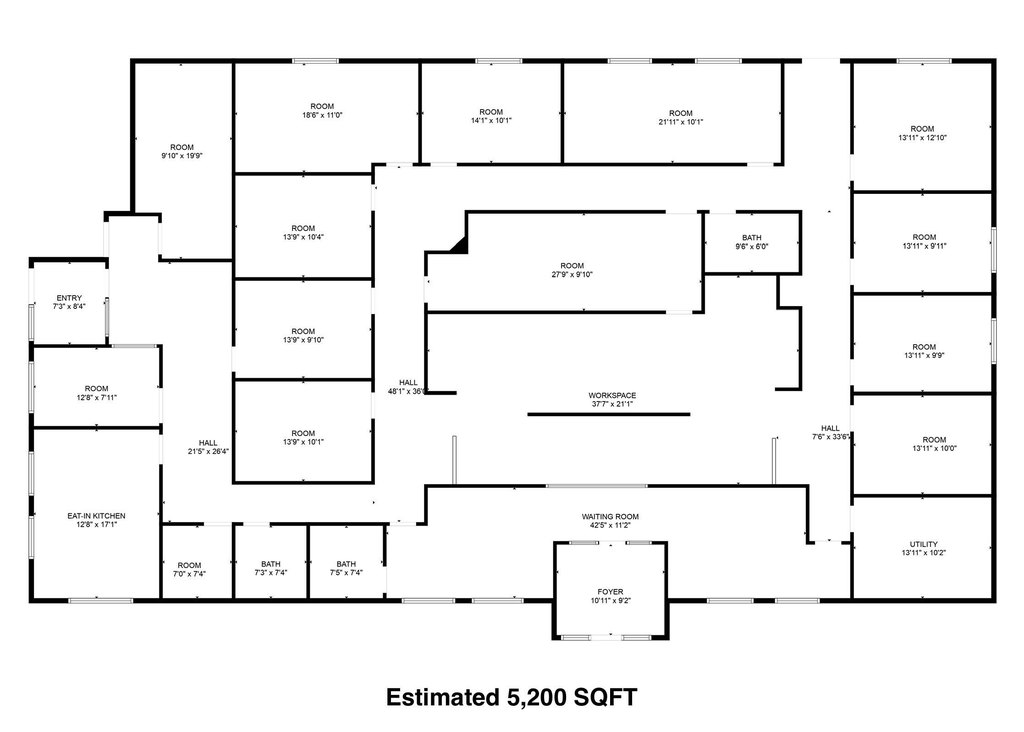
This single-story all-brick medical office building offers approximately 5,596 square feet on 1.05 acres. The interior includes a waiting room, two receptionist/workspace areas, 10 exam rooms, and a large private office/conference room. In addition, there are three bathrooms, a large kitchenette, three storage rooms, and a dedicated utility room. The property notes that the interior walls are not load bearing, which may allow for reconfiguration to better suit different healthcare or office layouts.
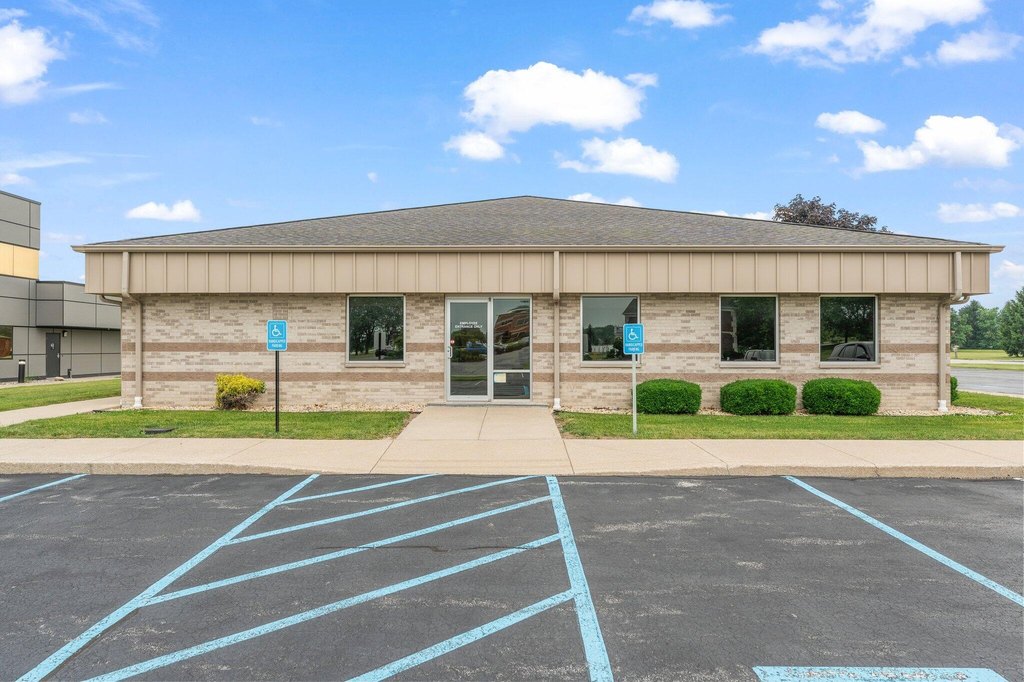
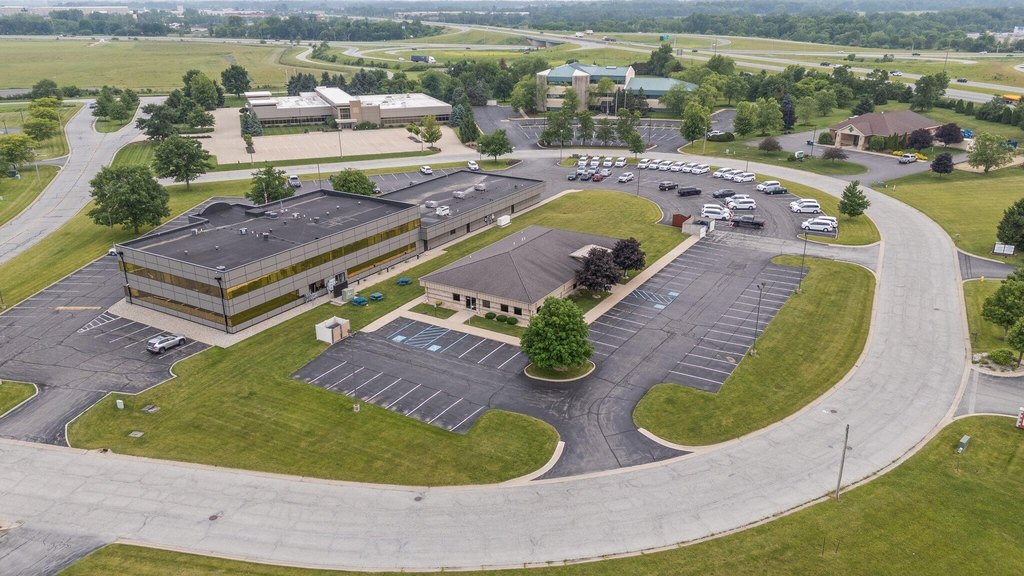
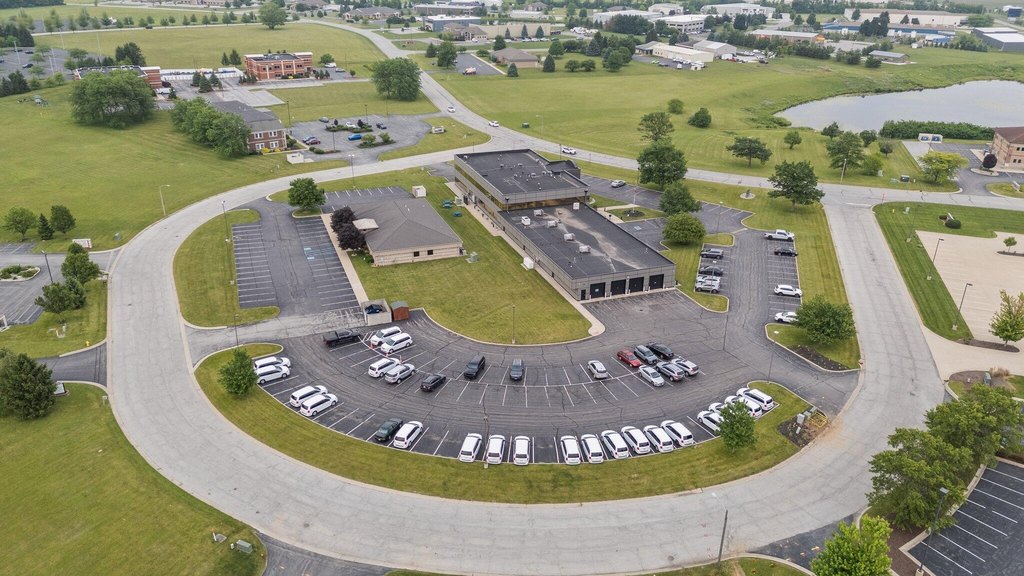
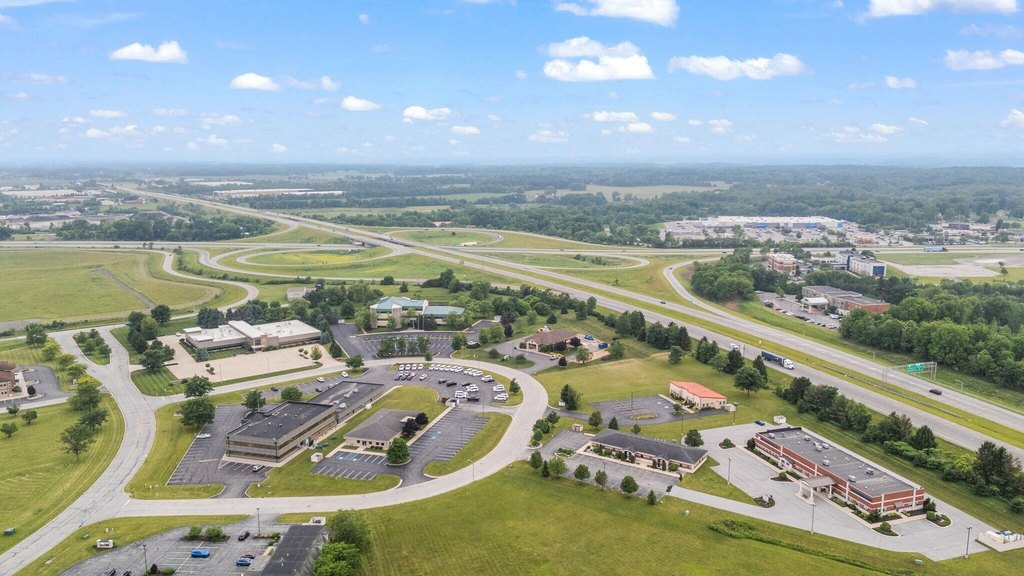
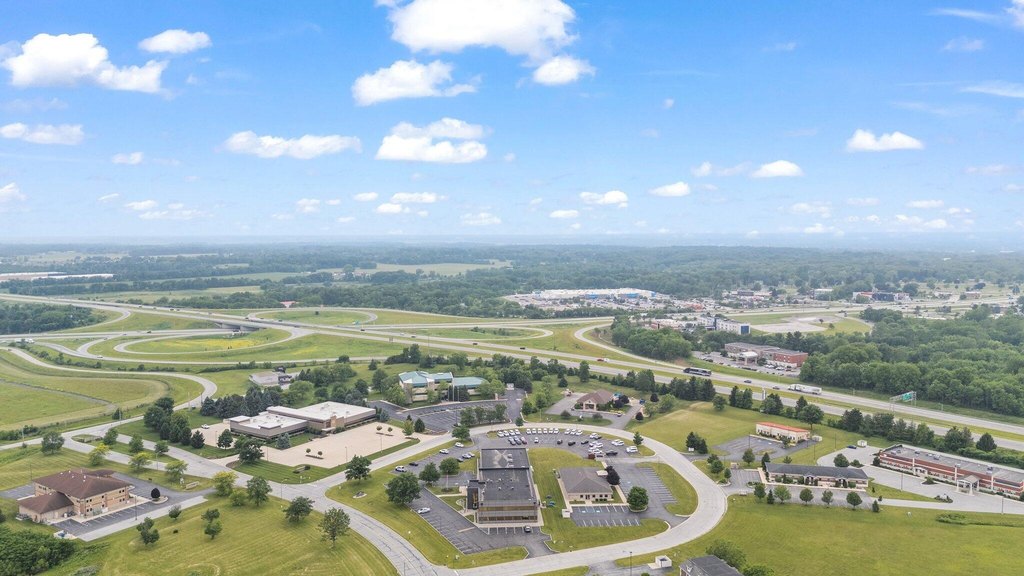
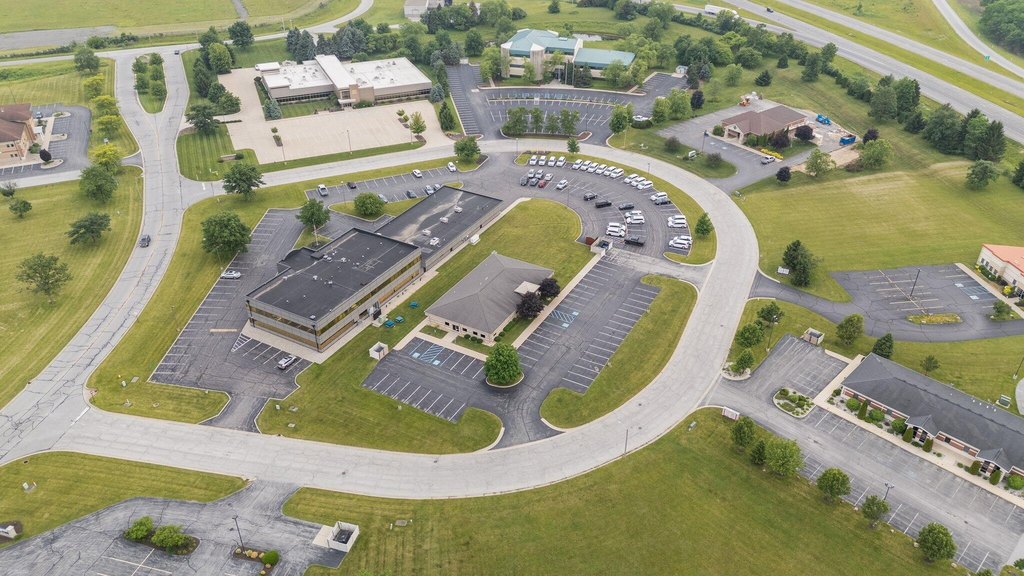
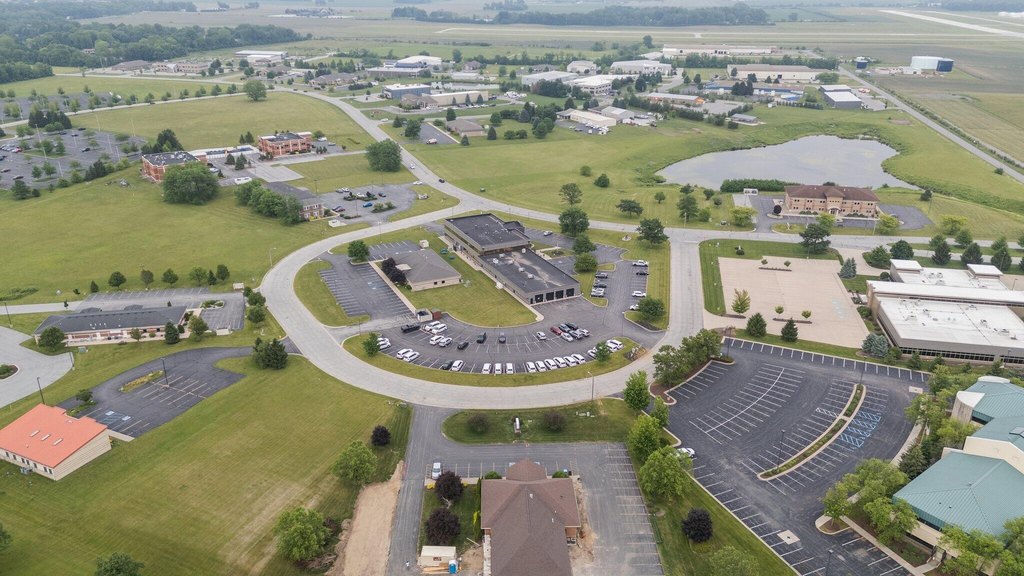
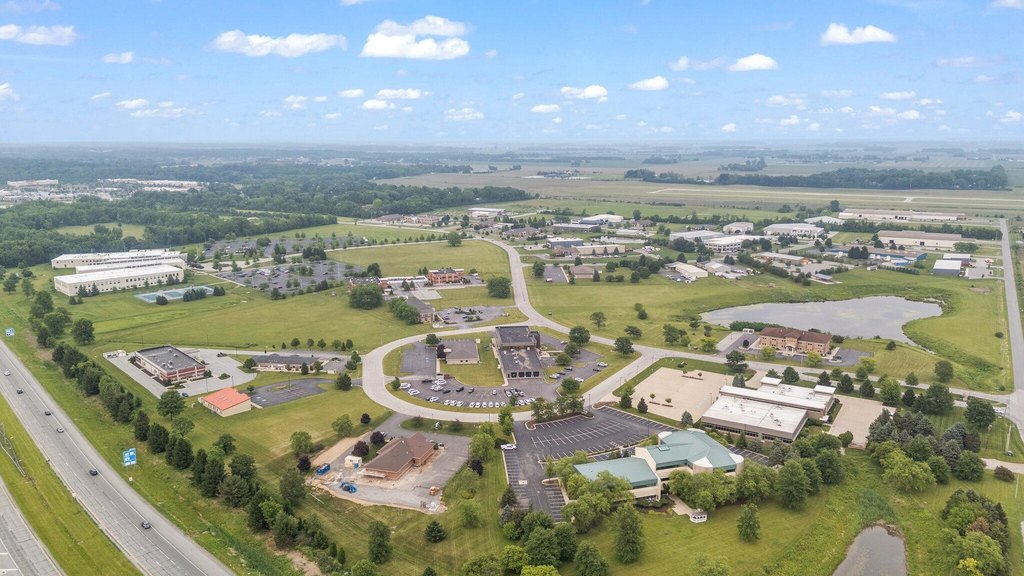
The building is located in Valparaiso’s Eastport Center Commercial Park, about 1.5 miles from the intersection of Route 30 and State Road 49. It has direct visibility from State Road 49, supporting convenient wayfinding for patients and visitors. Parking is available for 50 vehicles, which can help accommodate staff and appointment traffic.
Designed around clinical use, the existing room count and supporting spaces make it a practical fit for medical practices needing exam and support areas within one level. For buyers or operators considering change, the mention of non-load-bearing walls provides flexibility to adapt the floor plan for alternative uses that remain consistent with the building’s established infrastructure and site parking.
The building is located in Valparaiso’s Eastport Center Commercial Park, about 1.5 miles from the intersection of Route 30 and State Road 49. It has direct visibility from State Road 49, supporting convenient wayfinding for patients and visitors. Parking is available for 50 vehicles, which can help accommodate staff and appointment traffic.
Designed around clinical use, the existing room count and supporting spaces make it a practical fit for medical practices needing exam and support areas within one level. For buyers or operators considering change, the mention of non-load-bearing walls provides flexibility to adapt the floor plan for alternative uses that remain consistent with the building’s established infrastructure and site parking.
Key Highlights
- High‑visibility location on St. Rd. 49 in Valparaiso's Eastport Center Commercial Park.
- Large 5,500+ sq. ft. single‑story medical building.
- Ample parking with space for 50 cars.
Financial Insights For Office B
Simulate Cap Rate and NOI
NOI Build-Up
- Vacancy
- income lost from leasable area expected to sit empty during the year — subtracted from gross rent.
- EGI (Effective Gross Income)
- gross rent minus vacancy losses — the realistic income before paying operating costs.
- OpEx (Operating Expenses)
- recurring costs to operate the property (property tax, insurance, utilities, maintenance, management) — excludes financing and capital improvements.
- NOI (Net Operating Income)
- income a property generates after operating costs but before financing and taxes.
| Component | $ | $/SF |
|---|---|---|
| Gross rent | $95.4k | $17.04 |
| − Vacancy | −$5.7k | −$1.02 |
| EGI | $89.6k | $16.02 |
| − OpEx | −$22.4k | −$4.00 |
| NOI | $67.2k | $12.01 |
5,596 SF · lease $17.04/SF/yr · vacancy 6.00% · expense 25.00%
Alternative Uses
Best Use
Healthcare Medical
$2.12M
$1.86M – $2.47M
NOI $148,465 @ 7.0% cap · market cap 15.63%
Second Best
Office B
$960.4K
$840.3K – $1.12M
NOI $67,226 @ 7.0% cap · market cap 7.08%
Theoretical Best
—
—
same as Best Use
Zoning and permitted uses should be independently verified with authorities.
Property Analytics
Property Profile
Location Intelligence
Current Use




Similar Off Market Nearby
- Dr. Christopher Keeley — 1259 Sturdy Rd, Valparaiso, IN 46383
- McAfee Animal Hospital — 651 Eastport Center Dr, Valparaiso, IN 46383
- Mc Afee Animal Hospital: Hargarten Andrea DVM — 651 Eastport Center Dr, Valparaiso, IN 46383
- Dr. Steve Violanti — 651 Eastport Center Dr, Valparaiso, IN 46383
- Rafols Danielle DVM — 651 Eastport Center Dr, Valparaiso, IN 46383
Frequently Asked Questions
What type of property is this?
Medical Office Space - All-brick medical facility with 10 exam rooms, parking for 50, and potential interior reconfiguration.
Where is this medical office space located?
The property is located at 2802 Leonard Drive Valparaiso, IN.
What is the asking price?
The asking price for this property is $950,000.
What are key features of this property?
This property features: High‑visibility location on St. Rd. 49 in Valparaiso's Eastport Center Commercial Park.; Large 5,500+ sq. ft. single‑story medical building.; Ample parking with space for 50 cars.