Mixed-Use Property with Treatment
For Sale
$372,500
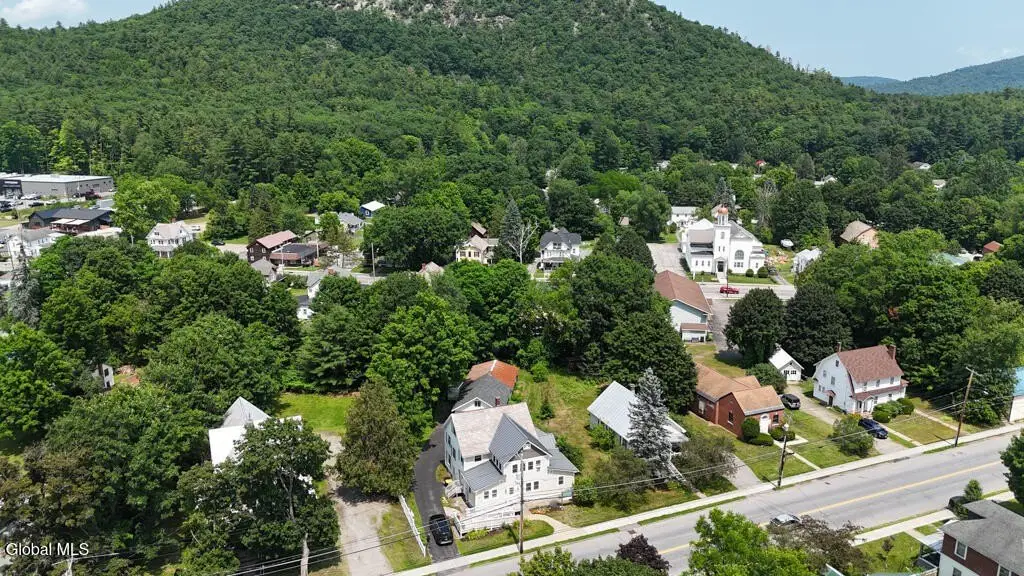
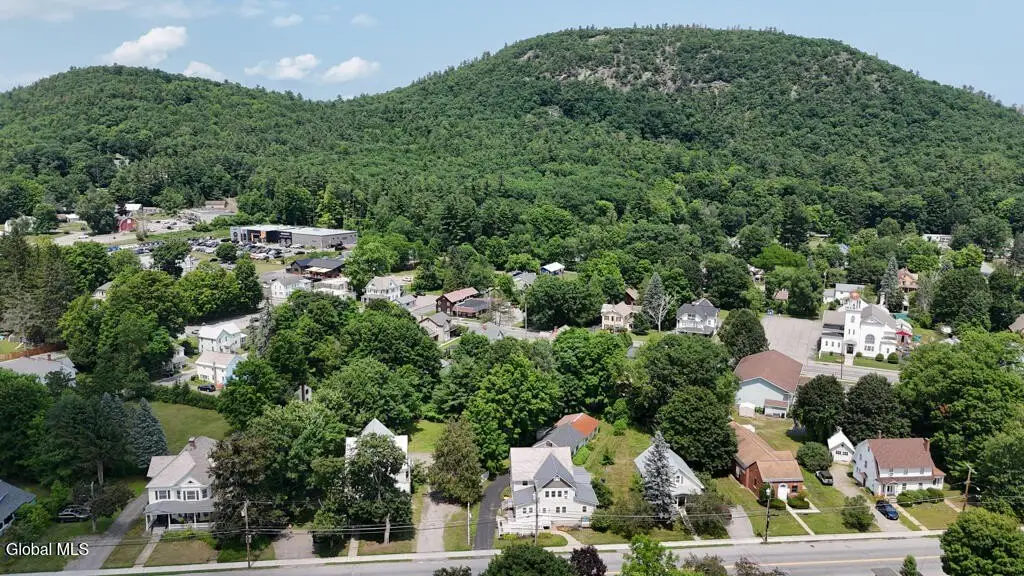
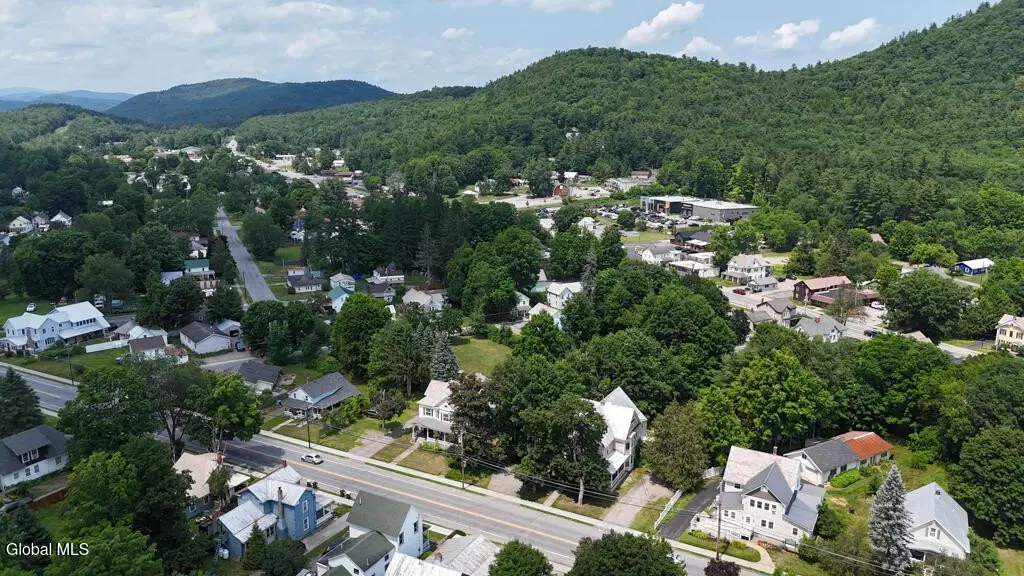
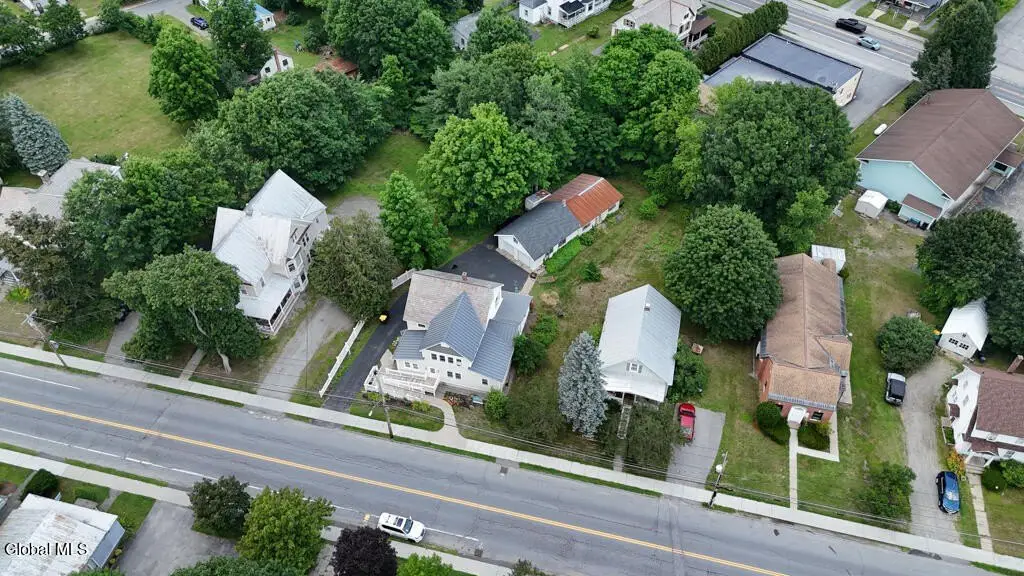
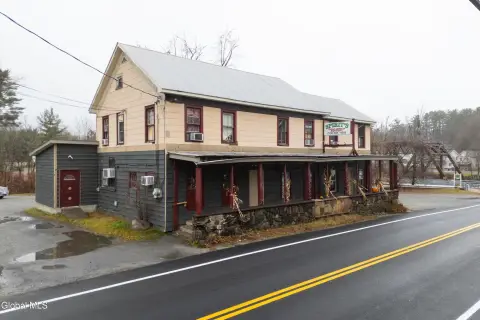
28 Hudson Street, Warrensburg, NY 12885
Commercial Sale, Warrensburg, NY
Property Size3,022 SF
Lot Size0.27 Acres
Price / SF$123.26
Days on Market92
Property Features for 28 Hudson Street
General Information
Property type
Commercial Sale
Property subtype
Other
Zoning
Mixed
Bathrooms
2
Full bathrooms
2
Rooms
Bathroom 2, Bathroom 1
Parking
8
Parking features
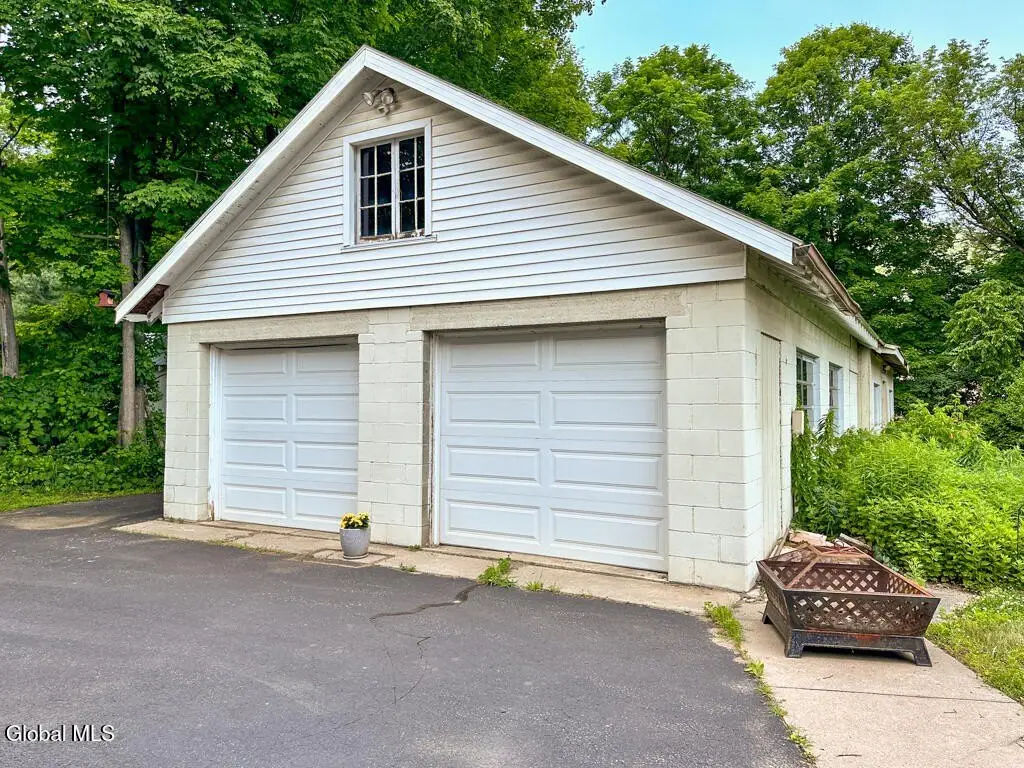
Garage, Off Street
Security features
Security System
Interior features
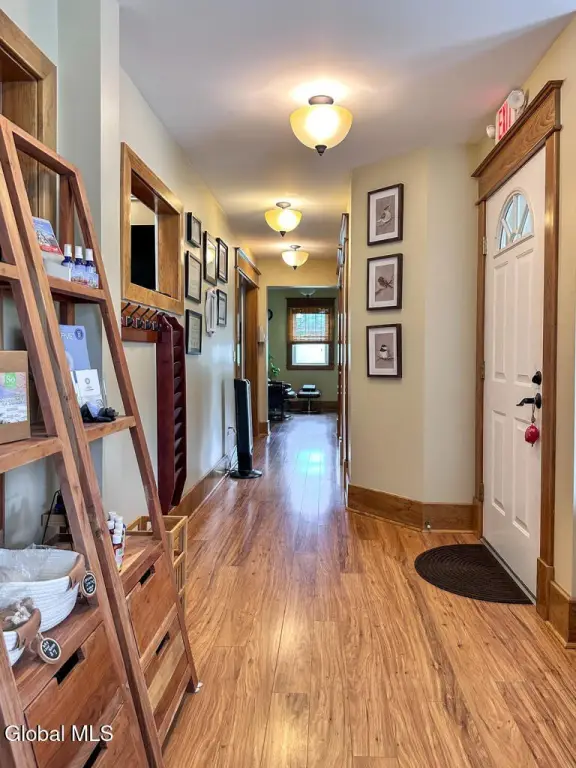
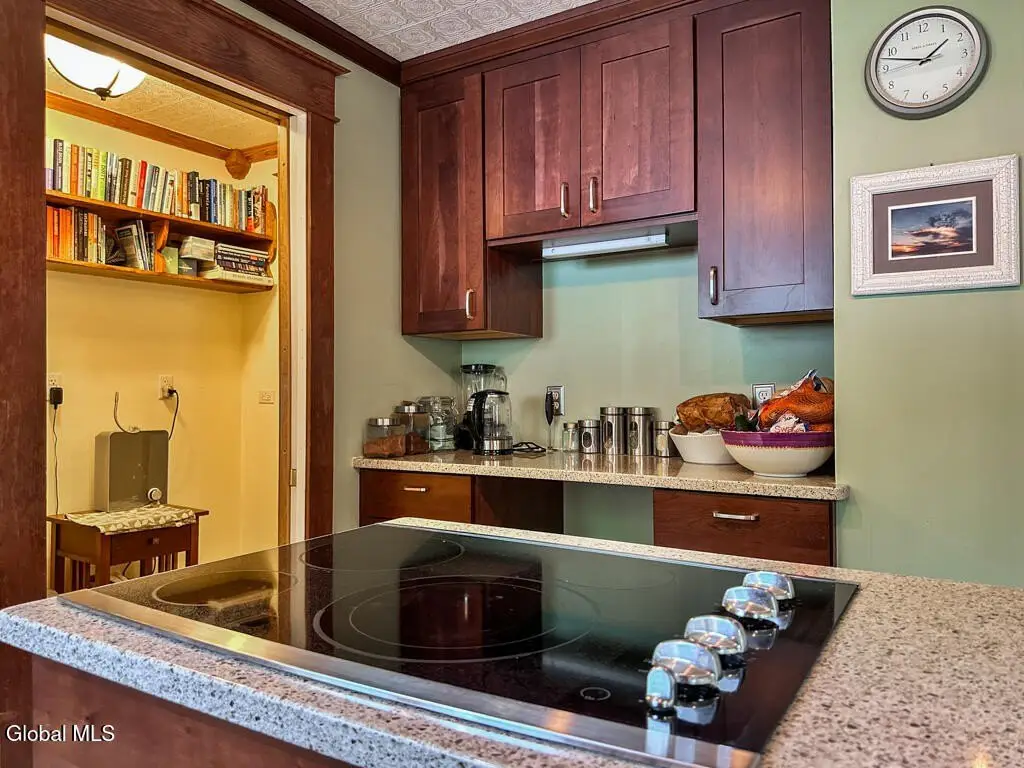
High Speed Internet, Solid Surface Counters, Built-in Features, Chair Rail, Crown Molding
Basement
Unfinished, Full, Interior Entry
Accessibility
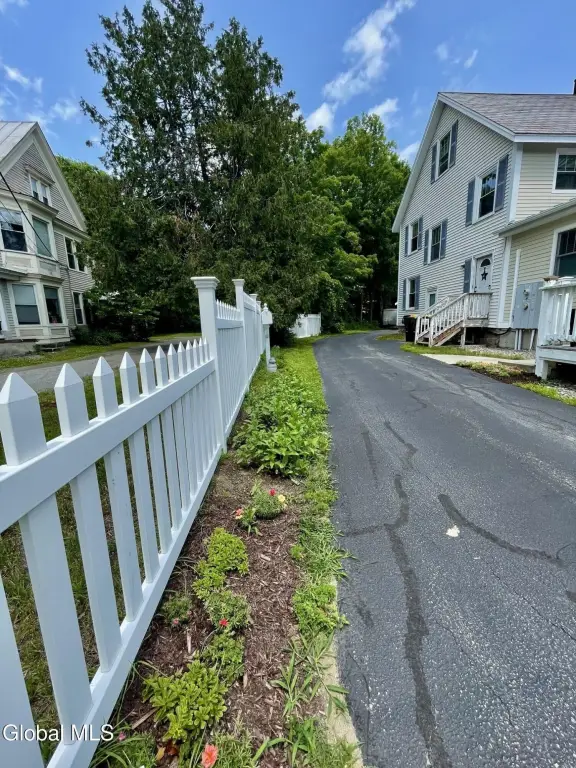
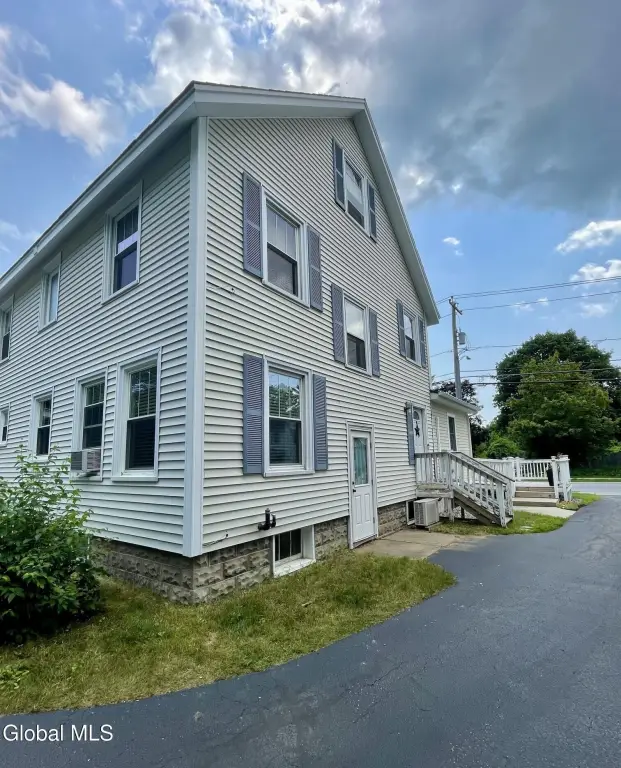
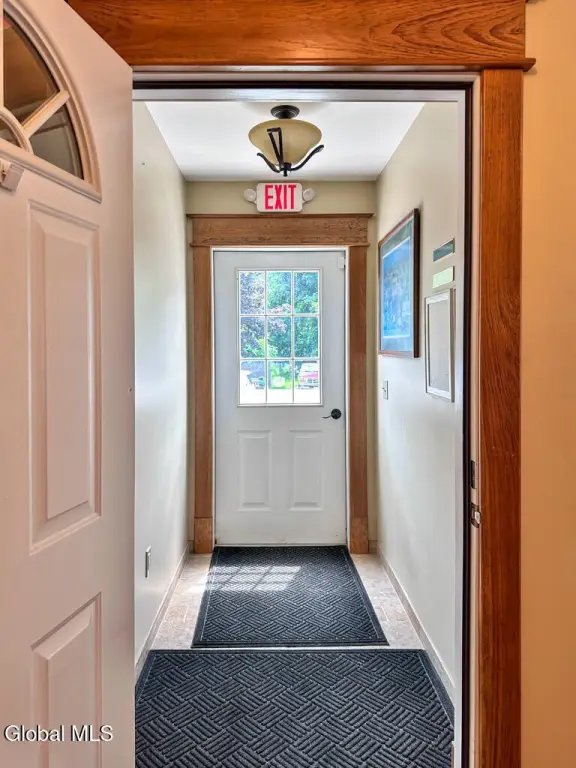
Accessible Approach with Ramp
Lot features
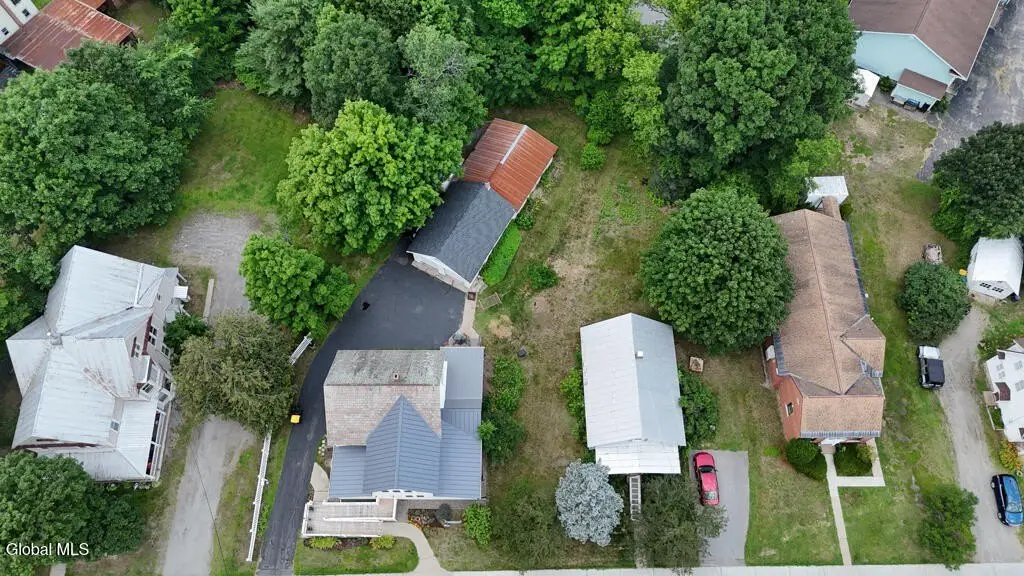
Road Frontage, Level, Cleared, Garden, Irregular Lot, Landscaped
Elementary school
Warrensburg
High school
Warrensburg
Elementary school district
Warrensburg
Middle school district
Warrensburg
High school district
Warrensburg
Directions
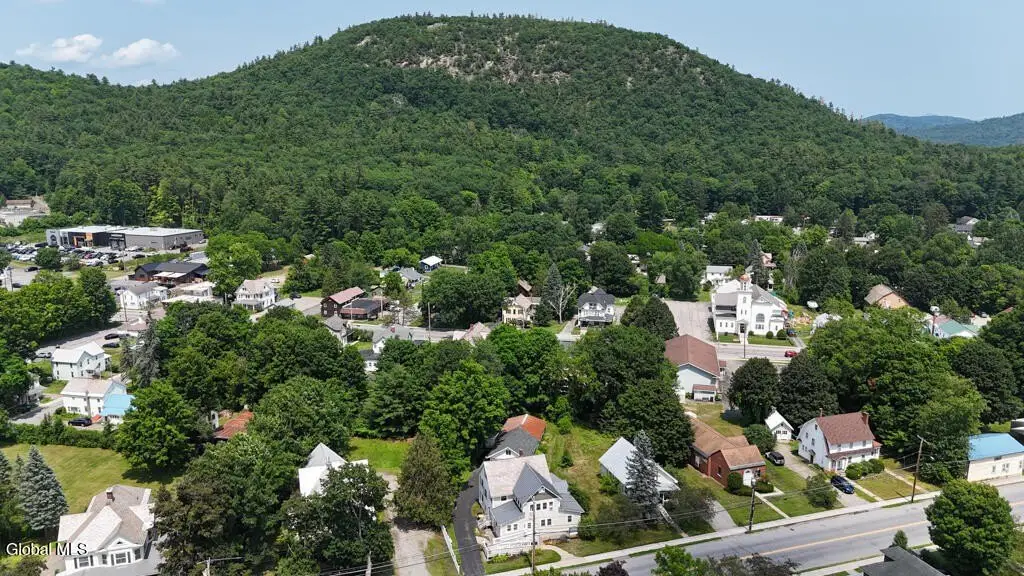
Northway to Exit 23 Warrensburg. Take Route 9 (Main Street) towards Warrensburg. Left at Hudson intersection ( CR-40) for 1/4 mile. Property on right and has a sign.
Standard status
Active
APN
524000 211.9-4-18
Size
3,022 SF
Lot size
0.27 Acres
Taxes and HOA fees
Tax Annual Amount
5146
Utilities
Sewer type
Public Sewer
Heating system
Zoned, Electric (Heating), Baseboard, Hot Water(Heating), Radiant
Cooling system
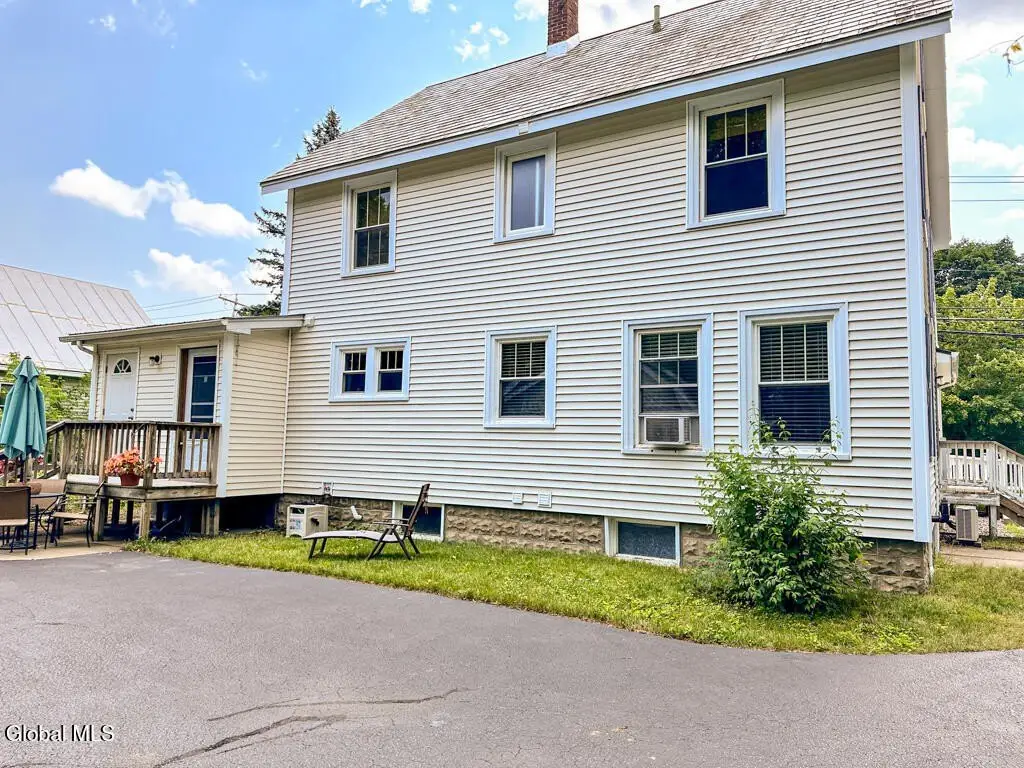
Ductless, Window Unit(s), Wall Unit(s)
Water source
Public
Building Details
Year built
1930
Floors in Building
3
Flooring type
Wood, Laminate, Hardwood, Tile
Building materials
Block, Drywall, Vinyl Siding
Roof type
Metal, Slate, Asphalt
Architectural style
Other
Additional Structures
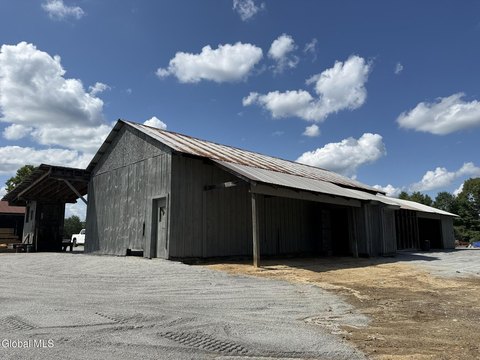
Workshop
Listing Agency:
Davies Davies & Associates Real Estate LLC
(518) 656-9068
Listed By:
Valerie Erceg · License #10401329957
(518) 361-2785
Added: Jul 6
Changed: Oct 2
Last Checked: Oct 5 at 6:06PM
MLS# 202621090
Copyright © 2026 Global MLS, Inc. All rights reserved. All information provided by the listing agent/broker is deemed reliable but is not guaranteed and should be independently verified.
Investment Insights
Based on property information with market context.
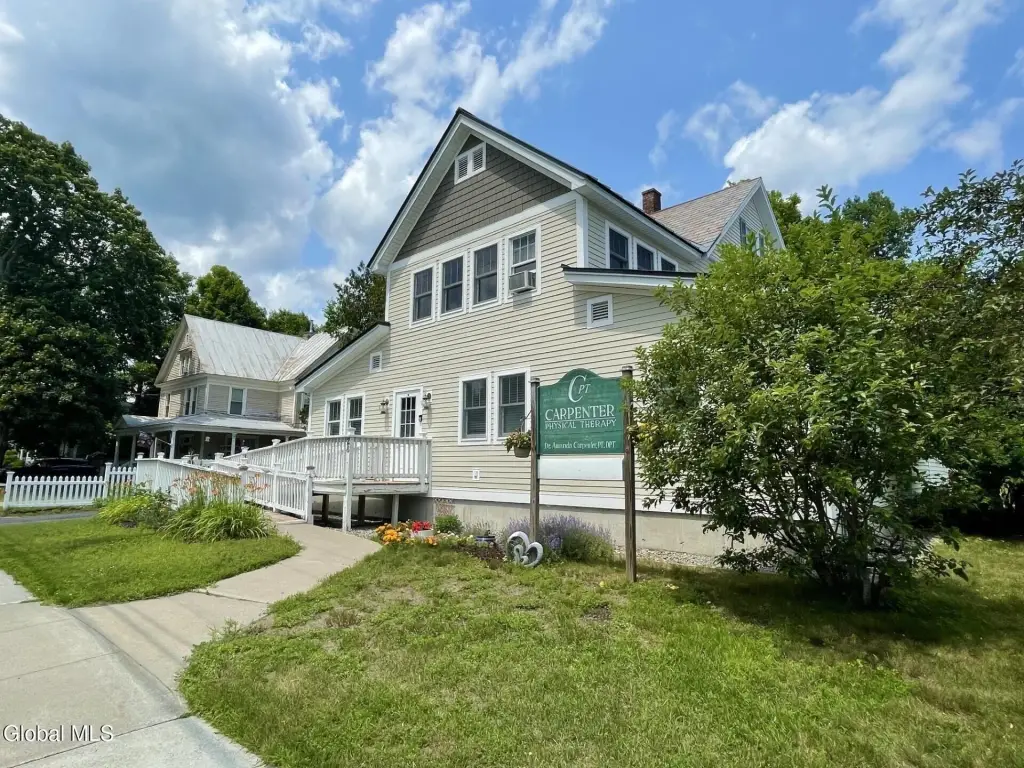
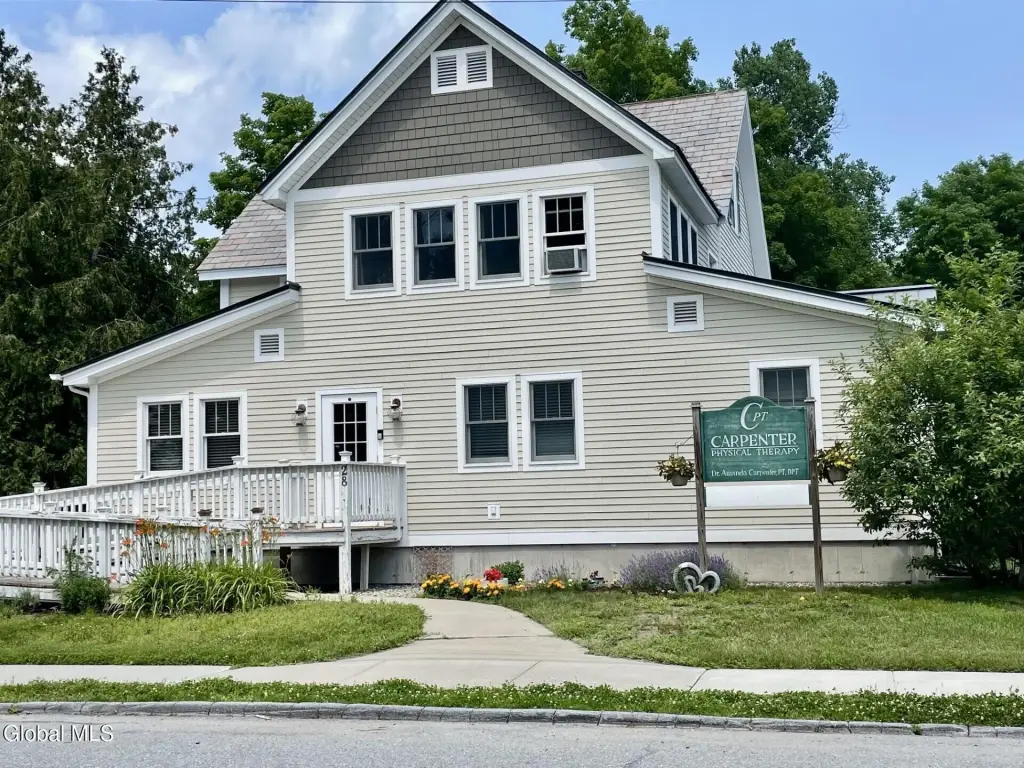
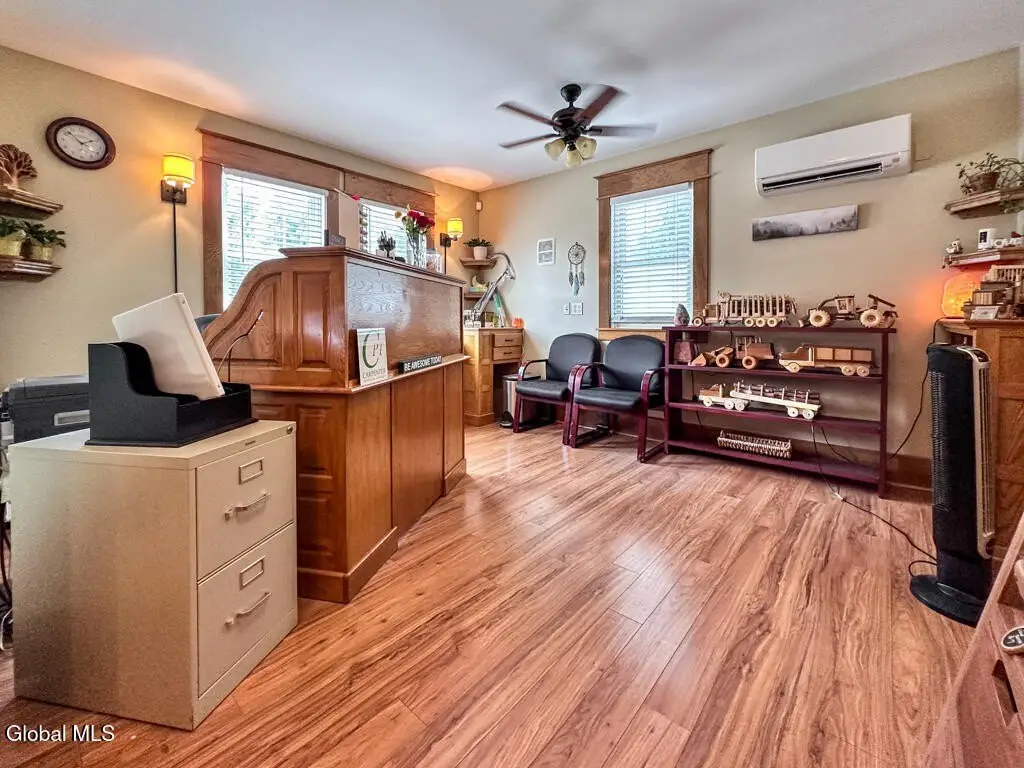
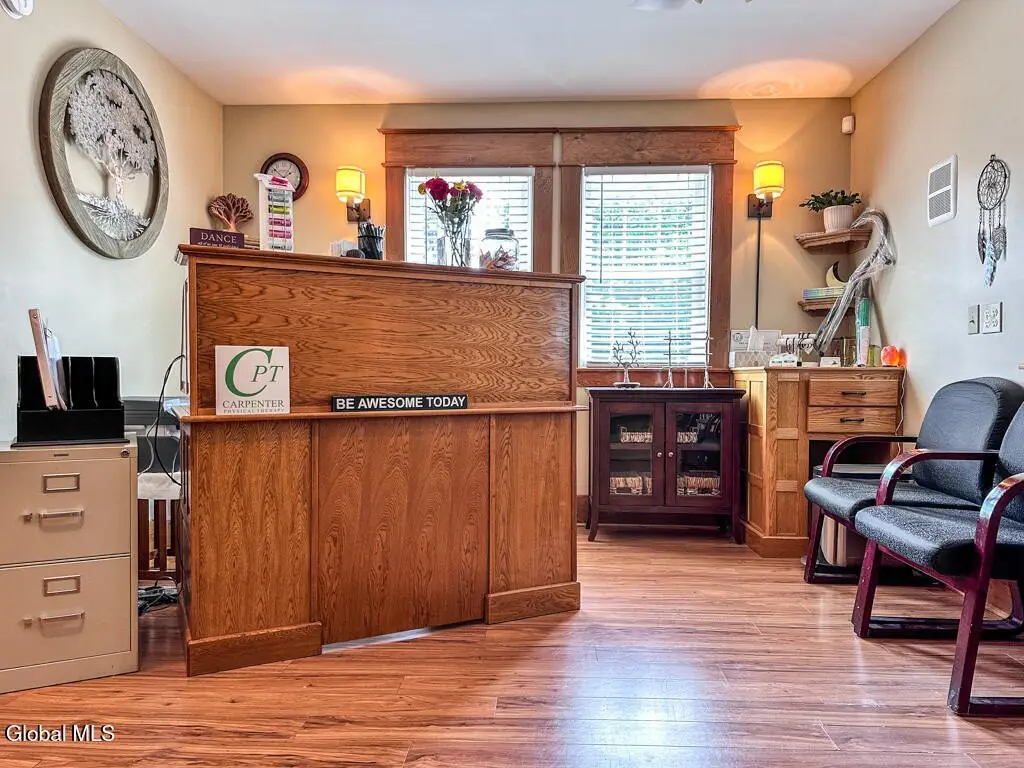
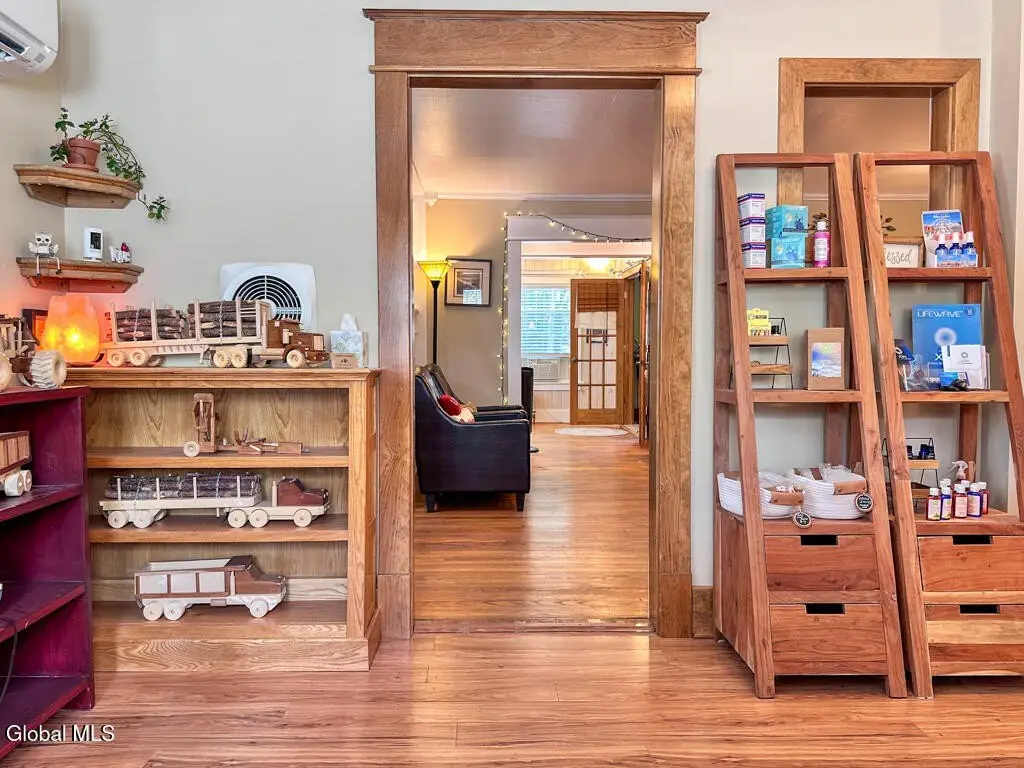
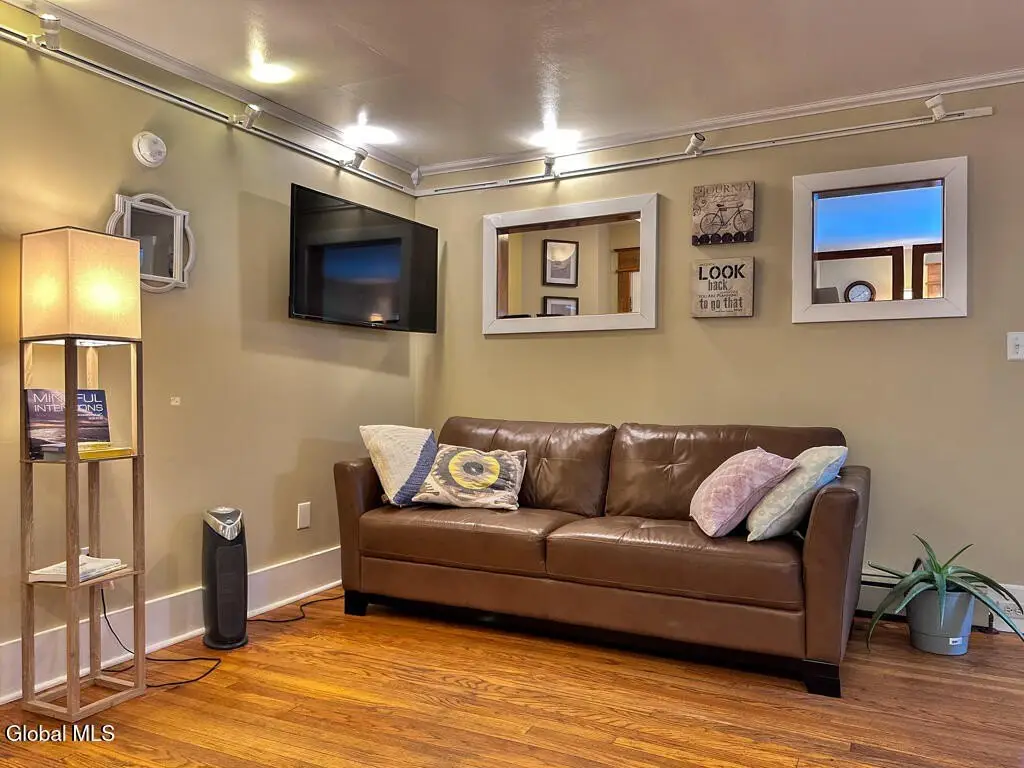
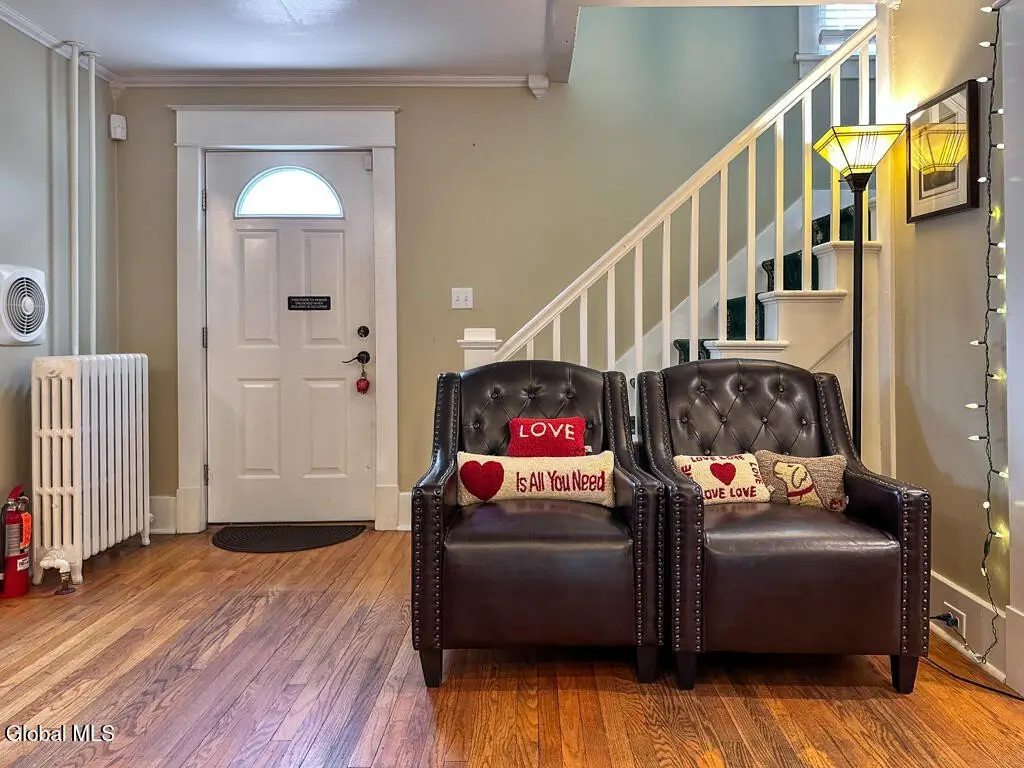
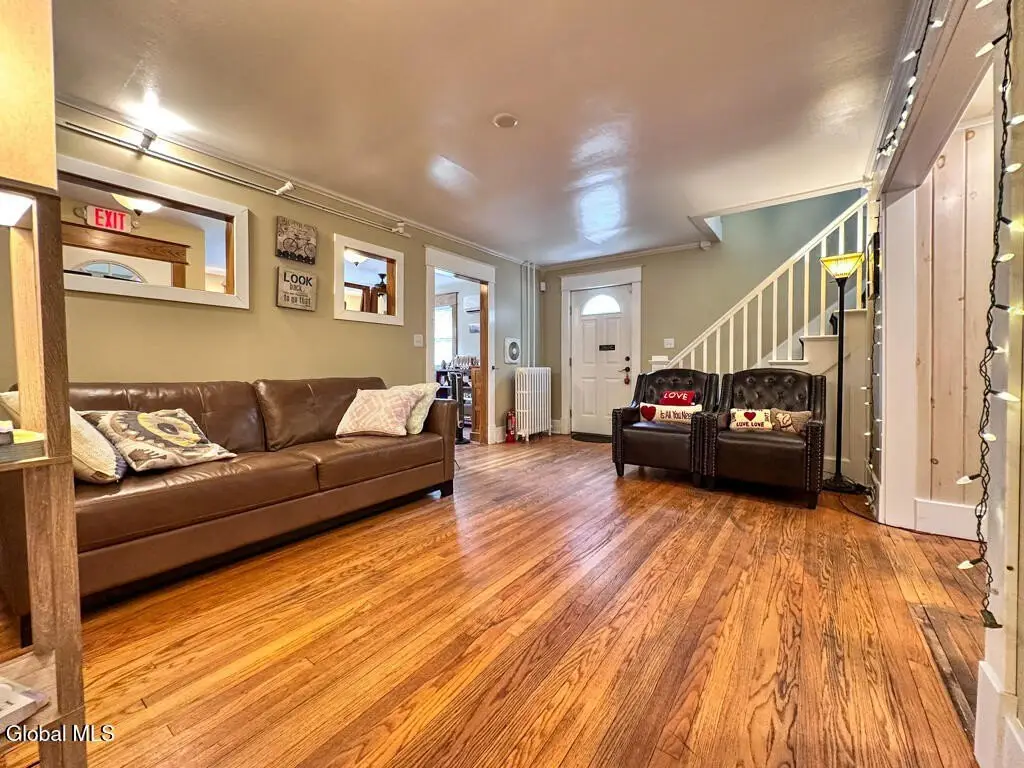
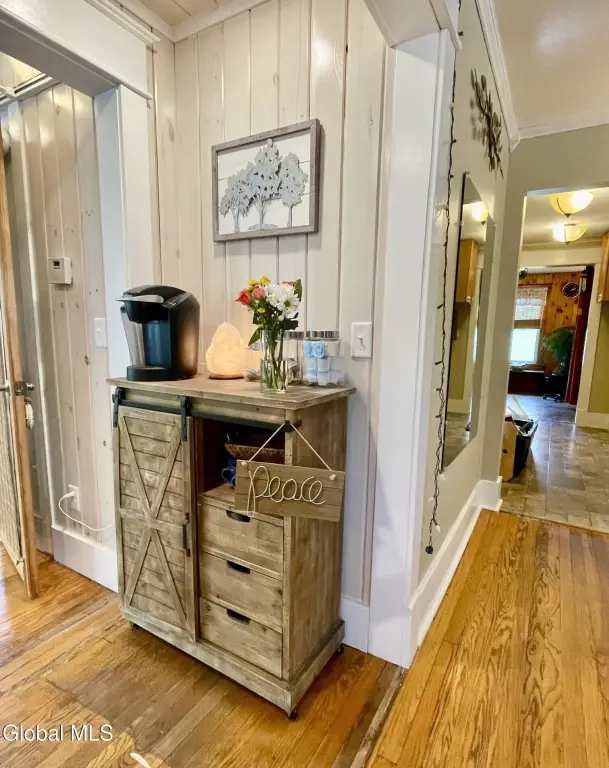
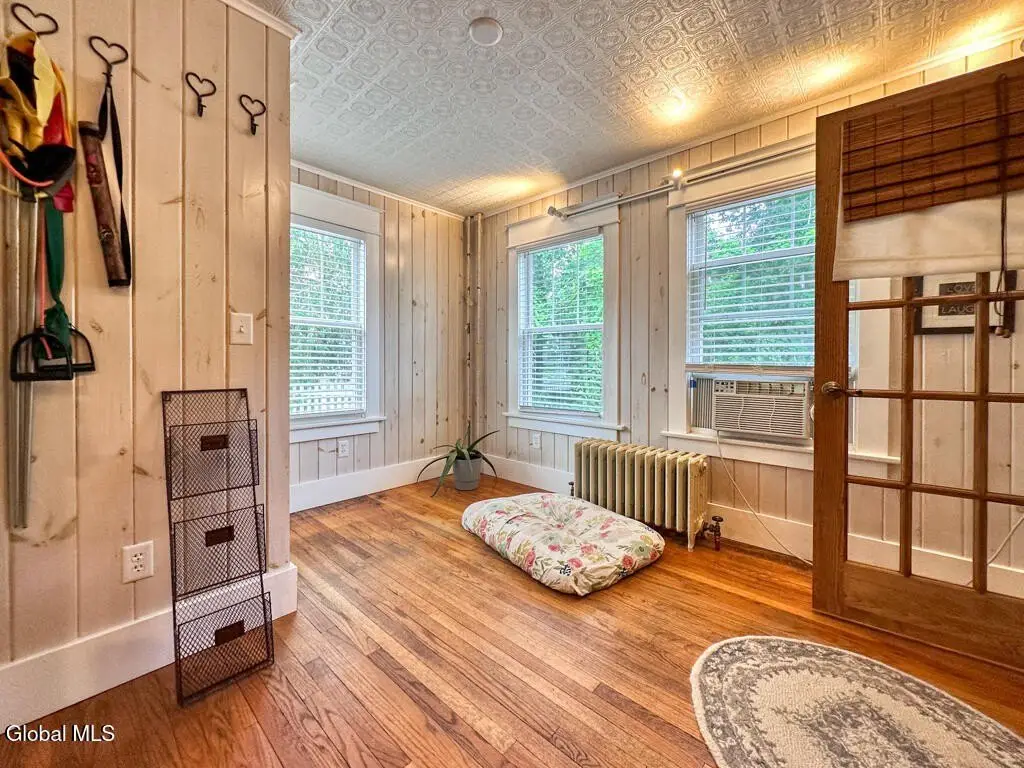
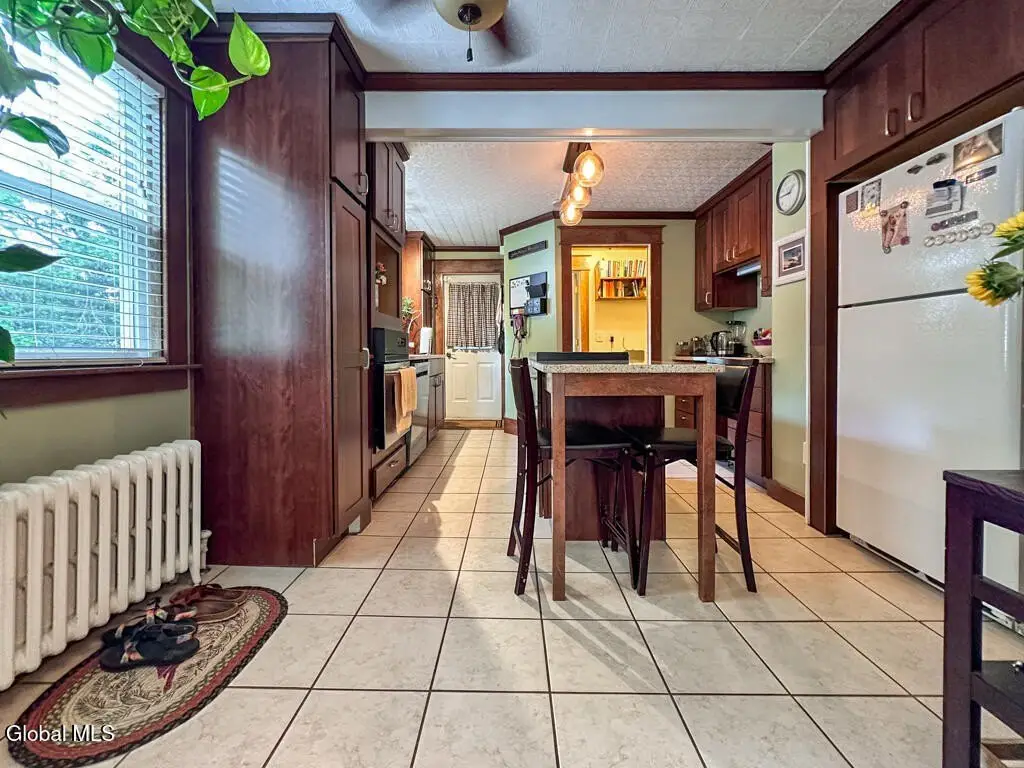
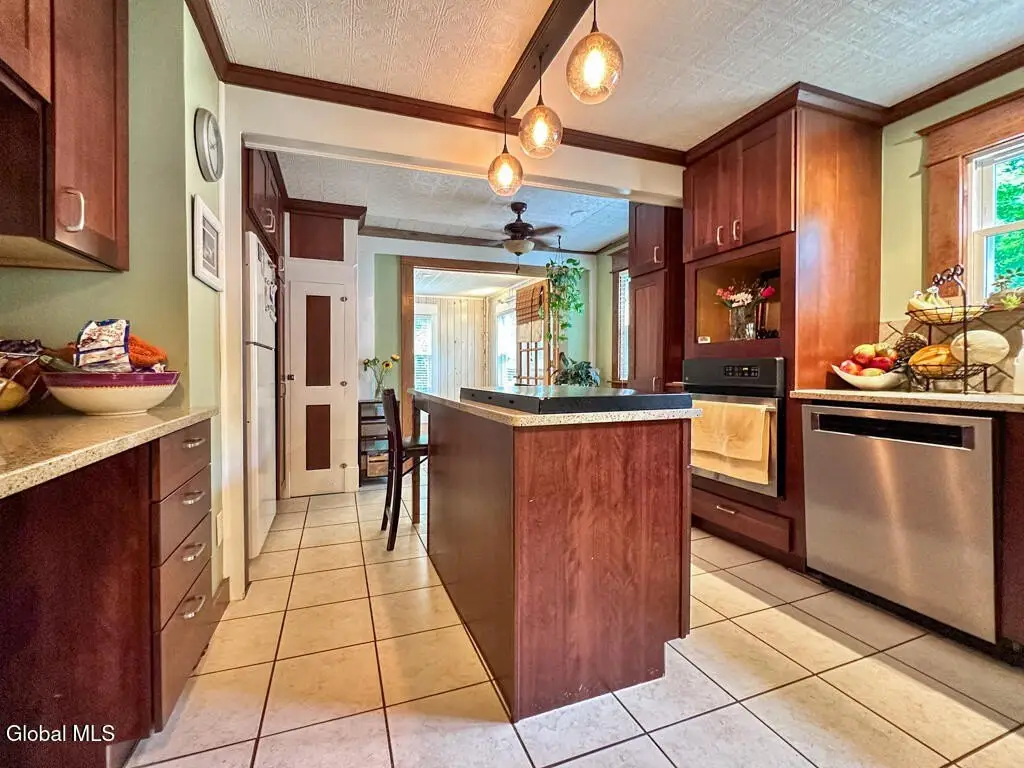
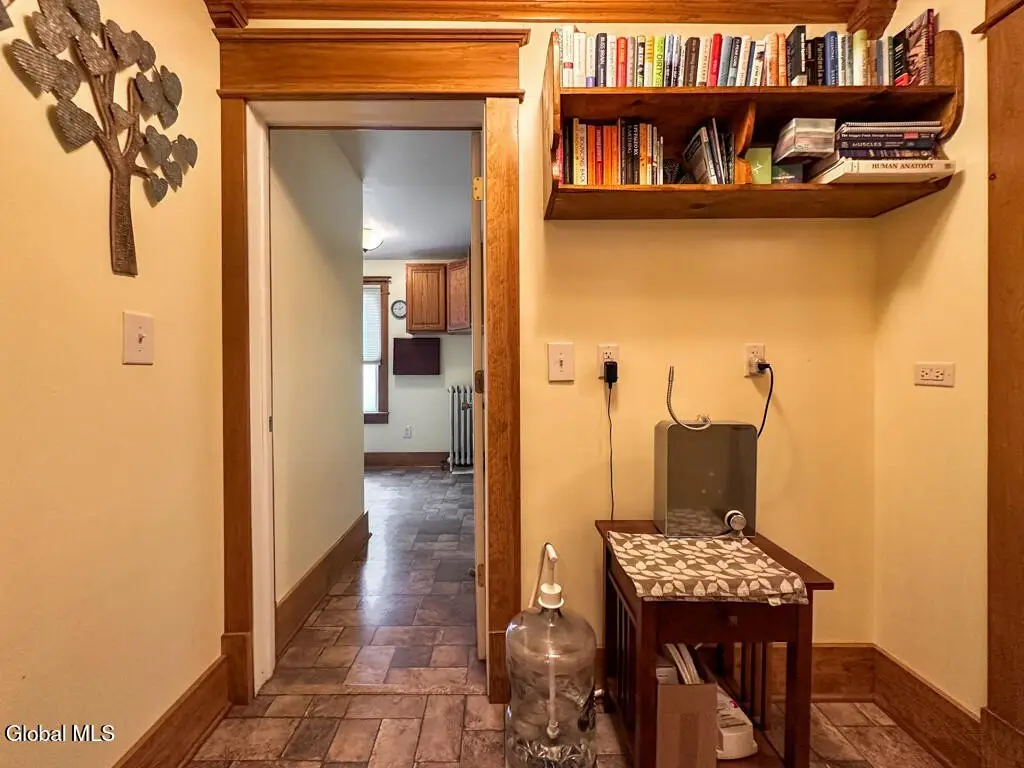
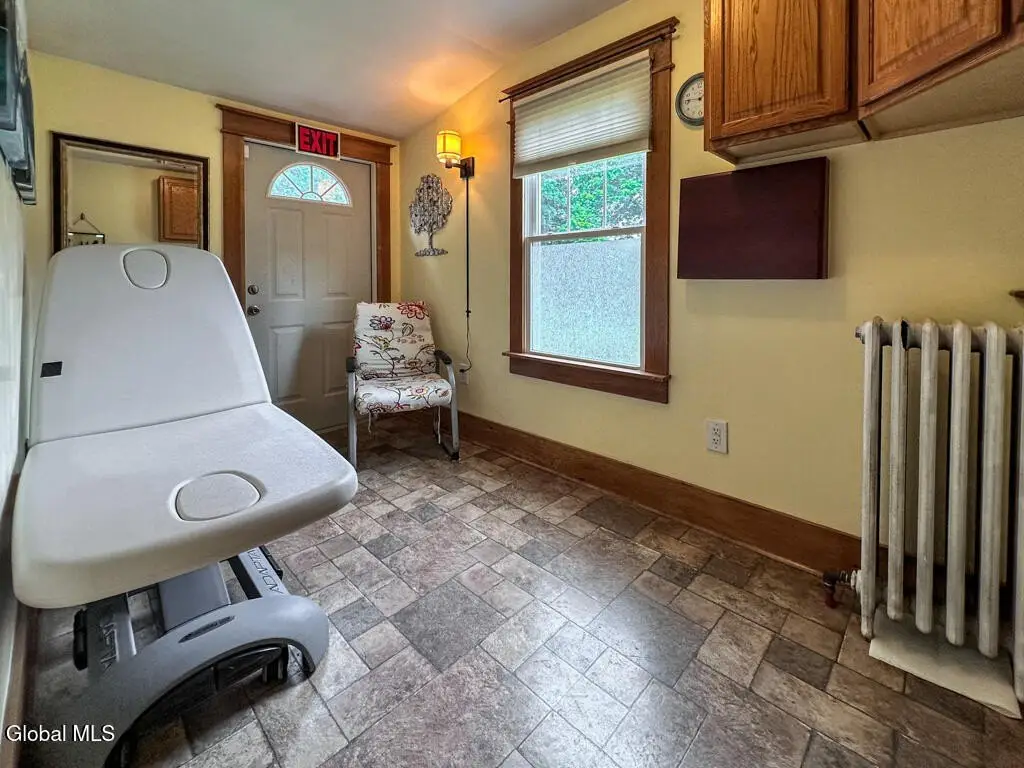
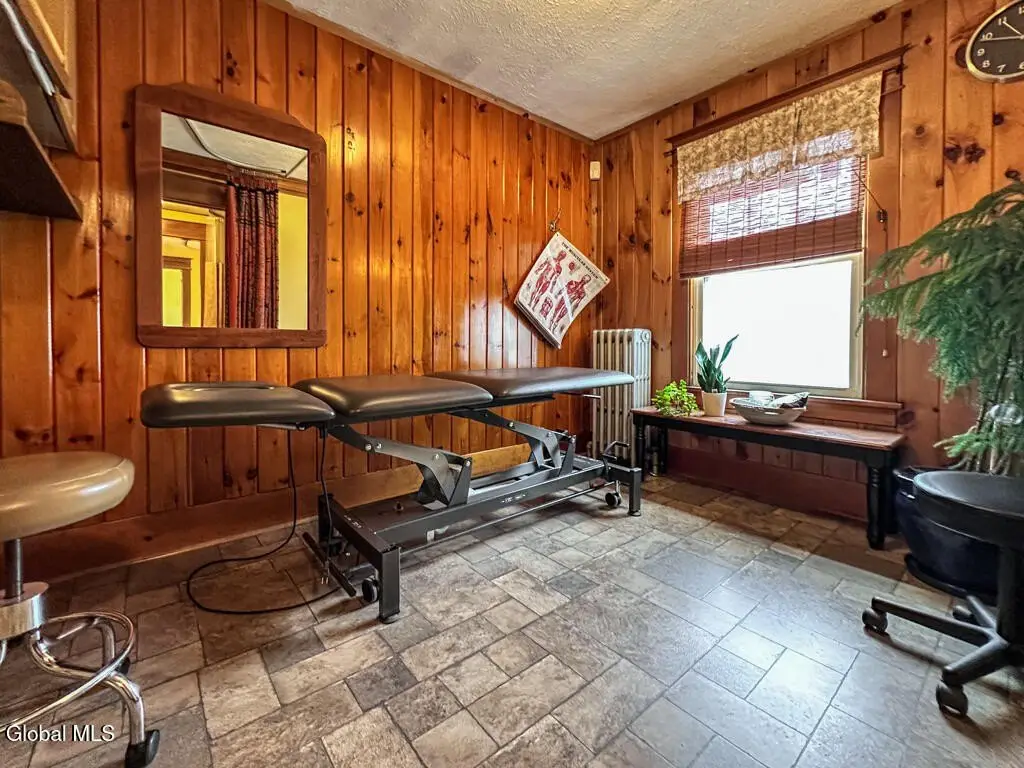
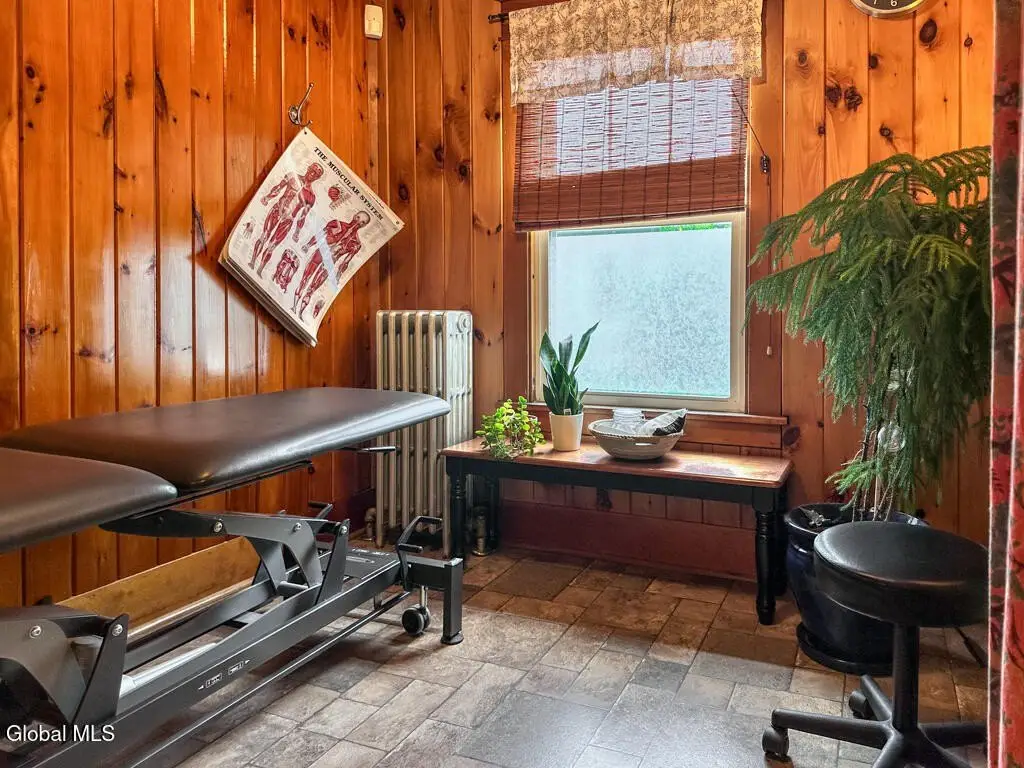
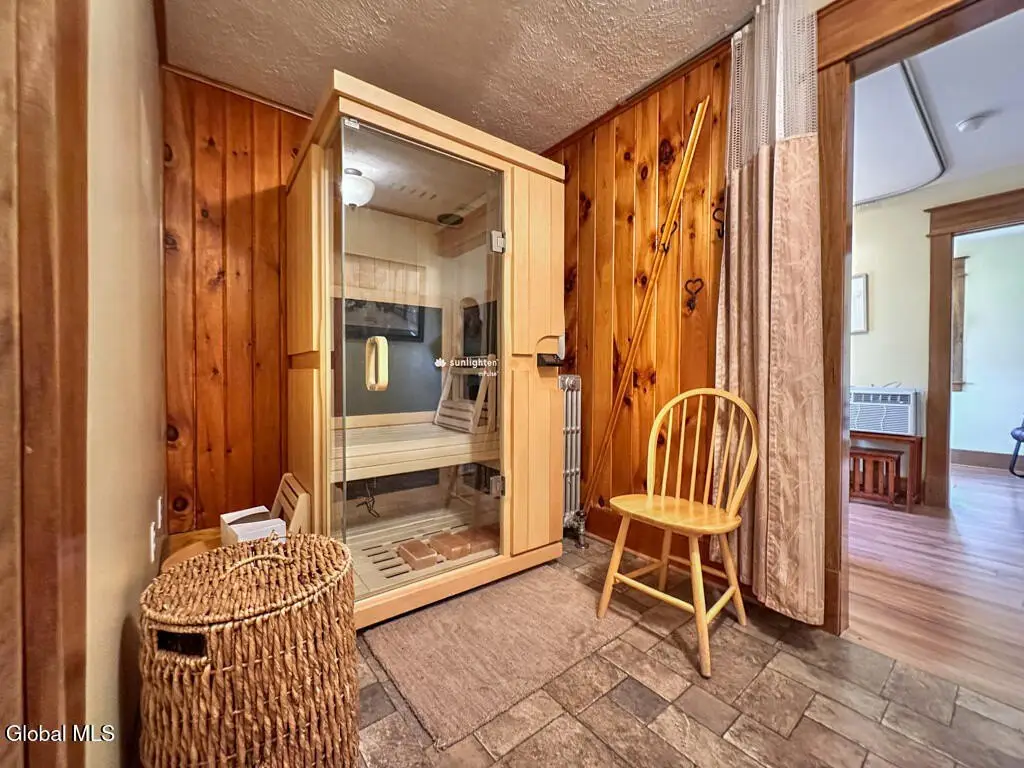
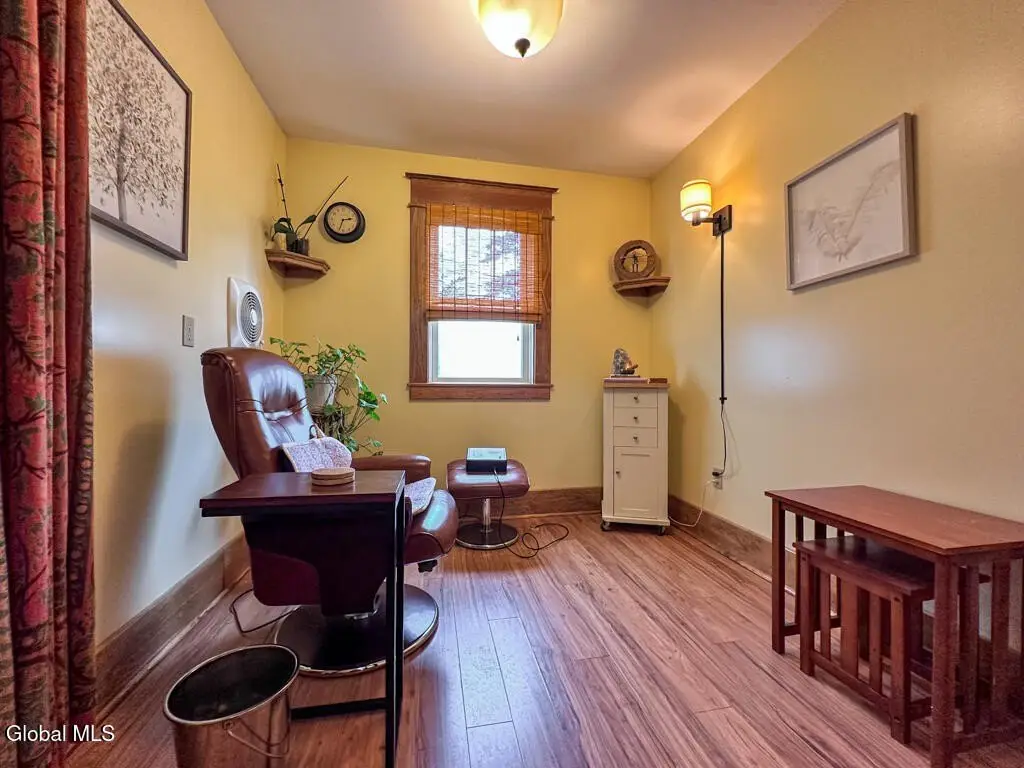
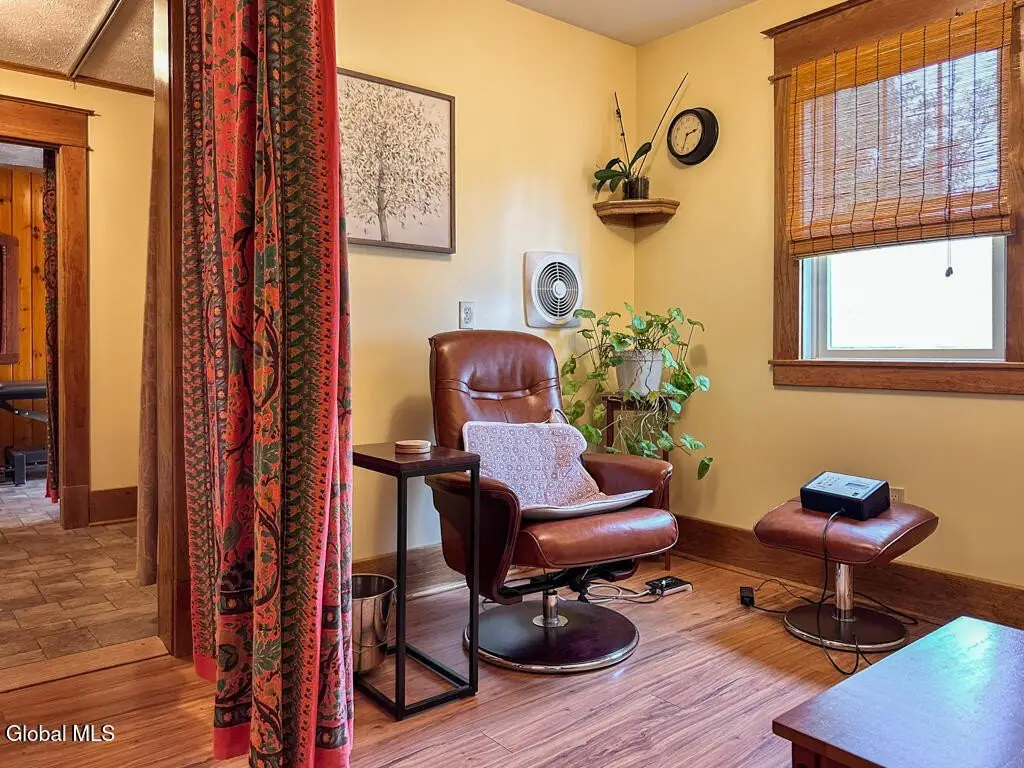
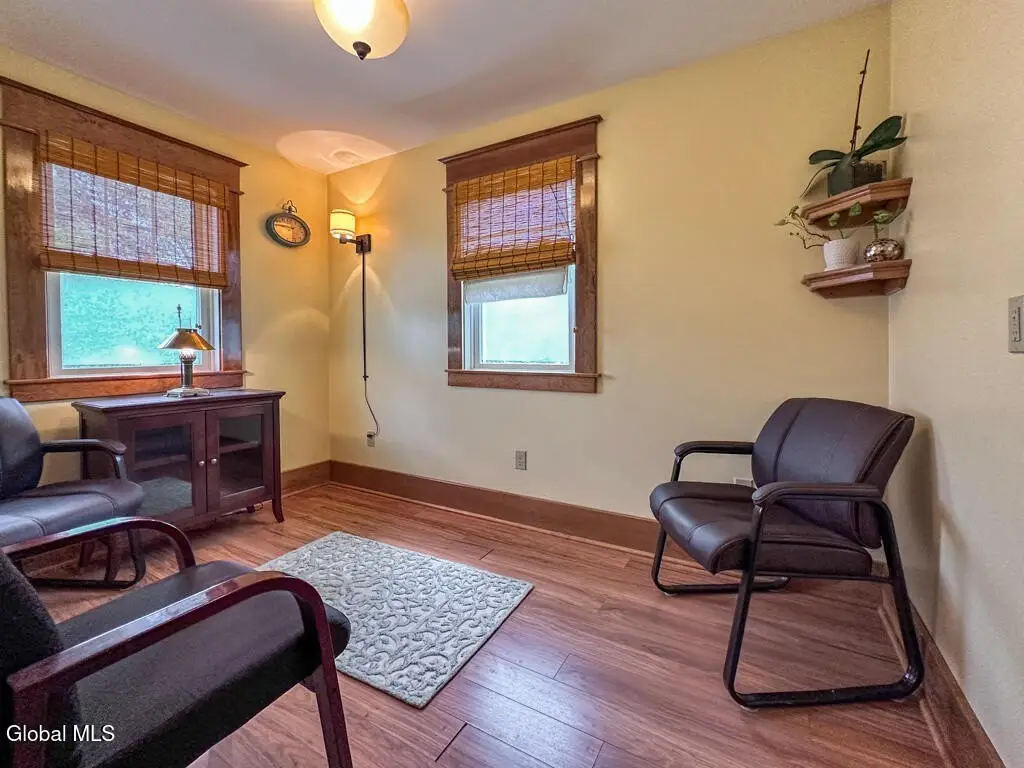
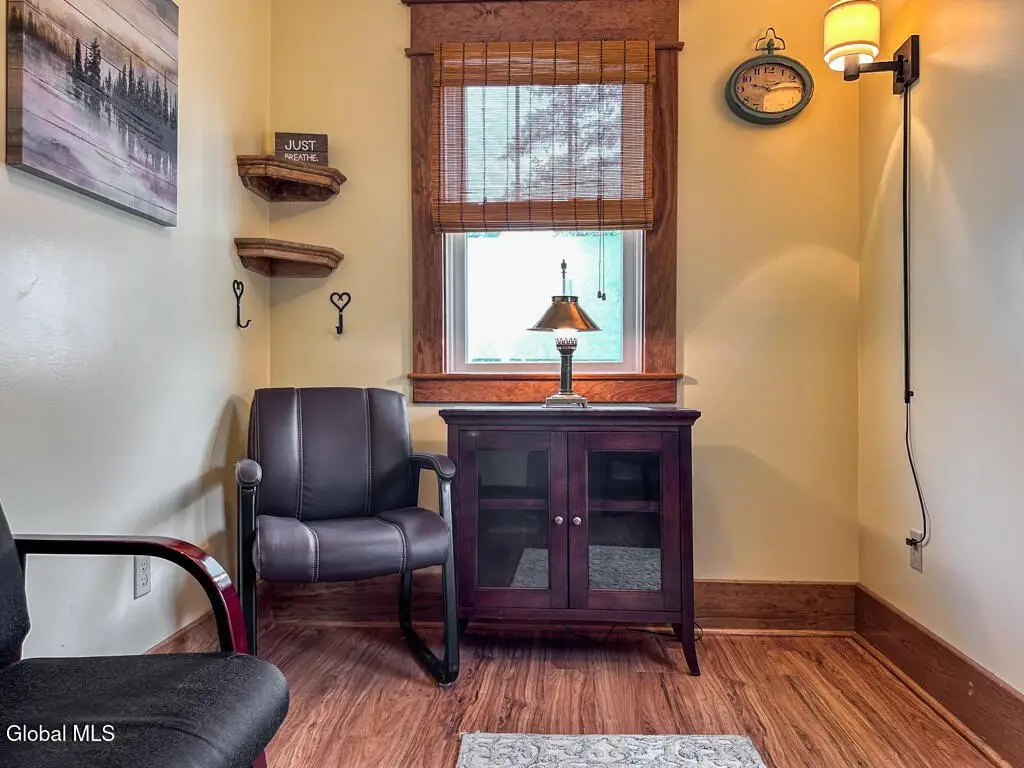
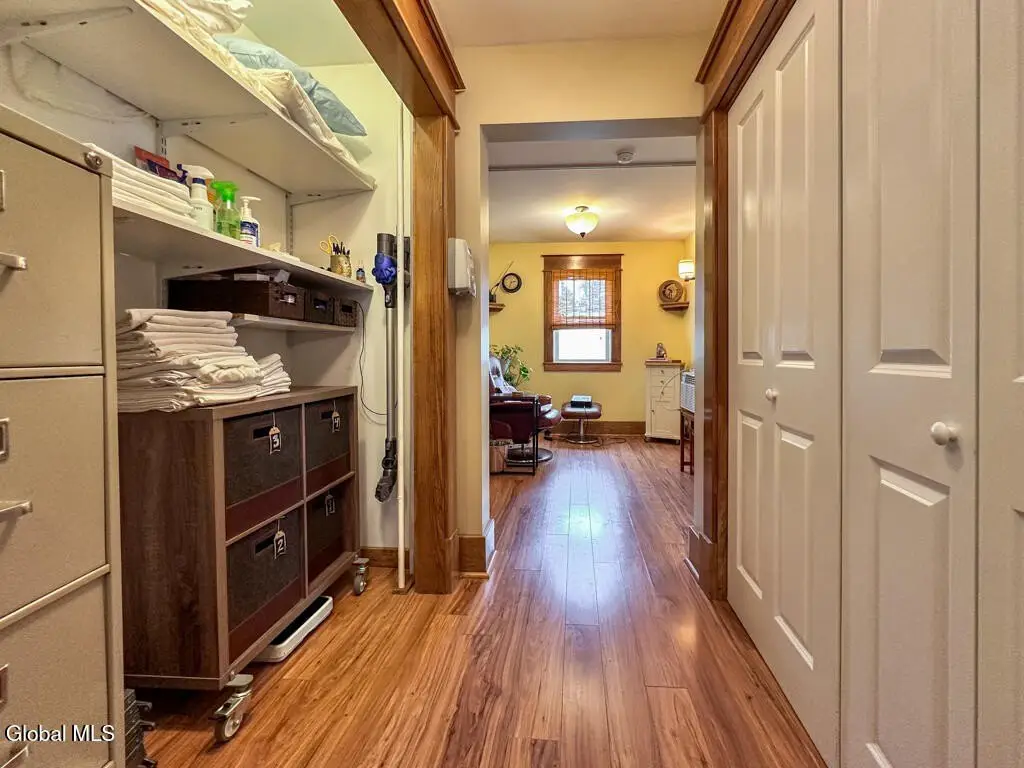
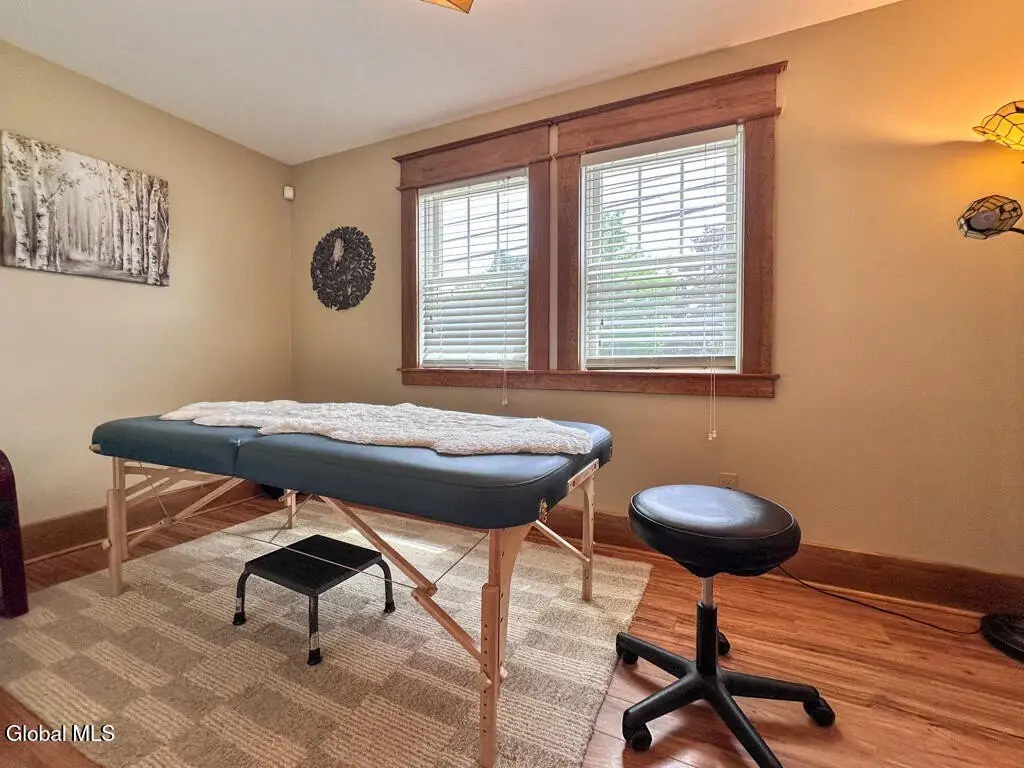
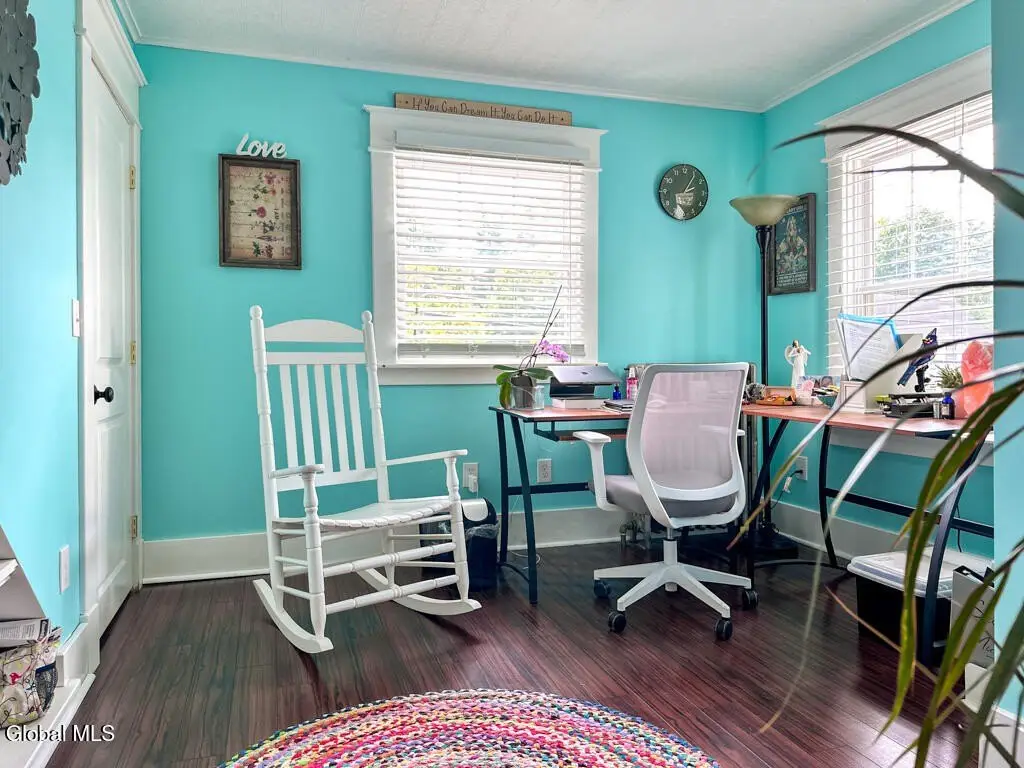
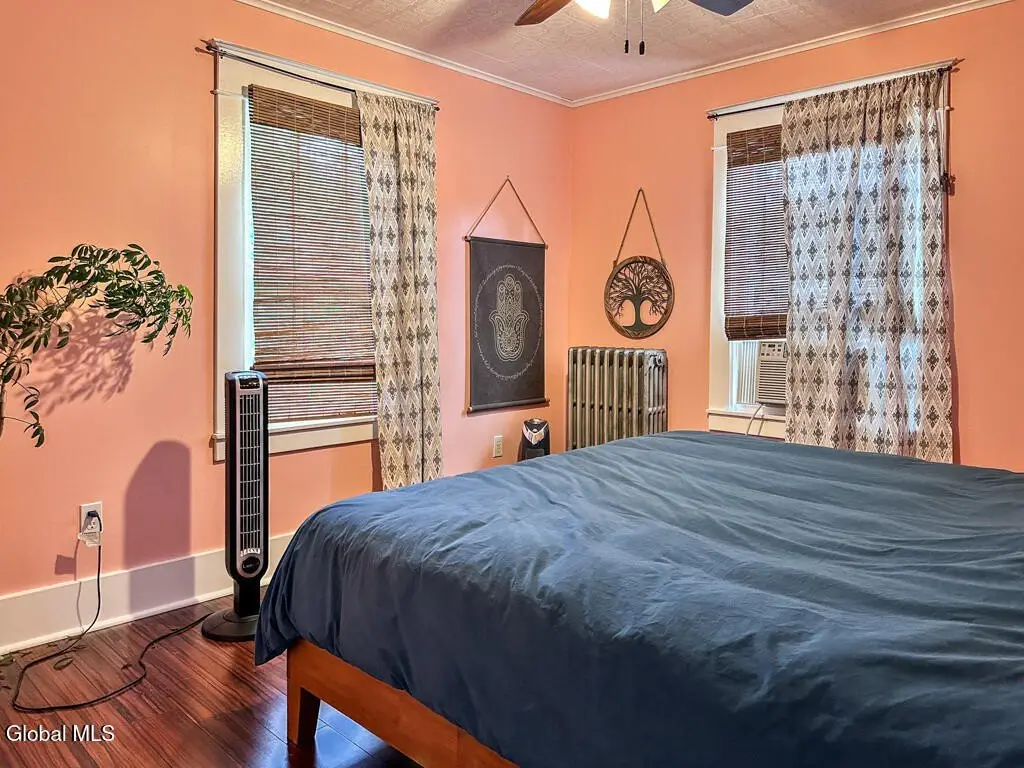
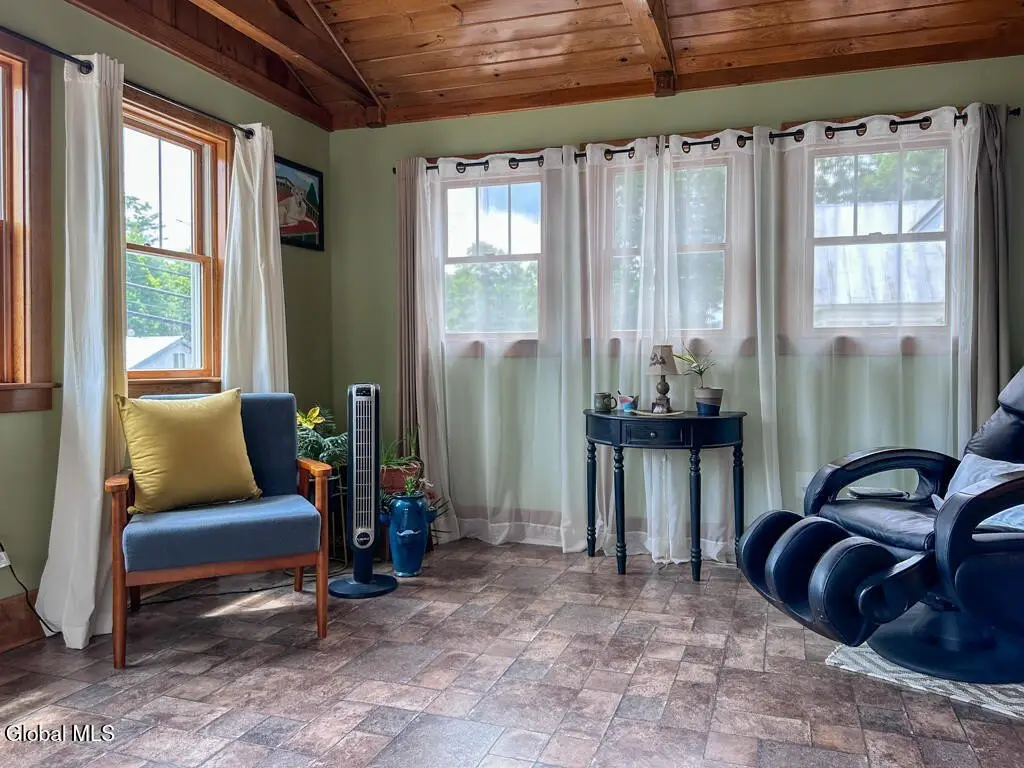
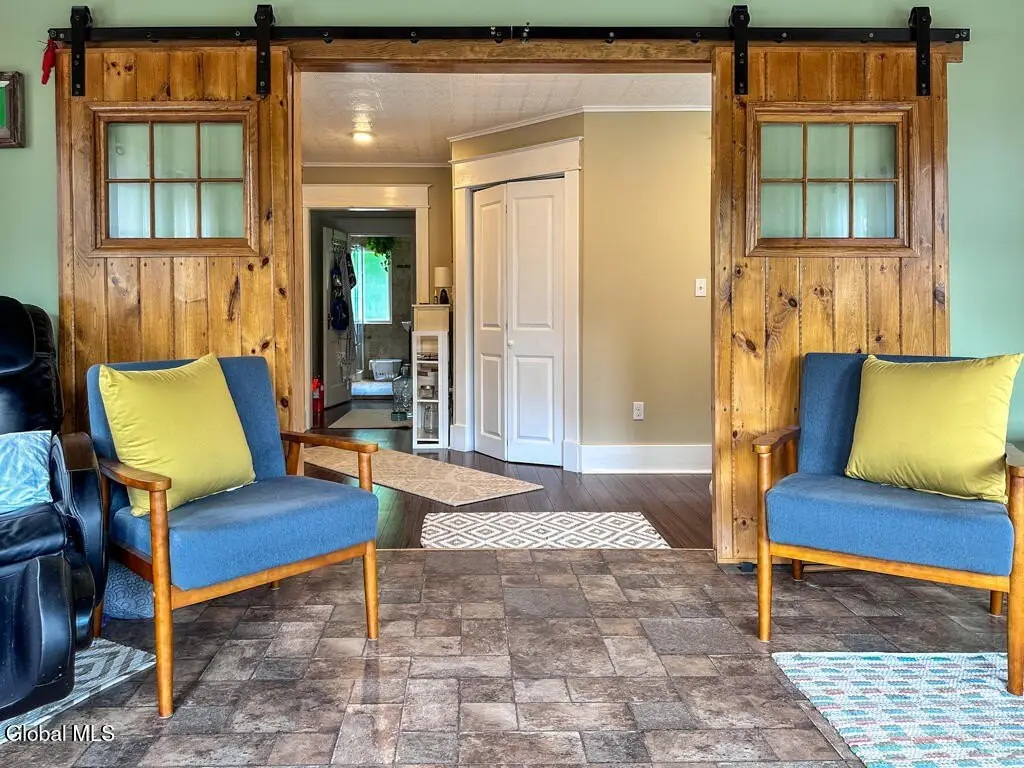
Located at 28 Hudson Street in Warrensburg, this 3,022-square-foot mixed-use property occupies 0.27 acres and carries mixed zoning supporting residential and commercial use. Built in 1930, the building includes a main-level professional layout with reception space, a waiting area, and multiple private treatment rooms. The upper level has served as a private residence, creating a configuration that can accommodate owner occupancy, separate residential use, or continued commercial operation.
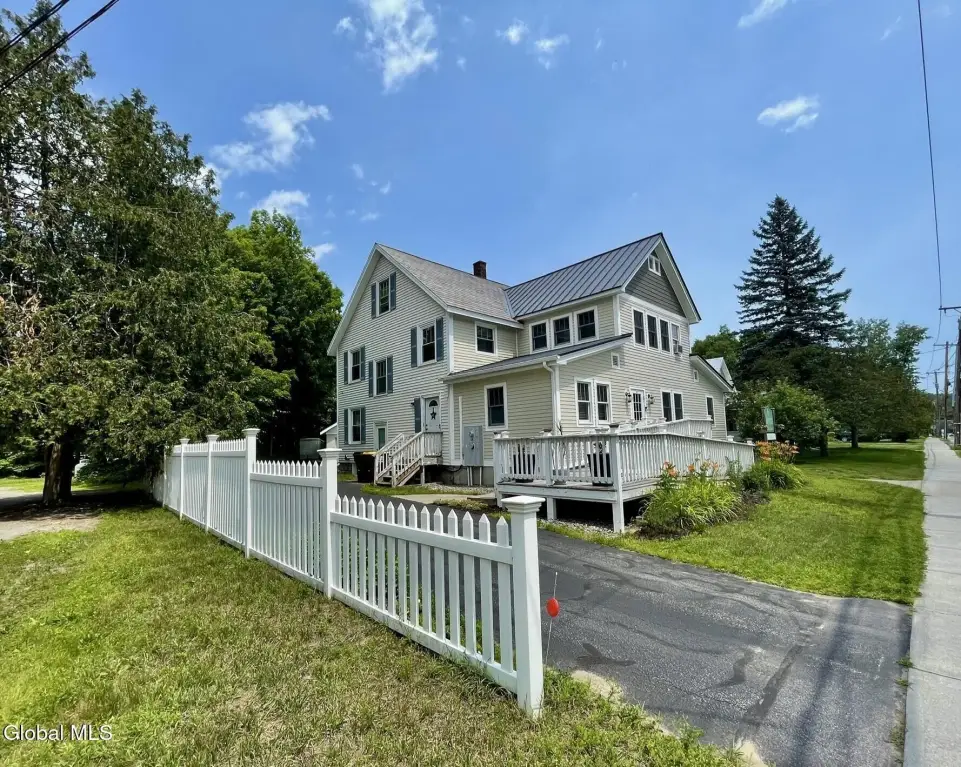
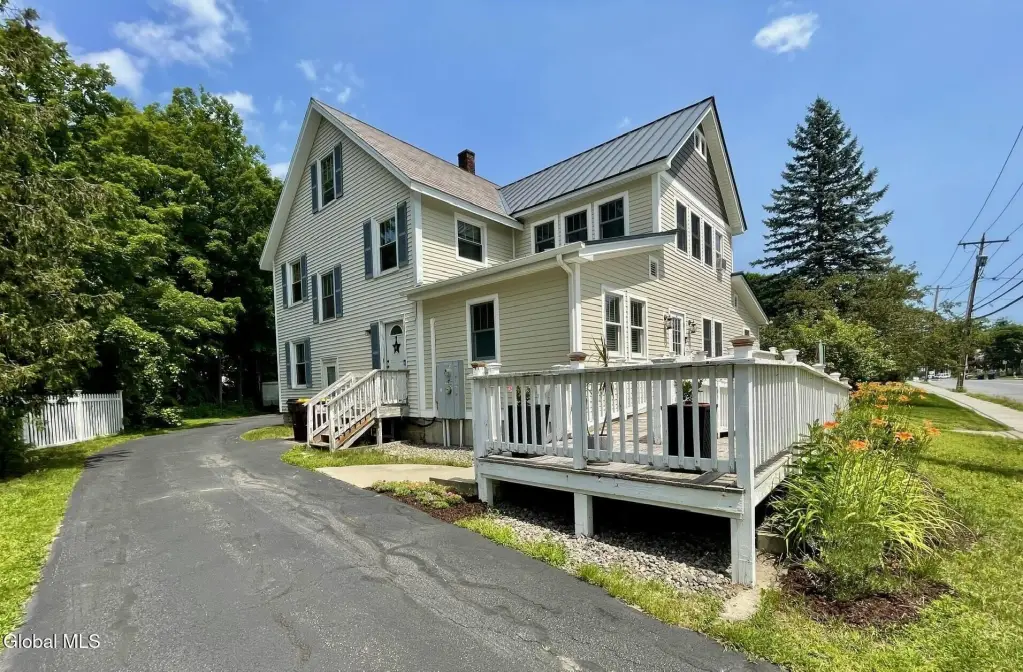
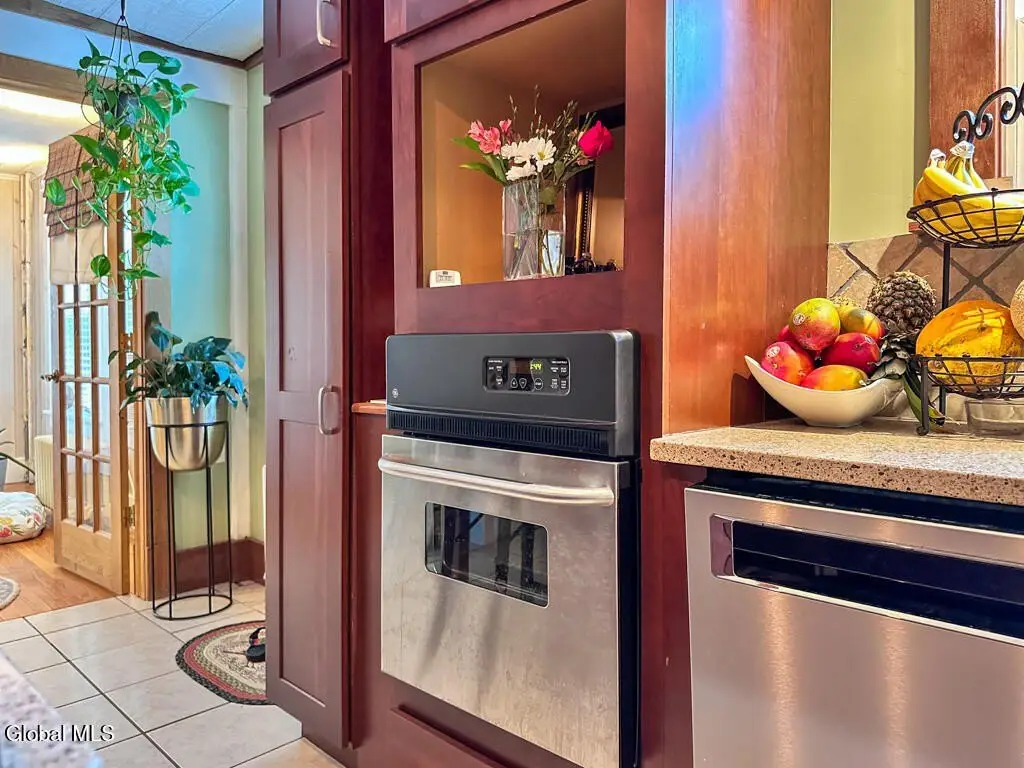
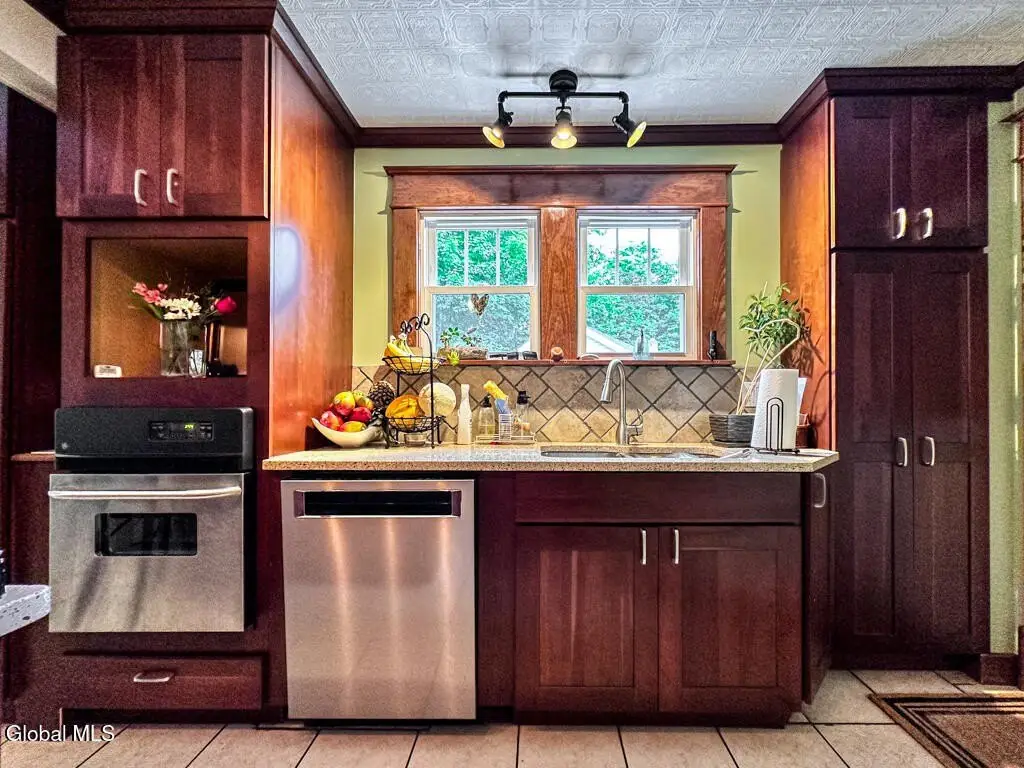
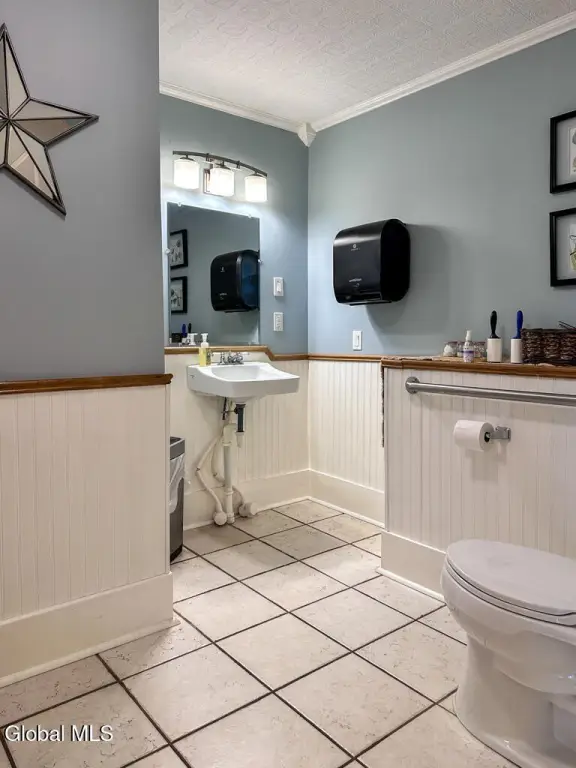
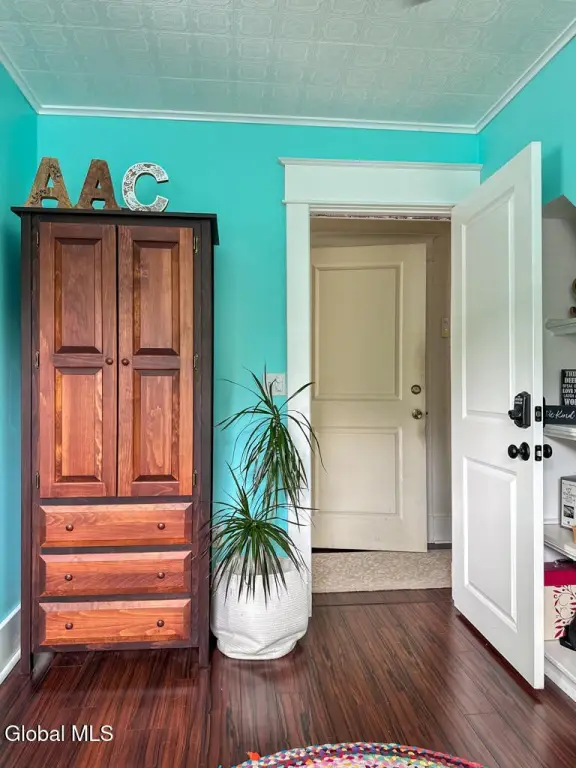
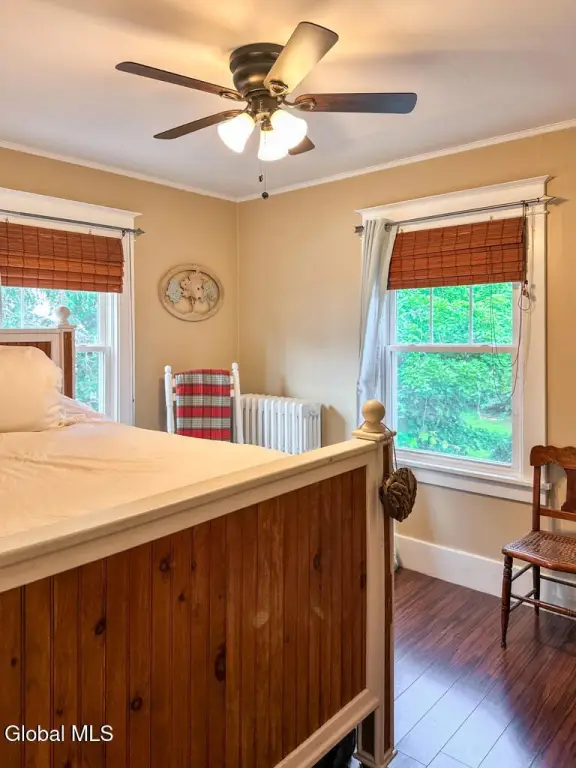
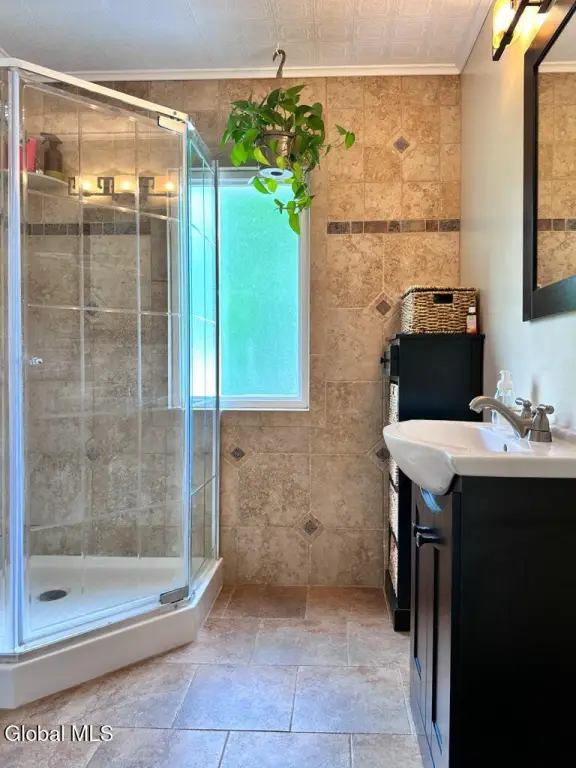
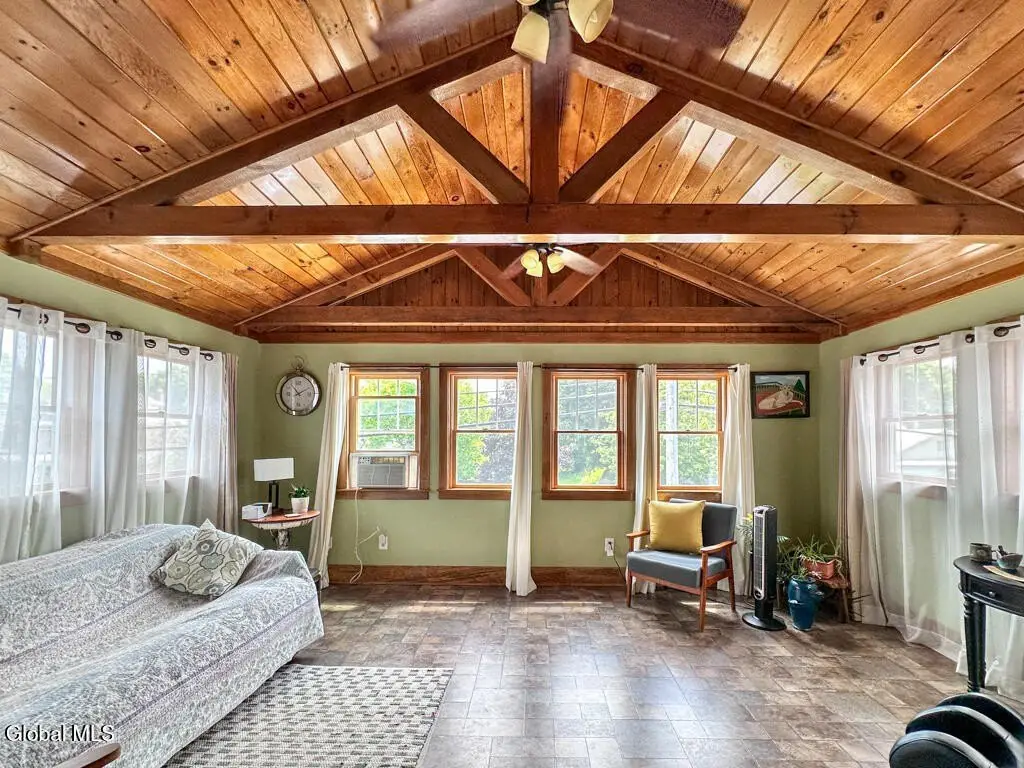
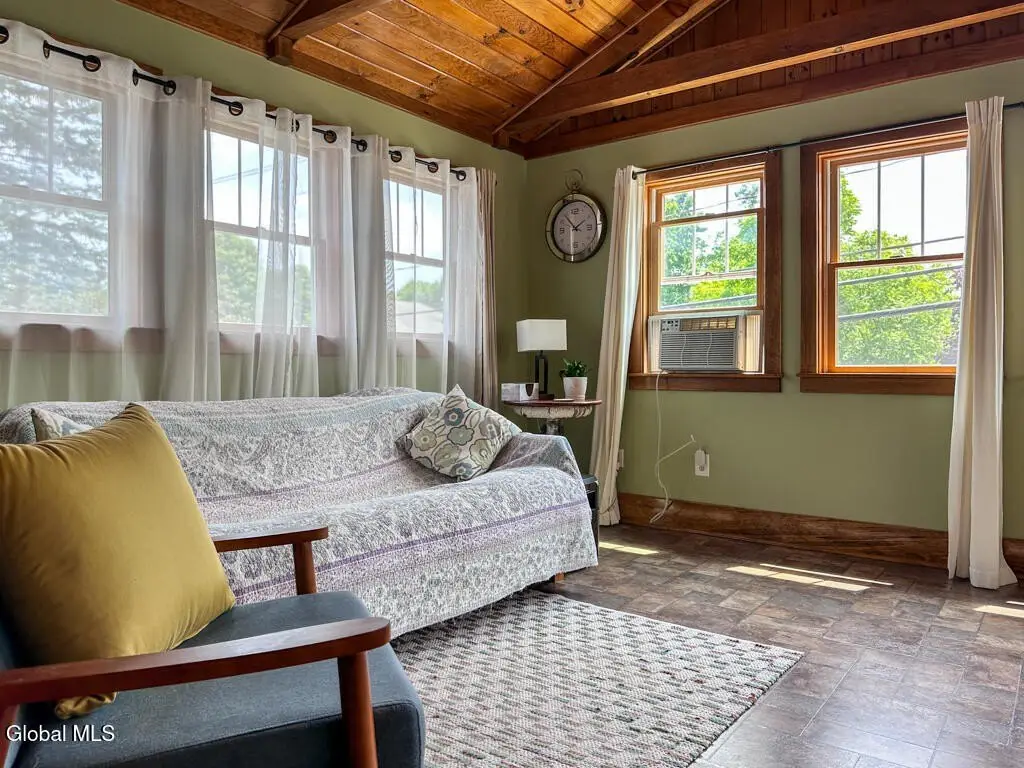
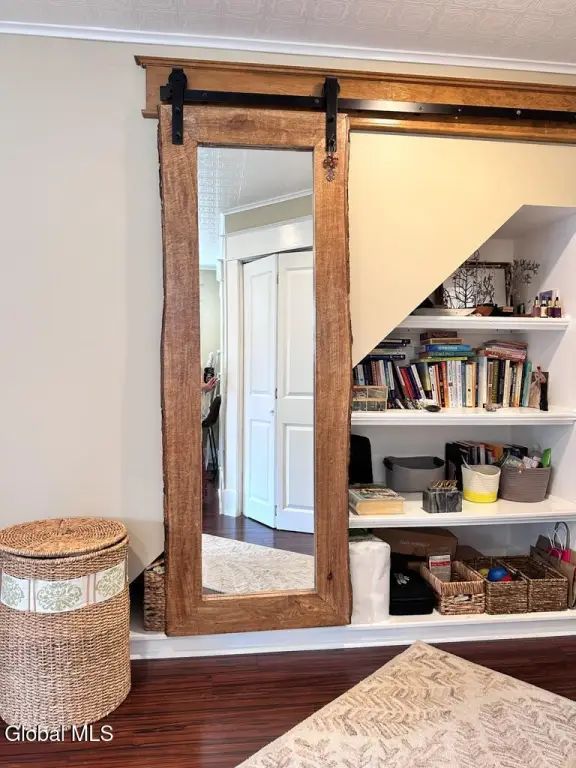
Interior features include wood, tile, laminate, and hardwood flooring, along with solid-surface counters, built-in features, crown molding, and chair rail detailing. Heating is provided through zoned baseboard, hot-water, and radiant systems, with ductless, window, and wall-unit cooling. The property also includes garage and off-street parking, an accessible approach with ramp, public water, and public sewer. Construction materials include block, drywall, and vinyl siding, with asphalt, slate, and metal roofing components.
Interior features include wood, tile, laminate, and hardwood flooring, along with solid-surface counters, built-in features, crown molding, and chair rail detailing. Heating is provided through zoned baseboard, hot-water, and radiant systems, with ductless, window, and wall-unit cooling. The property also includes garage and off-street parking, an accessible approach with ramp, public water, and public sewer. Construction materials include block, drywall, and vinyl siding, with asphalt, slate, and metal roofing components.
Key Highlights
- 3,022 SF mixed‑use building on 0.27 acres
- Mixed zoning supports residential and commercial use
- Main level includes reception, waiting area, and multiple private treatment rooms
Property Analytics
Unlock full access to Insights
Subscribe to Realmo Intelligence
Open Analytics
Current Use
Location Intelligence
Trade Area within ½ mile
372
Businesses Nearby
Explore this area
Business Placement
Demographics for 12885, NY
4,371
Population
2,724
Households
1.6
Avg Household Size
46
Median Age
17%
College-Educated
84%
High-School Grad
80.3 sq mi
ZIP Area
54
Density / Sq Mi
$65,454
Median Household Income
$49,245
Median Earnings
$1,042
Median Rent
$149,000
Median Home Value
Check the figures for this property
Cap Rate, Value Estimation, Potential NOI and more
View Realmo Analytics
Market
Vacancy Rate% for Office in Northeast region

Questions? Ask Rey
Realmo’s AI knows this listing — price, zoning, demand, history. Ask anything.



Frequently Asked Questions
What type of property is this?
Mixed-use property - Two-level building combines professional space with residential flexibility and an established wellness-oriented layout.
Where is this mixed-use property located?
The property is located at 28 Hudson Street Warrensburg, NY.
What is the asking price?
The asking price for this property is $372,500.
What are key features of this property?
This property features: 3,022 SF mixed‑use building on 0.27 acres; Mixed zoning supports residential and commercial use; Main level includes reception, waiting area, and multiple private treatment rooms


