4-Unit Mixed-Use
For Sale
$1,499,000
2773 86th Street, Brooklyn, NY 11223
Two-floor brick property with a separately accessed basement, updated building systems, and multiple utility meters.
Property Size3,408 SF
Price / SF$439.85
Days on Market61
Property Features for 2773 86th Street
General Information
Standard status
Active
Size
3,408 SF
Property subtype
Mixed Use
Building Details
Buildings
1
Stories
2
Construction
brick
Tenancy
Multi
Listing Agency:
Pride Estates
Listed By:
Mitchell Feldman
(718) 569-2888
Source:
Prideestates
Added: Aug 21
Changed: Oct 7
Last Checked: Oct 19 at 6:39AM
Displayed information is deemed reliable but is not guaranteed and should be independently verified. All listing content including descriptions, pricing, images are the copyrighted material of Pride Estates

Ask AI about this property
Review the available facts, identify missing information and prepare questions for the agent.
Investment Insights
Based on property information with market context.
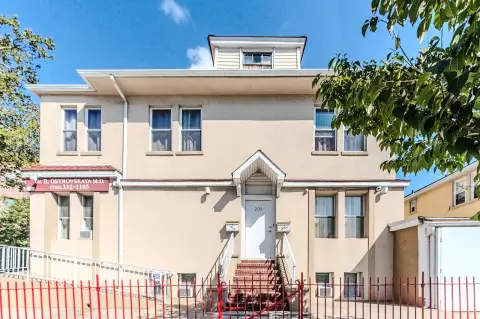
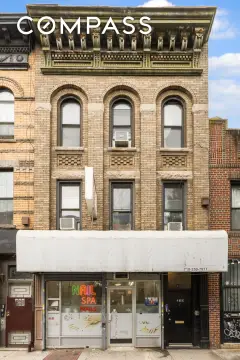
This four-unit mixed-use property at 2773 86th Street, also identified as 2233–2235 West 9th Street, is housed in a solid brick building with 3,408 square feet across two floors. A separate 1,700-square-foot basement has its own street entrance, while interior stairs connect the building’s levels. The property includes updated heat and hot water systems, a new silicone roof, four electric meters, and three gas meters.
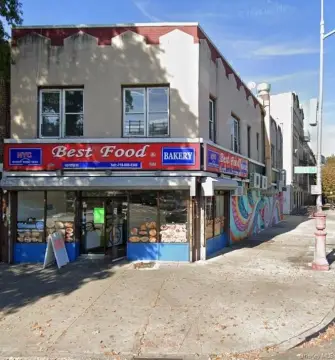
The building occupies a highly visible corner at 86th Street and West 9th Street with substantial frontage. Transit connections include the N train, the D train, B1 and B4 bus stops, and a nearby B3 bus stop. The mixed-use configuration and four-unit layout provide flexibility for professional owner occupancy or continued investment use.
The building occupies a highly visible corner at 86th Street and West 9th Street with substantial frontage. Transit connections include the N train, the D train, B1 and B4 bus stops, and a nearby B3 bus stop. The mixed-use configuration and four-unit layout provide flexibility for professional owner occupancy or continued investment use.
Key Highlights
- Four‑unit mixed‑use property at 2773 86th Street, also known as 2233–2235 West 9th Street
- 3,408 square feet across two floors with a 1,700‑square‑foot basement
- Basement has a separate entrance from the street
Financial Insights
Estimated NOI and Cap Rate
NOI / Yr
$123,710
Cap Rate
8.25%
Suggested Prices Based on Cap Rates
Cap Rate 5%
$2,474,200
$2.5M
Cap Rate 7%
$1,767,286
$1.8M
Cap Rate 9%
$1,374,556
$1.4M
Market Conditions
NOI Build-Up for 3,408 SF
Gross rent
$224.9K $66.00/SF
− Vacancy
−$27.0K −$7.92/SF
EGI
$197.9K $58.08/SF
− OpEx
−$74.2K −$21.78/SF
NOI
$123.7K $36.30/SF
Area
Brooklyn, NY
Vacancy
12.00%
Lease Rate
$66.00 /SF/Yr
Expense Ratio
37.50%
Simulate Cap Rate and NOI
Suggested Prices Based on Cap Rates
Cap Rate 5%
$2,474,200
Cap Rate 7%
$1,767,286
Cap Rate 9%
$1,374,556
Alternative Uses
Best Use
Mixed Use
$1.77M
$1.55M – $2.06M
NOI $123,710 @ 7.0% cap · market cap 8.25%
Second Best
—
—
no second resolved use
Theoretical Best
Specialty Retail
$2.82M
$2.47M – $3.29M
NOI $197,528 @ 7.0% cap · market cap 13.18%
Zoning and permitted uses should be independently verified with authorities.
How Realmo checks its estimates
Property Analytics
Current Use
Lease Details
Multi-tenant
Tenancy
Location Intelligence
Trade Area within ½ mile
2,760
Businesses Nearby
Explore this area
Business Placement
Demographics for 11223, NY
83,519
Population
28,857
Households
2.9
Avg Household Size
37
Median Age
34%
College-Educated
78%
High-School Grad
2.1 sq mi
ZIP Area
39,771
Density / Sq Mi
$63,950
Median Household Income
$40,592
Median Earnings
$1,653
Median Rent
$1,063,200
Median Home Value






Frequently Asked Questions
What type of property is this?
Mixed-use property - Two-floor brick property with a separately accessed basement, updated building systems, and multiple utility meters.
Where is this mixed-use property located?
The property is located at 2773 86th Street Brooklyn, NY.
What is the asking price?
The asking price for this property is $1,499,000.
What are key features of this property?
This property features: Four‑unit mixed‑use property at 2773 86th Street, also known as 2233–2235 West 9th Street; 3,408 square feet across two floors with a 1,700‑square‑foot basement; Basement has a separate entrance from the street


