Remodeled Commercial Space For
For Sale
$549,000
2710 S Main St, Ingleside, TX 78362
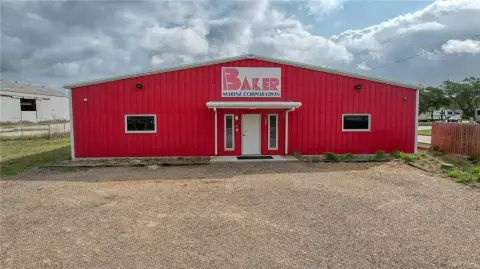
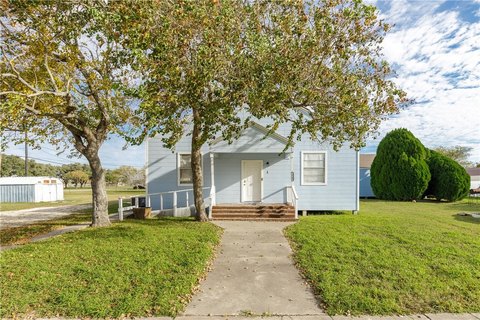
Remodeled commercial space with easy access to surrounding areas.
Property Size6,900 SF
Price / SF$79.57
Days on Market211
Property Features for 2710 S Main St
General Information
Standard status
Active
Size
6,900 SF
Property subtype
Retail
Building Details
Building Size
6,900 SF
Year Built
2003
Listing Agency:
Cravey Real Estate Services, Inc.
Listed By:
Lynann Pinkham · License #TX #319336
(361) 815-2155
Source:
Craveyrealestate
Added: Mar 26
Changed: Oct 14
Last Checked: Oct 20 at 6:21PM
Displayed information is deemed reliable but is not guaranteed and should be independently verified. All listing content including descriptions, pricing, images are the copyrighted material of Cravey Real Estate Services, Inc.

Ask AI about this property
Review the available facts, identify missing information and prepare questions for the agent.
Investment Insights
Based on property information with market context.
This centrally located commercial space offers convenient access to shopping, schools, industry, and businesses, making it suitable for servicing various industry needs. Its location provides proximity to Rockport, Gregory, Aransas Pass, and other nearby municipalities. The property underwent a complete $100,000 remodel in 2024, which included the installation of a new 5-ton HVAC unit, new electrical service, and LED interior lights. Additional improvements include new rain gutters, interior walls, and an office. Previously used as a dance studio for over 20 years, the property is currently occupied by Mary Jane’s Gymnastics. The building has a total area of 6,900 square feet.
Key Highlights
- Central location with easy access to shopping, schools, industry, and businesses.
- Complete $100,000 remodel in 2024.**
- New 5 TON HVAC unit installed in 2024.**
Financial Insights
Estimated NOI and Cap Rate
NOI / Yr
$30,927
Cap Rate
5.63%
Suggested Prices Based on Cap Rates
Cap Rate 5%
$618,540
$618.5K
Cap Rate 7%
$441,814
$441.8K
Cap Rate 9%
$343,633
$343.6K
Market Conditions
NOI Build-Up for 6,900 SF
Gross rent
$48.0K $6.96/SF
− Vacancy
−$3.8K −$0.56/SF
EGI
$44.2K $6.40/SF
− OpEx
−$13.3K −$1.92/SF
NOI
$30.9K $4.48/SF
Area
San Patricio County, TX
Vacancy
8.00%
Lease Rate
$6.96 /SF/Yr
Expense Ratio
30.00%
Simulate Cap Rate and NOI
Suggested Prices Based on Cap Rates
Cap Rate 5%
$618,540
Cap Rate 7%
$441,814
Cap Rate 9%
$343,633
Alternative Uses
Best Use
Retail
$441.8K
$386.6K – $515.5K
NOI $30,927 @ 7.0% cap · market cap 5.63%
Second Best
—
—
no second resolved use
Theoretical Best
Hotel Hospitality
$3.54M
$3.10M – $4.13M
NOI $247,779 @ 7.0% cap · market cap 45.13%
Zoning and permitted uses should be independently verified with authorities.
How Realmo checks its estimates
Property Analytics
Unlock full access to Insights
Subscribe to Realmo Intelligence
Open Analytics
Current Use
Location Intelligence
Trade Area within ½ mile
361
Businesses Nearby
56k
Monthly Visits Nearby
Explore this area
Business Placement
Foot Traffic Nearby
Shops & Services 59%
Dining 41%
Valero Energy
Shops & Services
17,293 visits/mo
0.3 miles
Whataburger
Dining
15,415 visits/mo
0.4 miles
Dollar Tree
Shops & Services
8,537 visits/mo
0.3 miles
Taco Bell
Dining
4,812 visits/mo
0.4 miles
7-Eleven
Shops & Services
4,466 visits/mo
0.1 miles
Demographics for 78362, TX
10,238
Population
4,701
Households
2.2
Avg Household Size
36
Median Age
21%
College-Educated
86%
High-School Grad
18.3 sq mi
ZIP Area
559
Density / Sq Mi
$78,698
Median Household Income
$41,240
Median Earnings
$1,226
Median Rent
$182,600
Median Home Value
Check the figures for this property
Cap Rate, Value Estimation, Potential NOI and more
View Realmo Analytics
Market
Vacancy Rate% for Retail in South region




Frequently Asked Questions
What type of property is this?
Retail space - Remodeled commercial space with easy access to surrounding areas.
Where is this retail space located?
The property is located at 2710 S Main St Ingleside, TX.
What is the asking price?
The asking price for this property is $549,000.
What are key features of this property?
This property features: Central location with easy access to shopping, schools, industry, and businesses.; Complete $100,000 remodel in 2024.**; New 5 TON HVAC unit installed in 2024.**


