Mixed-Use Redevelopment
For Sale
Contact for pricing
271-279 South Wellwood Avenue, Lindenhurst, NY 11757
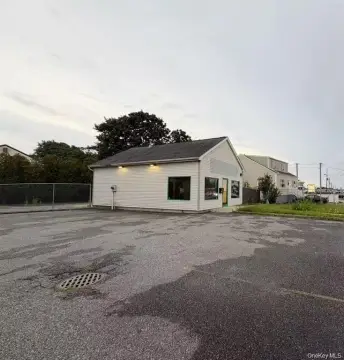
Infill redevelopment site with an existing retail structure and an adjoining dedicated parking lot in the Business District.
Property Size10,000 SF
Lot Size0.46 Acres
Price / SF$425
Days on Market185
Property Features for 271-279 South Wellwood Avenue
General Information
Standard status
Active
Size
10,000 SF
Total Parking Spaces
26
Lot size
0.46 Acres
Property subtype
Mixed Use, Land, Retail
Zoning
Business (B) District
Investment Type
Redevelopment
Building Details
Year Built
1954
Buildings
1
Units
5
Listing Agency:
Parallel Realty Group, LLC
Listed By:
Robert Bakhchi · License #10991228697
Source:
Crexi
Added: Apr 24
Changed: Oct 11
Last Checked: Oct 24 at 2:54PM
Displayed information is deemed reliable but is not guaranteed and should be independently verified. All listing content including descriptions, pricing, images are the copyrighted material of Parallel Realty Group, LLC

Ask AI about this property
Review the available facts, identify missing information and prepare questions for the agent.
Investment Insights
Based on property information with market context.
Located at 271–279 South Wellwood Avenue in Lindenhurst, this infill redevelopment opportunity includes a combined 20,000 SF footprint split between a 10,000 SF existing retail structure and a 10,000 SF dedicated parking lot. The site is positioned in the Business (B) District, where a broad range of commercial uses is permitted, subject to Village review.
The existing retail building can support adaptive reuse or be repositioned as a cost-effective shell. The dedicated parking lot provides flexibility for required parking ratios and future building expansion, with potential for site amenities. The property is described as walkable to the Village downtown, and the municipal environment is noted as supportive of thoughtful redevelopment efforts.
Ownership is also considering the sale of an additional 7,700 building/lot at 271 S. 1st St behind the main structure, which would allow the site to be squared off to support redevelopment planning.
The existing retail building can support adaptive reuse or be repositioned as a cost-effective shell. The dedicated parking lot provides flexibility for required parking ratios and future building expansion, with potential for site amenities. The property is described as walkable to the Village downtown, and the municipal environment is noted as supportive of thoughtful redevelopment efforts.
Ownership is also considering the sale of an additional 7,700 building/lot at 271 S. 1st St behind the main structure, which would allow the site to be squared off to support redevelopment planning.
Key Highlights
- 20,000 SF infill redevelopment site in the Village of Lindenhurst Business (B) District
- Existing 10,000 SF retail structure plus an adjoining 10,000 SF dedicated parking lot
- Potential for mixed‑use development (retail + residential/office) subject to Village review
Financial Insights
Estimated NOI and Cap Rate
NOI / Yr
$195,510
Cap Rate
4.60%
Suggested Prices Based on Cap Rates
Cap Rate 5%
$3,910,200
$3.9M
Cap Rate 7%
$2,793,000
$2.8M
Cap Rate 9%
$2,172,333
$2.2M
Market Conditions
NOI Build-Up for 10,000 SF
Gross rent
$300.0K $30.00/SF
− Vacancy
−$20.7K −$2.07/SF
EGI
$279.3K $27.93/SF
− OpEx
−$83.8K −$8.38/SF
NOI
$195.5K $19.55/SF
Area
Suffolk County, NY
Vacancy
6.90%
Lease Rate
$30.00 /SF/Yr
Expense Ratio
30.00%
Simulate Cap Rate and NOI
Suggested Prices Based on Cap Rates
Cap Rate 5%
$3,910,200
Cap Rate 7%
$2,793,000
Cap Rate 9%
$2,172,333
Alternative Uses
Best Use
Retail
$2.79M
$2.44M – $3.26M
NOI $195,510 @ 7.0% cap · market cap 4.60%
Second Best
—
—
no second resolved use
Theoretical Best
Office A
$3.05M
$2.67M – $3.55M
NOI $213,252 @ 7.0% cap · market cap 5.02%
Zoning and permitted uses should be independently verified with authorities.
How Realmo checks its estimates
Property Analytics
Current Use
Location Intelligence
Trade Area within ½ mile
1,080
Businesses Nearby
Under-served
Demand for This Use
Explore this area
Business Placement
Demographics for 11757, NY
45,157
Population
15,212
Households
3
Avg Household Size
41
Median Age
30%
College-Educated
91%
High-School Grad
6.8 sq mi
ZIP Area
6,641
Density / Sq Mi
$128,081
Median Household Income
$56,059
Median Earnings
$2,091
Median Rent
$479,500
Median Home Value
Market
Vacancy Rate% for Retail in Northeast region




Similar Off Market Nearby
- Design in Silk — 156 S Clinton Ave, Lindenhurst, NY 11757
- Little Flower Shop — 437 N Wellwood Ave, Lindenhurst, NY 11757
Frequently Asked Questions
What type of property is this?
Storefront property - Infill redevelopment site with an existing retail structure and an adjoining dedicated parking lot in the Business District.
Where is this storefront property located?
The property is located at 271-279 South Wellwood Avenue Lindenhurst, NY.
What is the asking price?
The asking price for this property is $4,250,000.
What are key features of this property?
This property features: 20,000 SF infill redevelopment site in the Village of Lindenhurst Business (B) District; Existing 10,000 SF retail structure plus an adjoining 10,000 SF dedicated parking lot; Potential for mixed‑use development (retail + residential/office) subject to Village review


