Corner Residential Income
For Sale
$389,988
27-1111 Morse Ave, Sunnyvale, CA 94089
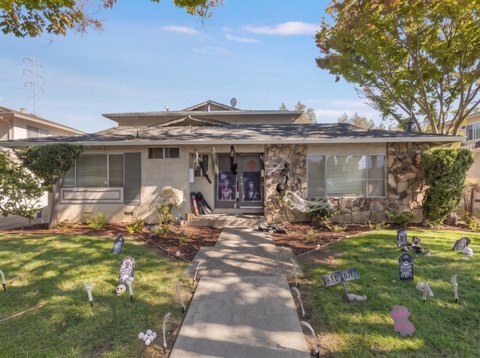
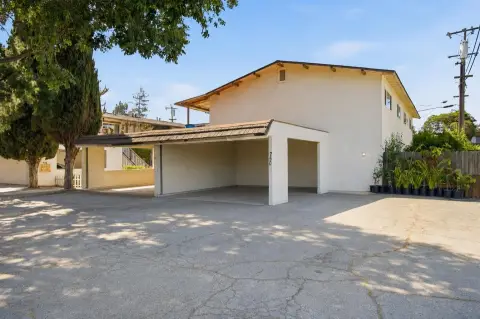
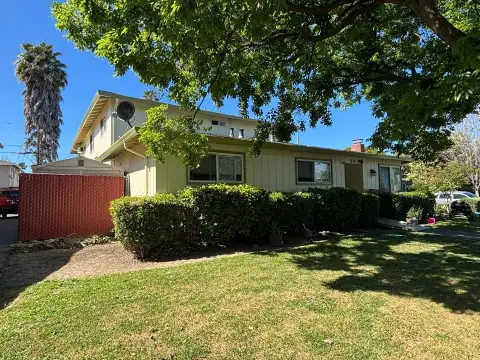
Updated residence in a 55-and-over community with bright interiors, upgraded finishes, and included appliances.
Property Size1,560 SF
Price / SF$249.99
Days on Market92
Property Features for 27-1111 Morse Ave
General Information
Standard status
Active
Size
1,560 SF
Property subtype
Manufactured In Park
Listing Agency:
Century 21 Masters
(800) 463-0977
Listed By:
Sam Habib · License #01253784
(408) 234-1500
Source:
Exprealty
Added: Jul 20
Changed: Oct 3
Last Checked: Oct 19 at 7:39AM
Displayed information is deemed reliable but is not guaranteed and should be independently verified. All listing content including descriptions, pricing, images are the copyrighted material of Century 21 Masters

Ask AI about this property
Review the available facts, identify missing information and prepare questions for the agent.
Investment Insights
Based on property information with market context.
This 1,560-square-foot corner residence is located in an active 55-and-over community. The interior includes high ceilings, wood flooring, granite countertops, cherrywood cabinetry, designer paint, and multiple skylights and windows that bring natural light into the kitchen and living areas. Built-in entertainment cabinetry anchors the living room, while the bedrooms offer generous proportions and the front bedroom includes bay windows with a display shelf.
The property includes a side-by-side refrigerator, washer, and dryer. A new land lease is contemplated, subject to park management approval. Community activities and a neighborhood setting are also part of the property’s stated offering.
The property includes a side-by-side refrigerator, washer, and dryer. A new land lease is contemplated, subject to park management approval. Community activities and a neighborhood setting are also part of the property’s stated offering.
Key Highlights
- 1,560‑square‑foot corner residence in a 55‑and‑over community
- High ceilings, wood flooring, granite countertops, and cherrywood cabinetry
- Kitchen enhanced by skylights and additional windows
Financial Insights
Estimated NOI and Cap Rate
NOI / Yr
$32,974
Cap Rate
8.46%
Suggested Prices Based on Cap Rates
Cap Rate 5%
$659,480
$659.5K
Cap Rate 7%
$471,057
$471.1K
Cap Rate 9%
$366,378
$366.4K
Market Conditions
NOI Build-Up for 1,560 SF
Gross rent
$62.7K $40.20/SF
− Vacancy
−$2.8K −$1.77/SF
EGI
$60.0K $38.43/SF
− OpEx
−$27.0K −$17.29/SF
NOI
$33.0K $21.14/SF
Area
Sunnyvale, CA
Vacancy
4.40%
Lease Rate
$40.20 /SF/Yr
Expense Ratio
45.00%
Simulate Cap Rate and NOI
Suggested Prices Based on Cap Rates
Cap Rate 5%
$659,480
Cap Rate 7%
$471,057
Cap Rate 9%
$366,378
Alternative Uses
Best Use
Apartment 5plus
$471.1K
$412.2K – $549.6K
NOI $32,974 @ 7.0% cap · market cap 8.46%
Second Best
—
—
no second resolved use
Theoretical Best
Office A
$677.9K
$593.2K – $790.9K
NOI $47,452 @ 7.0% cap · market cap 12.17%
Zoning and permitted uses should be independently verified with authorities.
How Realmo checks its estimates
Property Analytics
Current Use
Location Intelligence
Trade Area within ½ mile
1,564
Businesses Nearby
Explore this area
Business Placement
Demographics for 94089, CA
23,255
Population
9,449
Households
2.5
Avg Household Size
37
Median Age
57%
College-Educated
92%
High-School Grad
6.1 sq mi
ZIP Area
3,812
Density / Sq Mi
$153,725
Median Household Income
$82,653
Median Earnings
$3,351
Median Rent
$392,000
Median Home Value




Frequently Asked Questions
What type of property is this?
Residential income property - Updated residence in a 55-and-over community with bright interiors, upgraded finishes, and included appliances.
Where is this residential income property located?
The property is located at 27-1111 Morse Ave Sunnyvale, CA.
What is the asking price?
The asking price for this property is $389,988.
What are key features of this property?
This property features: 1,560‑square‑foot corner residence in a 55‑and‑over community; High ceilings, wood flooring, granite countertops, and cherrywood cabinetry; Kitchen enhanced by skylights and additional windows


