Duplex with Two
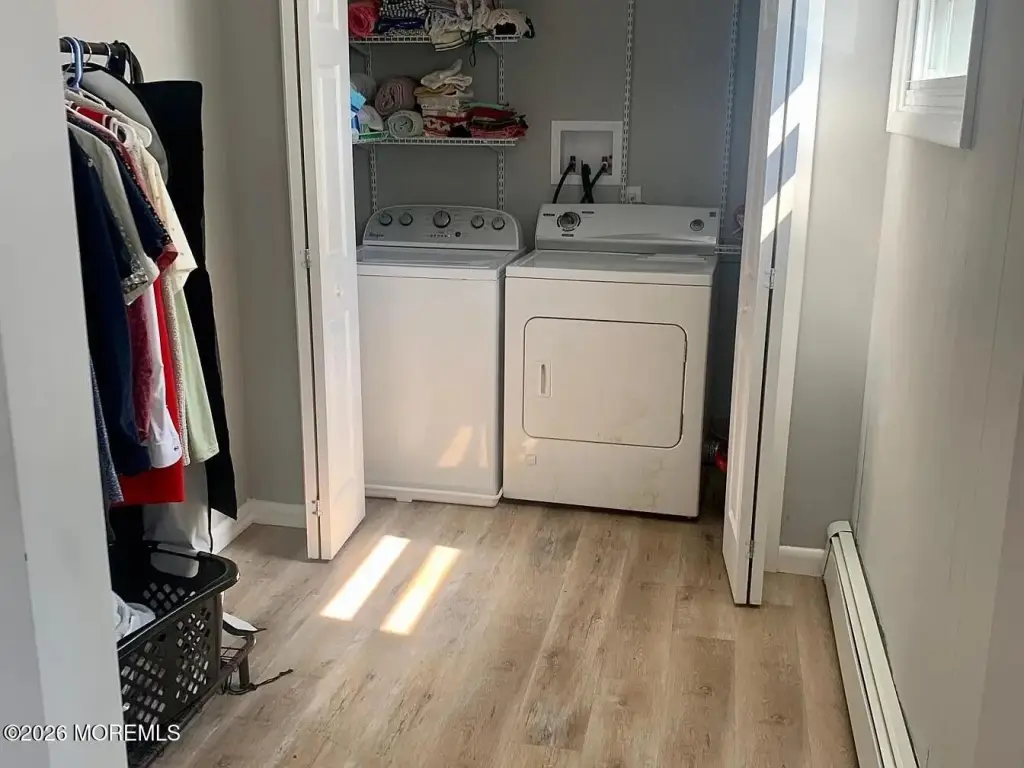
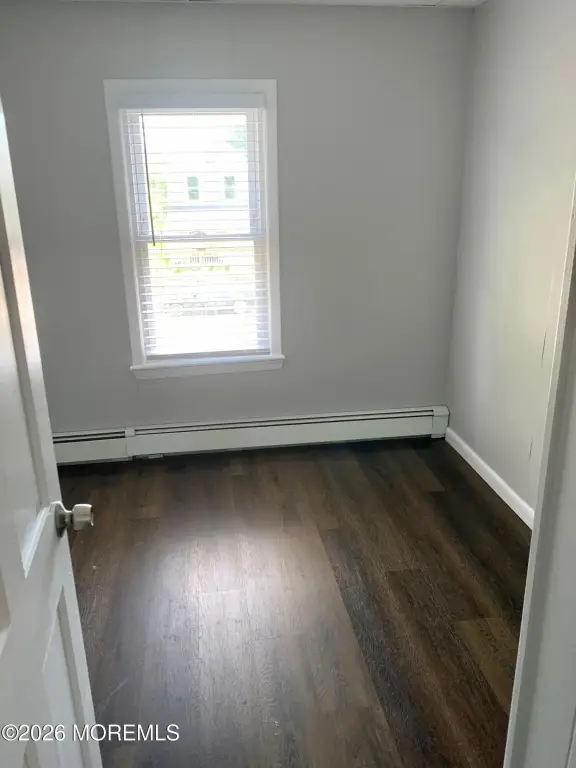
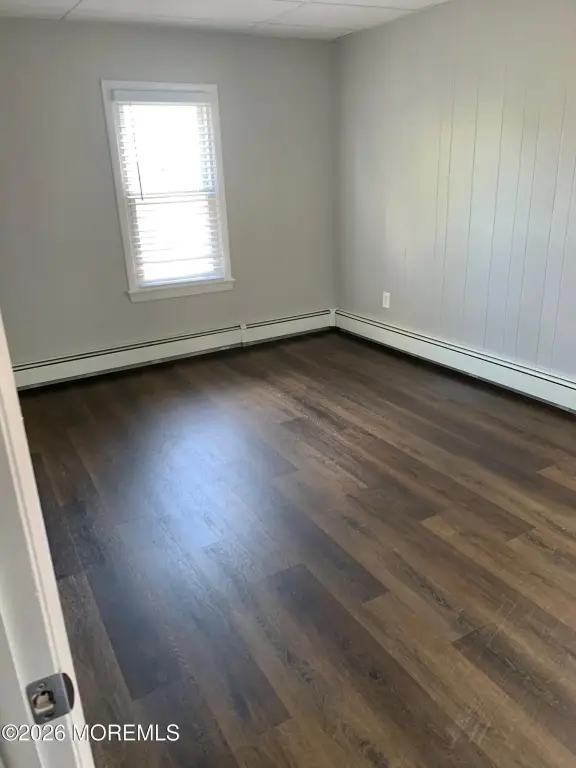
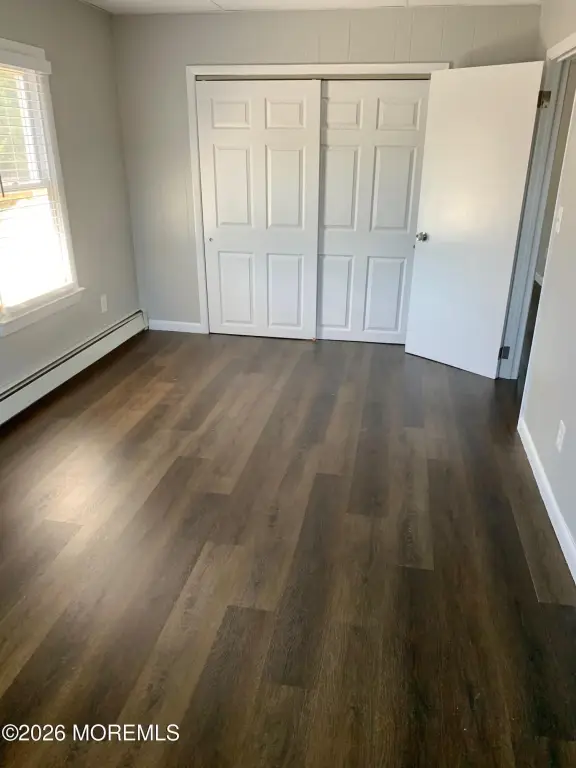
For Sale
$899,000
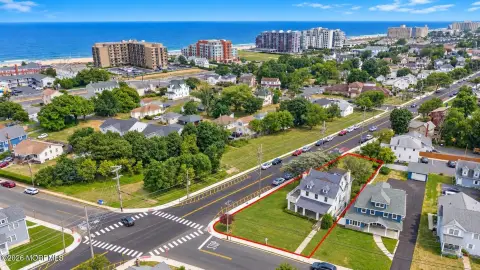
264 West End Avenue, Long Branch, NJ 07740
Multi-Family, Long Branch, NJ
Property Size1,740 SF
Lot Size0.19 Acres
Price / SF$516.67
Days on Market98
Property Features for 264 West End Avenue
General Information
Property type
Residential Multi Family
Property subtype
Duplex
Bedrooms
3
Bathrooms
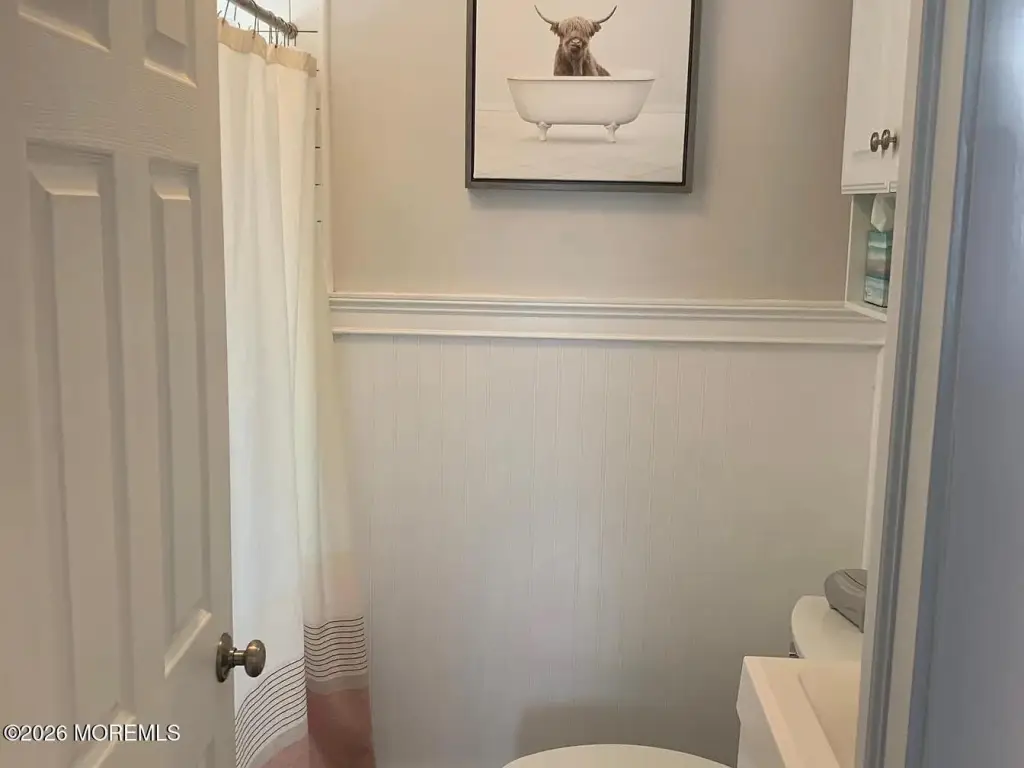
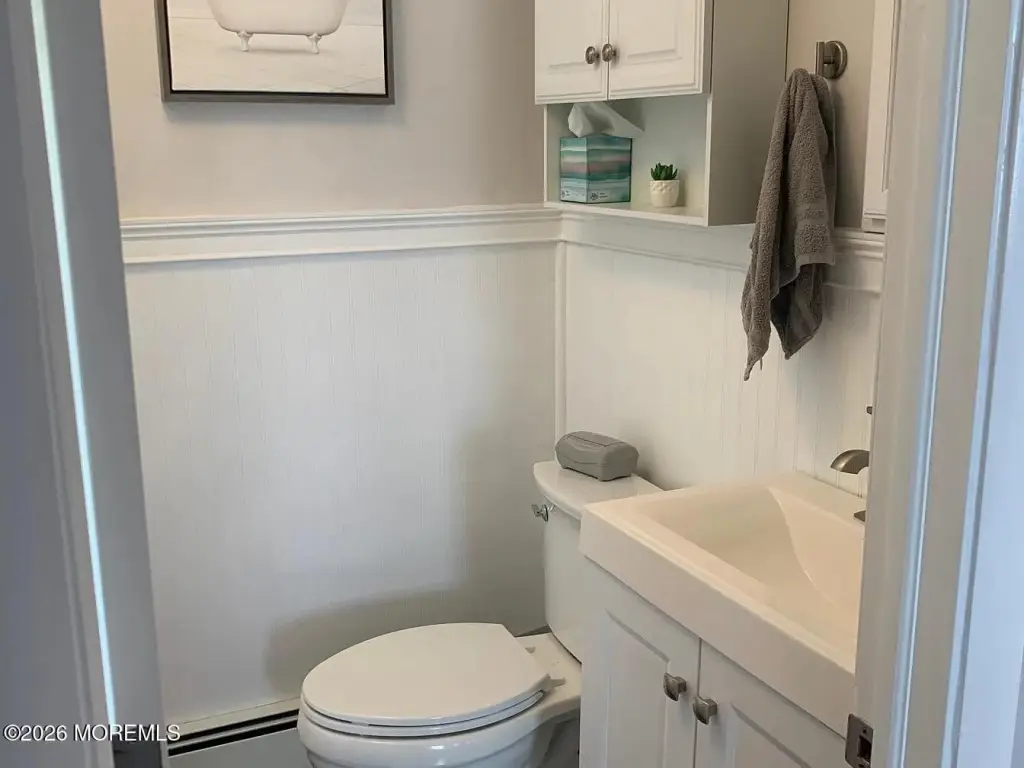
2
Full bathrooms
2
Rooms
Bedroom 1, Bedroom 2, Basement, Bathroom 1, Bathroom 2, Bedroom 3
Basement
Partially Finished
Elementary school
Garfield
Middle school
Long Branch
High school
Long Branch
Directions
Take exit 105 on GSP to HWY 36, right on Hwy 35 to right on Industrial Way, right on Wall St, right on Norwood, left on West End, cross over Westwood to 246.
Subdivision
West End
Standard status
Active
APN
27-00117-0000-00008
Size
1,740 SF
Lot size
0.19 Acres
Taxes and HOA fees
Tax Year
2025
Tax Annual Amount
11637
Utilities
Sewer type
Public Sewer
Heating system
Baseboard
Cooling system
Multi Units
Water source
Public
Amenities
open front porch
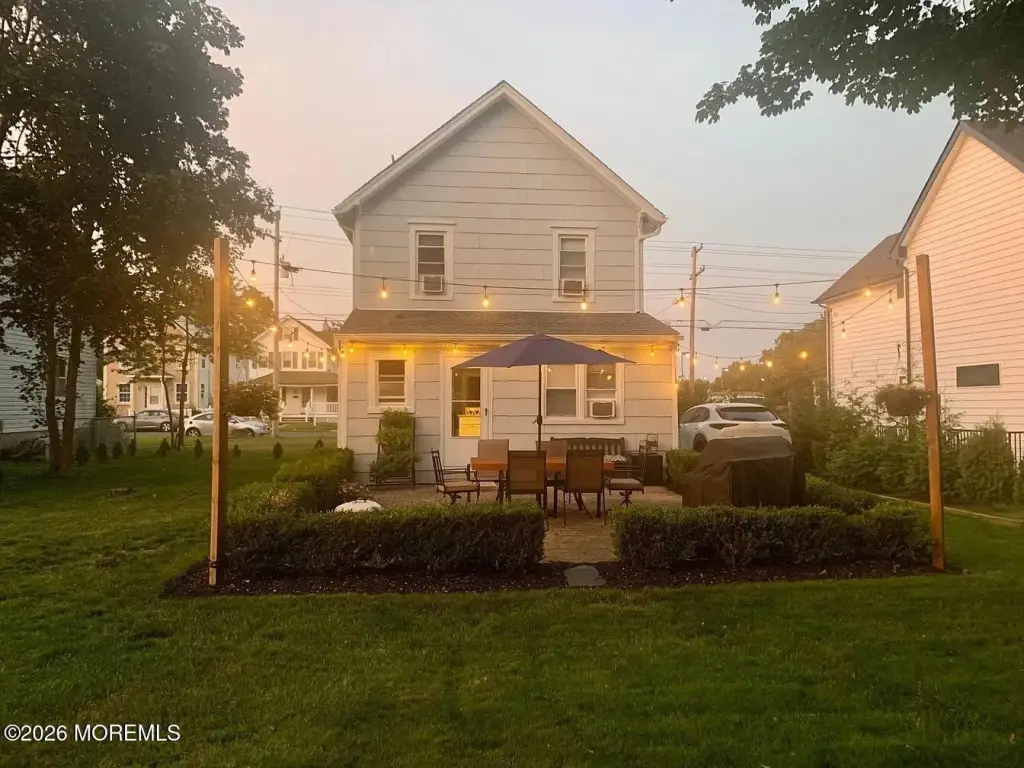
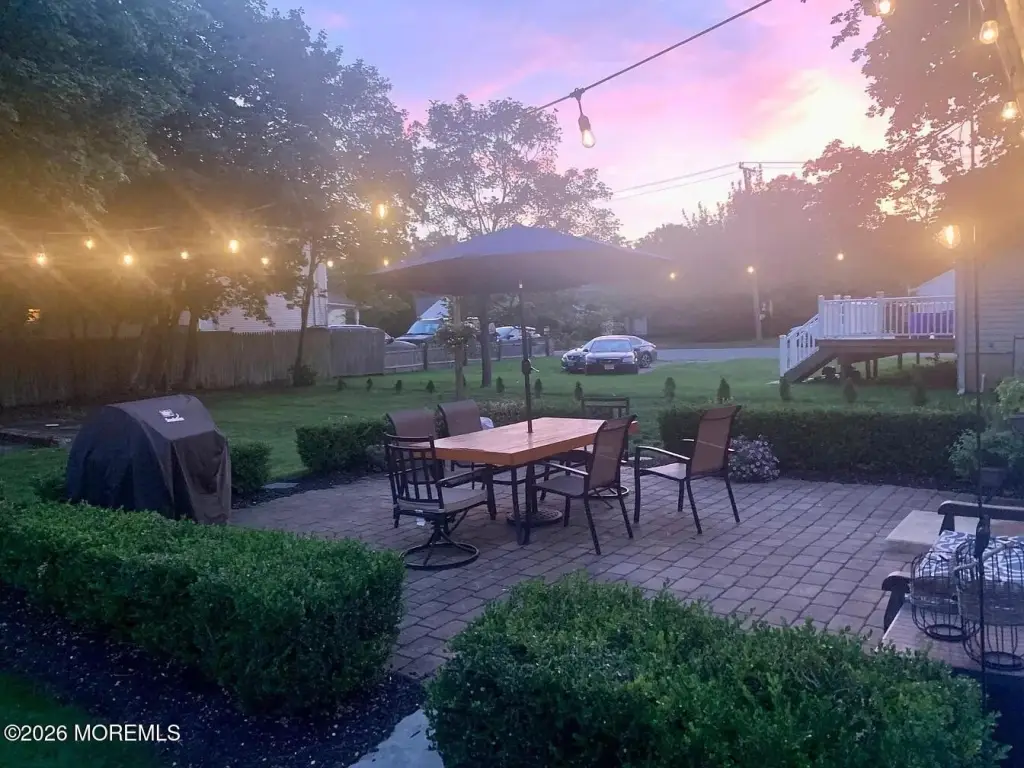
spacious patio
storage shed
partially finished basement
Building Details
Year built
1910
Floors in Building
2
Number of units
2
Listing Agency:
Burke&Manna Real Estate Agency
Listed By:
Michael Manna · License #0900958
(732) 455-5420
Added: Jul 8
Changed: Oct 2
Last Checked: Oct 13 at 2:06AM
MLS# 22620715
Copyright © 2026 More MLS. All rights reserved. All information provided by the listing agent/broker is deemed reliable but is not guaranteed and should be independently verified.
Investment Insights
Based on property information with market context.
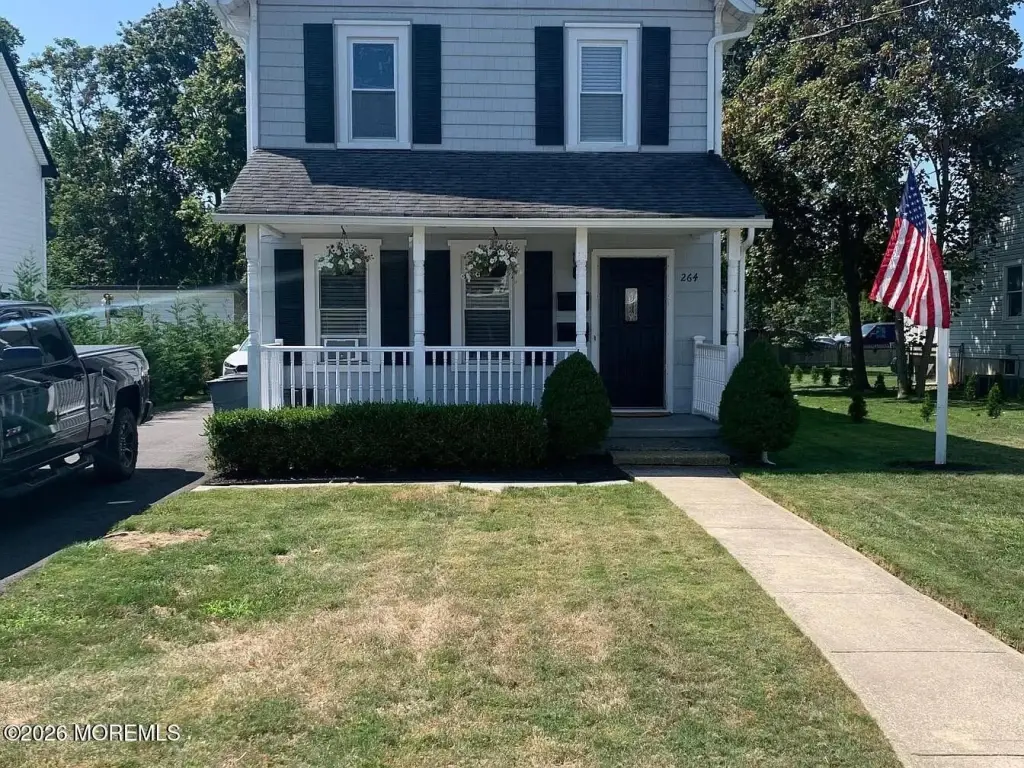
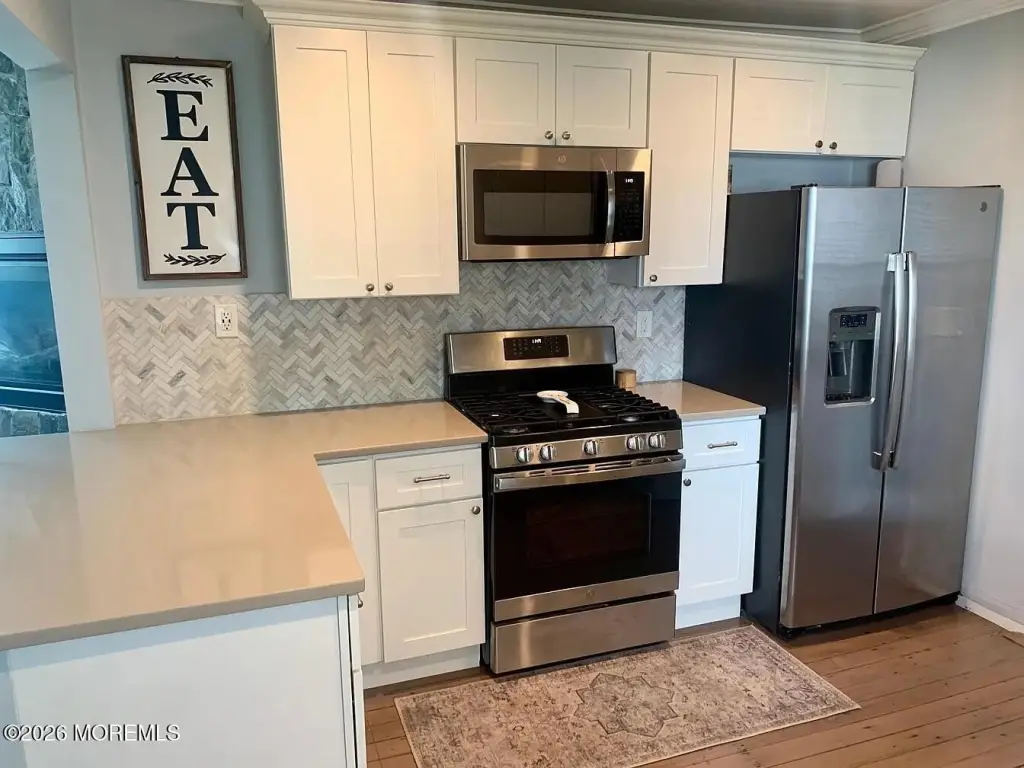
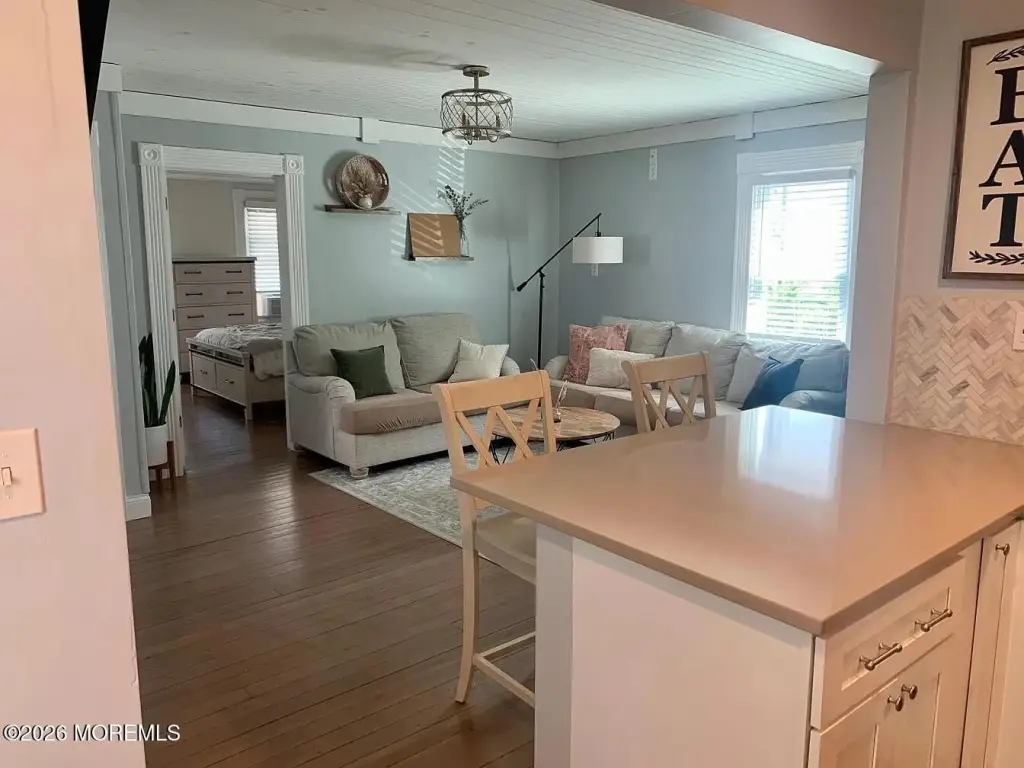
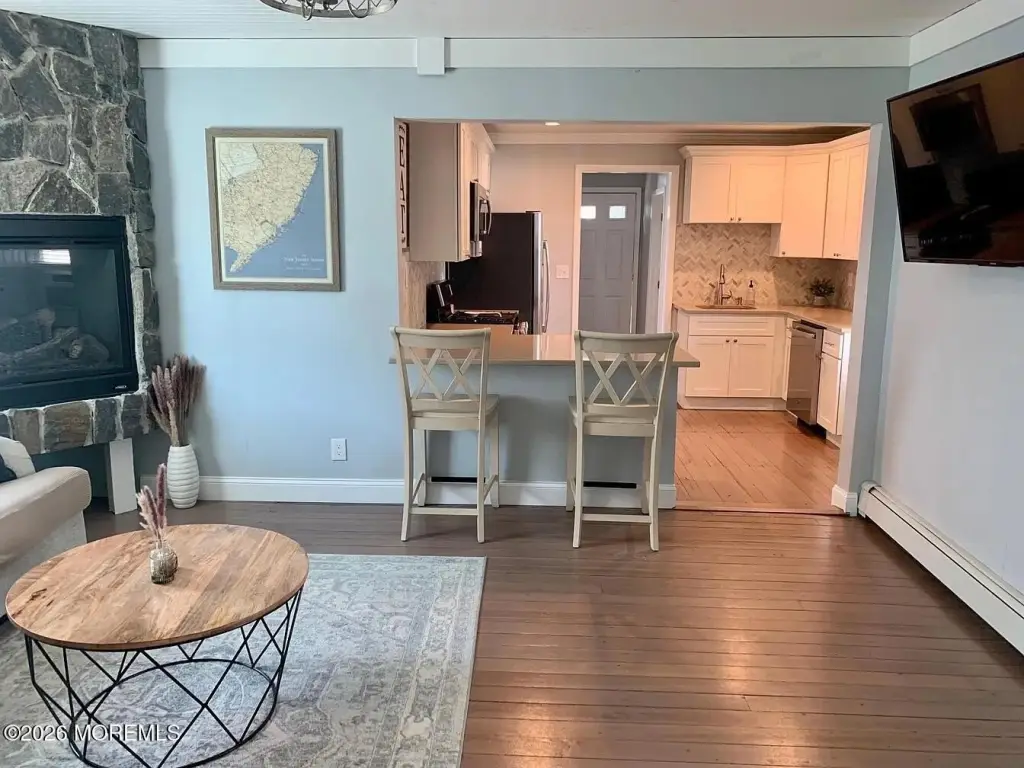
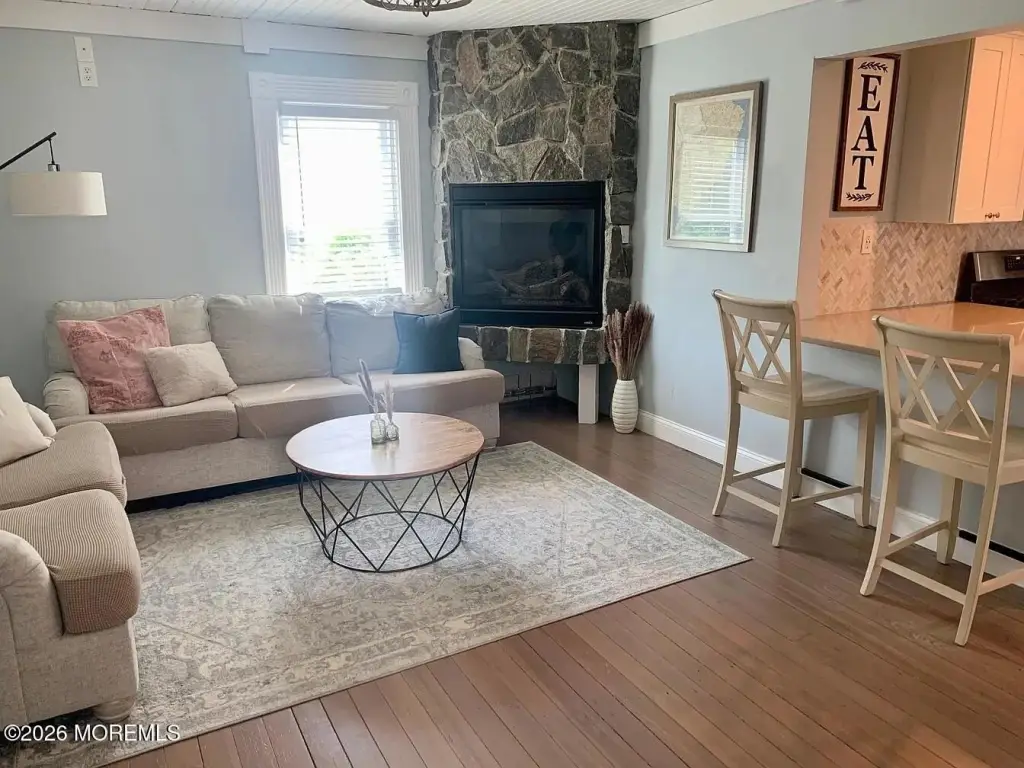
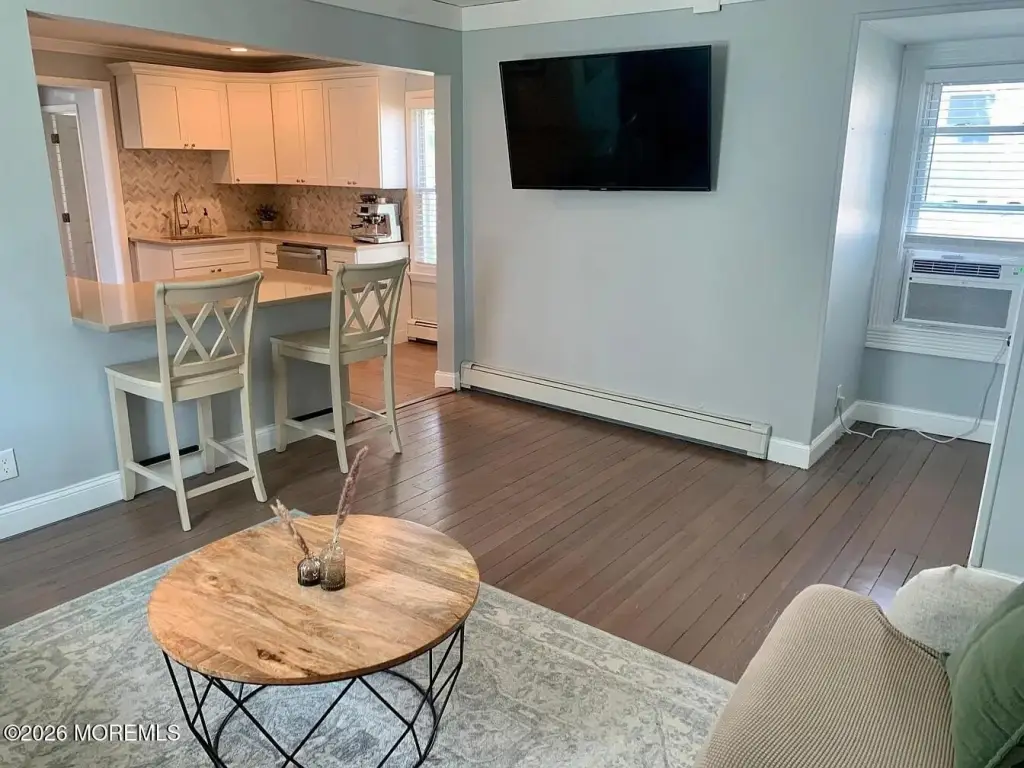
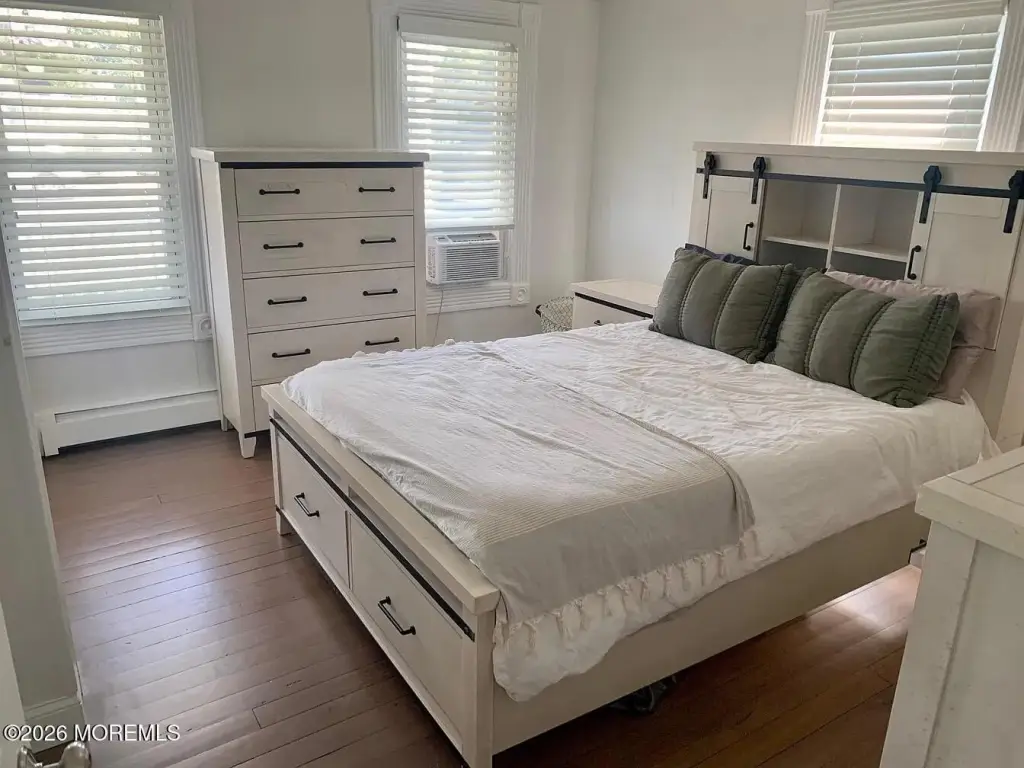
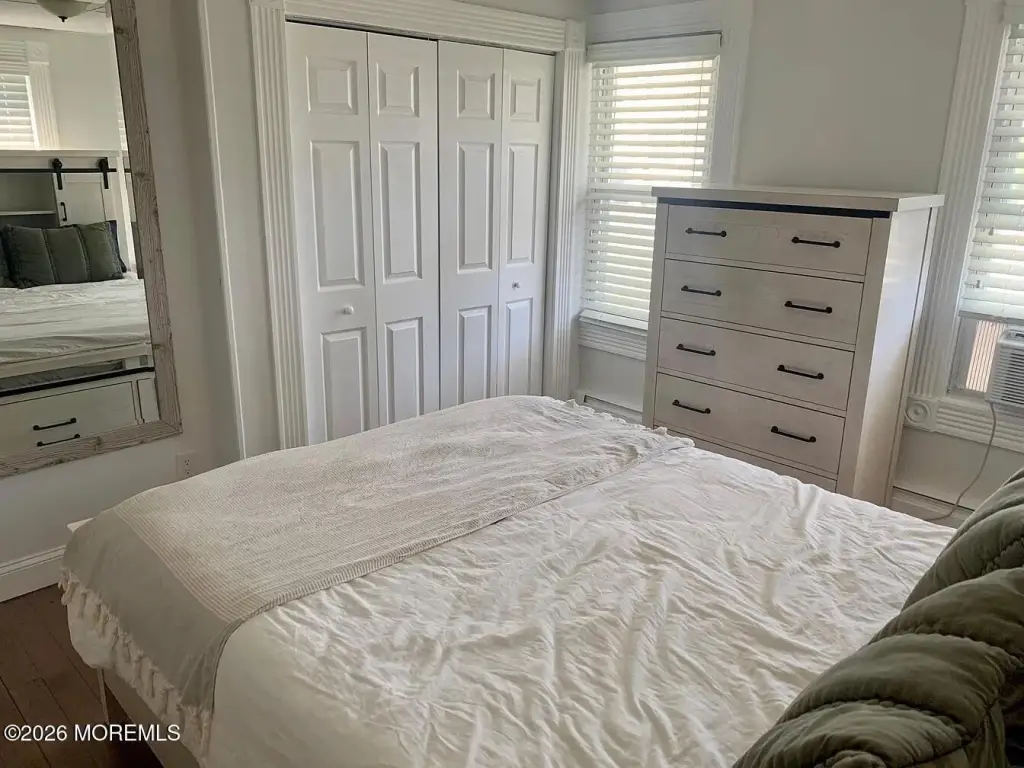
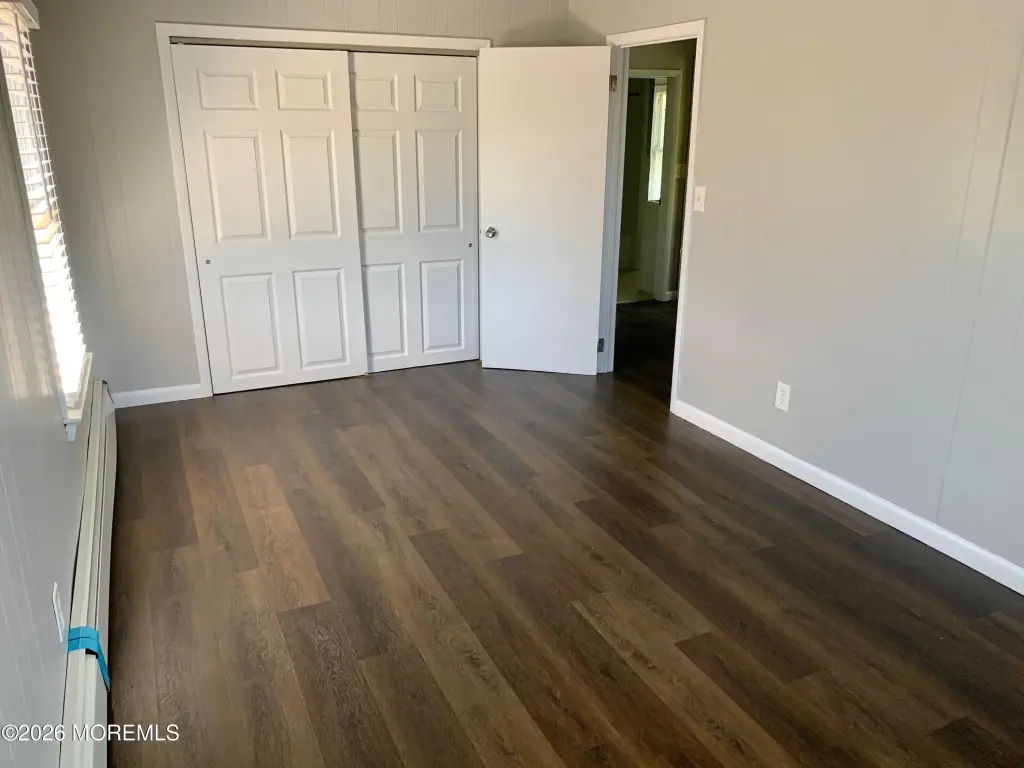
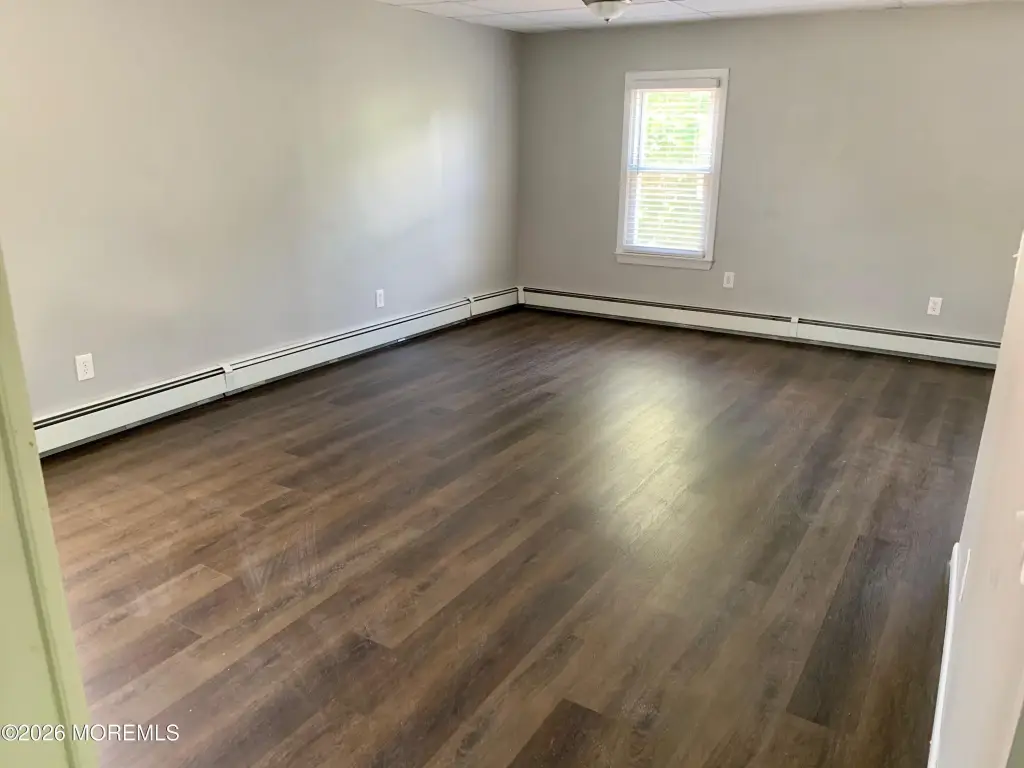
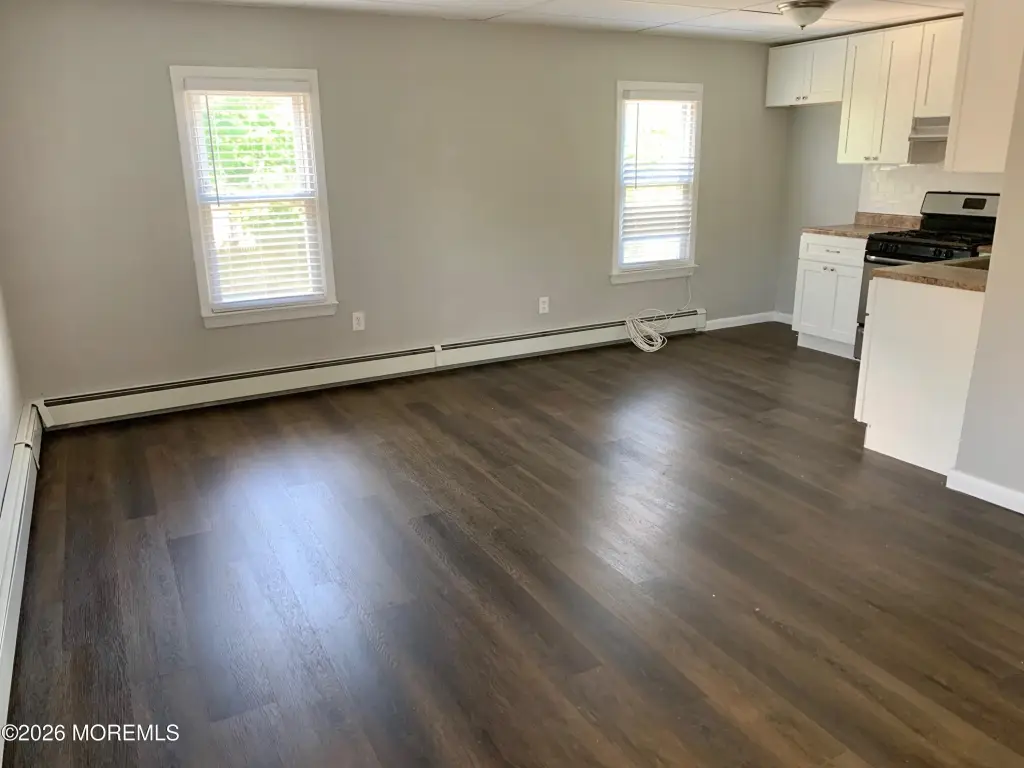
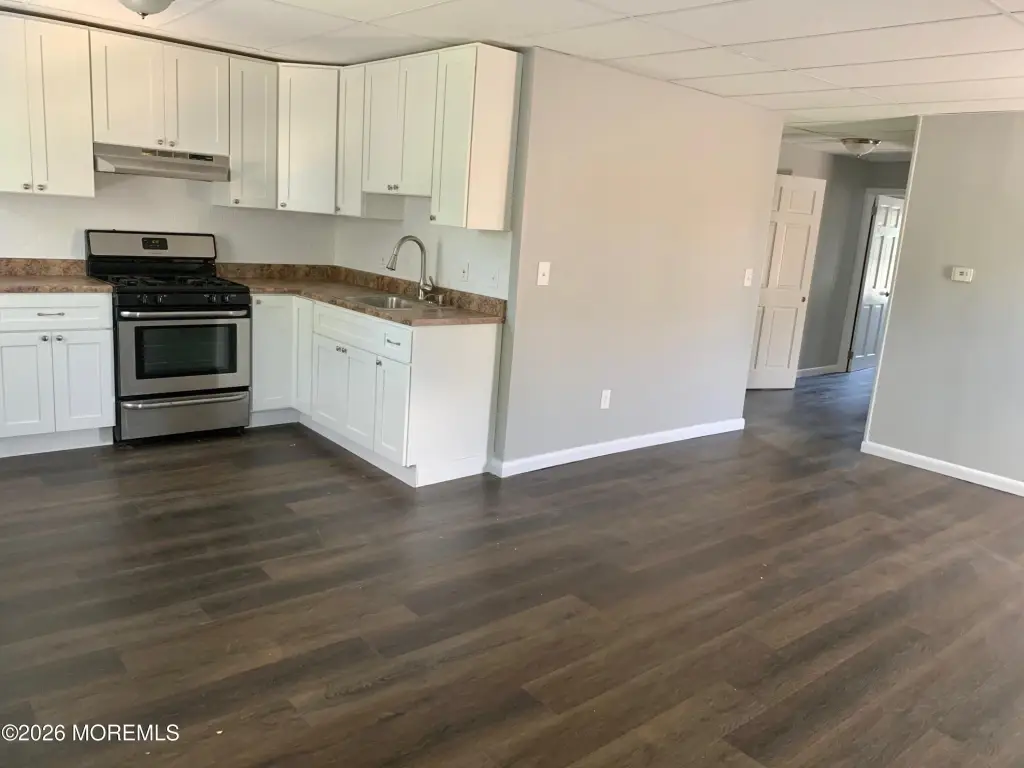
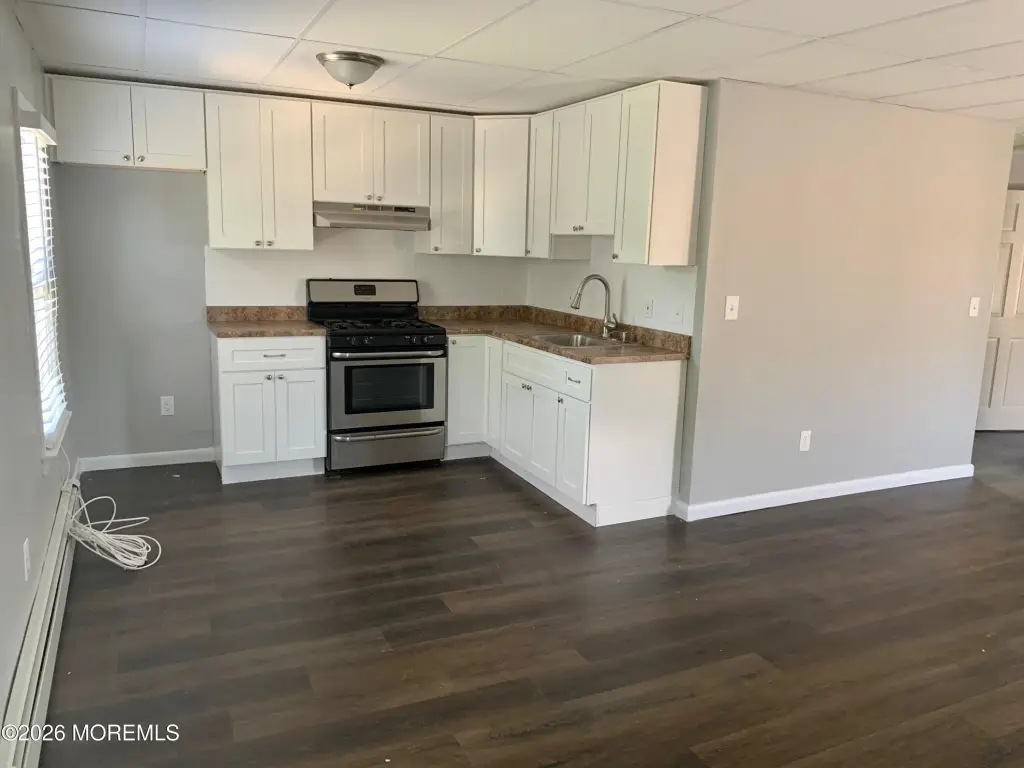
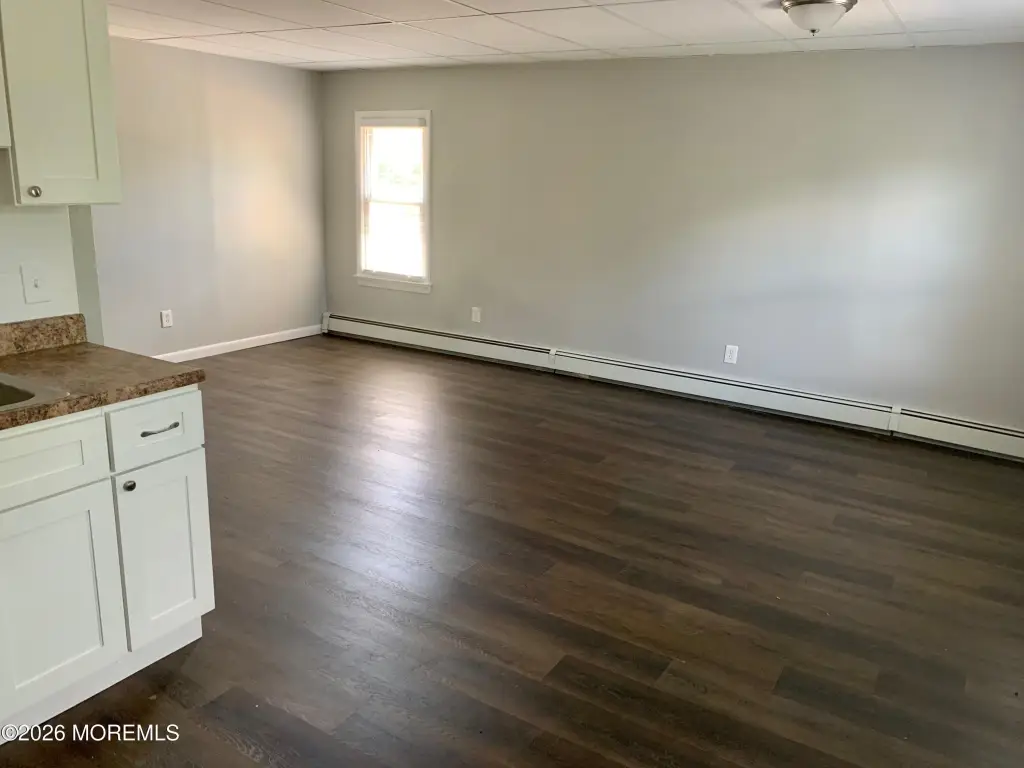
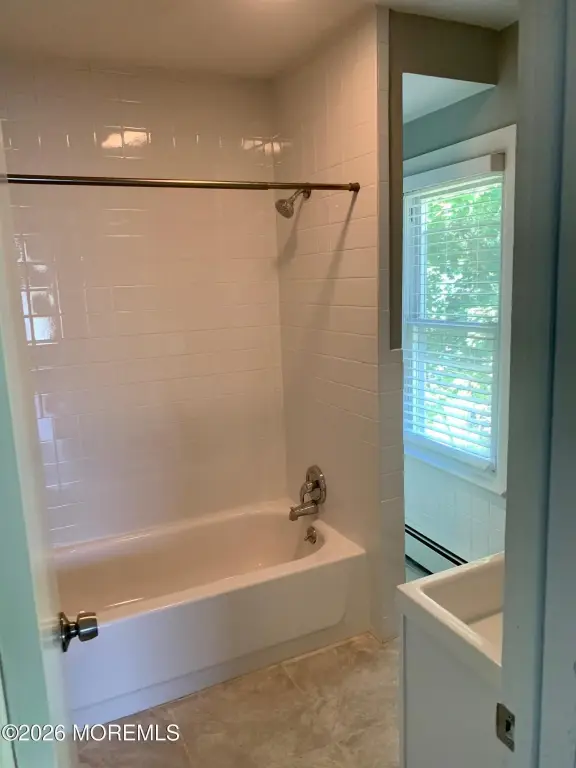
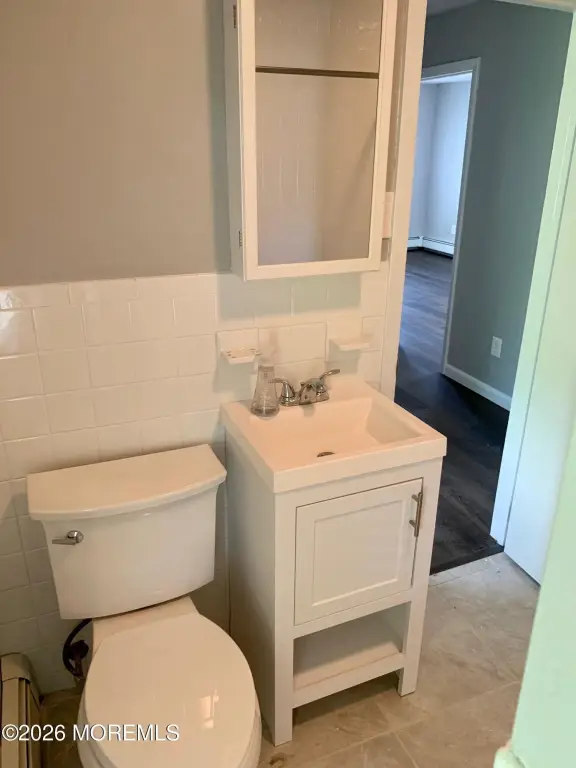
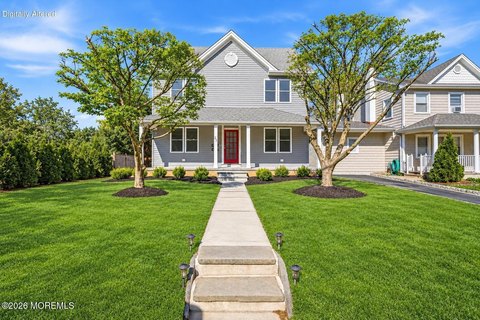
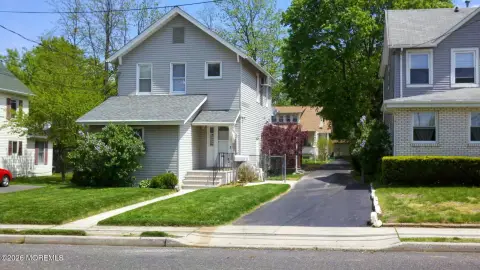
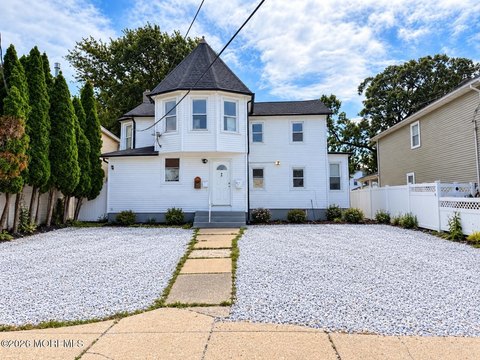
This 1,740-square-foot duplex was built in 1910 and is configured across two stories with 3 bedrooms, 2 full baths, and two kitchens. The property also includes a partially finished basement, an open front porch, a spacious patio, and a storage shed. Baseboard heating, multi-unit cooling, public water, and public sewer serve the property.
Positioned on a 0.19-acre lot at 264 West End Avenue in Long Branch, the tenant-occupied building provides an existing residential income configuration. Its proximity to beaches, the boardwalk, Pier Village, Monmouth University, Monmouth Medical Center, schools, shopping, dining, and the NJ Transit North Jersey Coast Line places a range of established coastal-area amenities and transportation options nearby.
Positioned on a 0.19-acre lot at 264 West End Avenue in Long Branch, the tenant-occupied building provides an existing residential income configuration. Its proximity to beaches, the boardwalk, Pier Village, Monmouth University, Monmouth Medical Center, schools, shopping, dining, and the NJ Transit North Jersey Coast Line places a range of established coastal-area amenities and transportation options nearby.
Key Highlights
- Two‑story duplex with 3 bedrooms, 2 full baths, and two kitchens
- 1,740 square feet on a 0.19‑acre lot
- Tenant‑occupied residential income property
Financial Insights
Estimated NOI and Cap Rate
NOI / Yr
$29,121
Cap Rate
3.24%
Suggested Prices Based on Cap Rates
Cap Rate 5%
$582,420
$582.4K
Cap Rate 7%
$416,014
$416.0K
Cap Rate 9%
$323,567
$323.6K
Market Conditions
NOI Build-Up for 1,740 SF
Gross rent
$44.5K $25.56/SF
− Vacancy
−$2.9K −$1.65/SF
EGI
$41.6K $23.91/SF
− OpEx
−$12.5K −$7.17/SF
NOI
$29.1K $16.74/SF
Area
Monmouth County, NJ
Vacancy
6.46%
Lease Rate
$25.56 /SF/Yr
Expense Ratio
30.00%
Simulate Cap Rate and NOI
Suggested Prices Based on Cap Rates
Cap Rate 5%
$582,420
Cap Rate 7%
$416,014
Cap Rate 9%
$323,567
Alternative Uses
Best Use
Multifamily LT 5
$416.0K
$364.0K – $485.4K
NOI $29,121 @ 7.0% cap · market cap 3.24%
Second Best
Apartment 5plus
$382.3K
$334.5K – $446.0K
NOI $26,758 @ 7.0% cap · market cap 2.98%
Theoretical Best
Office A
$454.3K
$397.6K – $530.1K
NOI $31,804 @ 7.0% cap · market cap 3.54%
Zoning and permitted uses should be independently verified with authorities.
How Realmo checks its estimates
Property Analytics
Unlock full access to Insights
Subscribe to Realmo Intelligence
Open Analytics
Current Use
Location Intelligence
Trade Area within ½ mile
1,076
Businesses Nearby
Explore this area
Business Placement
Demographics for 07740, NJ
31,905
Population
15,208
Households
2.1
Avg Household Size
38
Median Age
35%
College-Educated
84%
High-School Grad
5.3 sq mi
ZIP Area
6,020
Density / Sq Mi
$73,806
Median Household Income
$38,614
Median Earnings
$1,744
Median Rent
$521,900
Median Home Value
Check the figures for this property
Cap Rate, Value Estimation, Potential NOI and more
View Realmo Analytics
Market
Vacancy Rate% for Multifamily in Northeast region

Questions? Ask Rey
Realmo’s AI knows this listing — price, zoning, demand, history. Ask anything.




Frequently Asked Questions
What type of property is this?
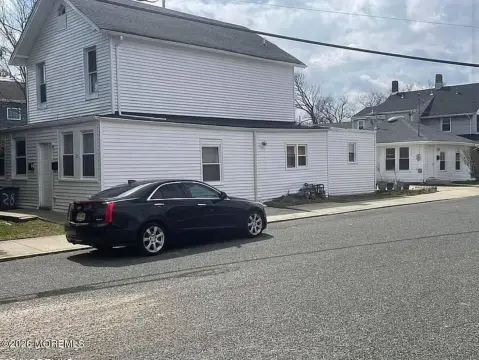
Duplex - Tenant-occupied two-story duplex with a partially finished basement, porch, patio, and storage shed.
Where is this duplex located?
The property is located at 264 West End Avenue Long Branch, NJ.
What is the asking price?
The asking price for this property is $899,000.
What are key features of this property?
This property features: Two‑story duplex with 3 bedrooms, 2 full baths, and two kitchens; 1,740 square feet on a 0.19‑acre lot; Tenant‑occupied residential income property


