Historic Downtown Office
For Sale
$699,000
2606 8th St, Tuscaloosa, AL 35401
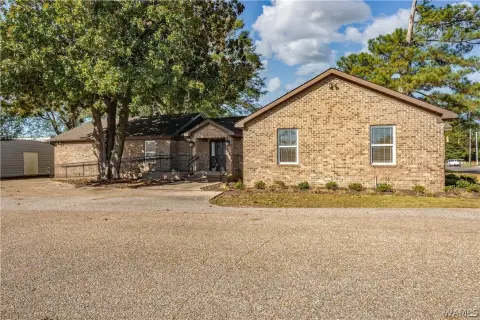
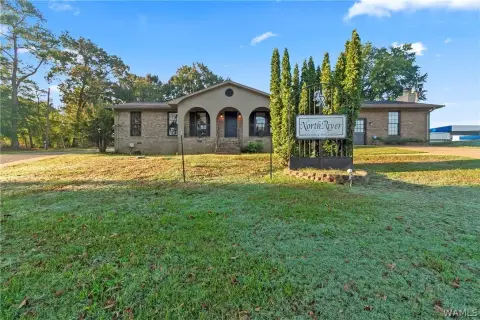
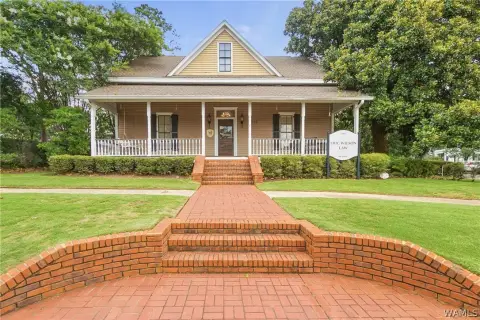
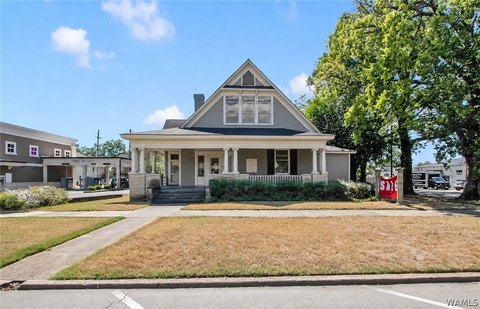
Historic office building totaling about 6,000 SF, currently occupied by a law firm with dedicated and on-street parking.
Property Size2,140 SF
Price / SF$326.64
Days on Market186
Property Features for 2606 8th St
General Information
Standard status
Active
Size
2,140 SF
Total Parking Spaces
10
Zoning
BC
Taxes and HOA fees
Annual Taxes
$3,200
Building Details
Year Built
1832
Tenancy
Single
Listing Agency:
Harwood Real Estate LLC
(205) 764-1637
Listed By:
Richard Harwood · License #118535018
(205) 799-2210
Source:
Exprealty
Added: Apr 12
Changed: Sep 5
Last Checked: Oct 13 at 12:43AM
Displayed information is deemed reliable but is not guaranteed and should be independently verified. All listing content including descriptions, pricing, images are the copyrighted material of Harwood Real Estate LLC
Investment Insights
Based on property information with market context.
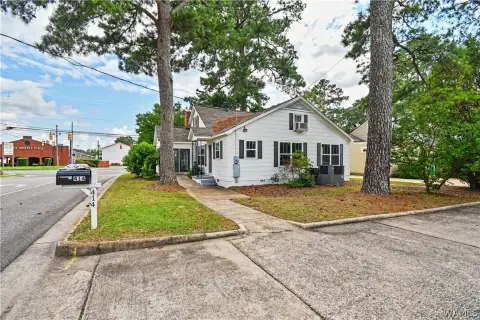
This historic downtown office building was built in 1832 and has undergone multiple renovations. The property is currently occupied by a law firm and features central heating and air with electric service and three units. The building is situated on a corner and includes 10+ dedicated parking spaces in addition to on-street parking.
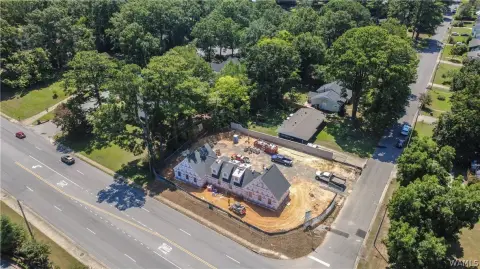
The site is located in Downtown Tuscaloosa on the corner of Lurleen Wallace Blvd. S and 8th Street. Presently zoned BC.
The owner will consider a leaseback from the purchaser if desired.
The site is located in Downtown Tuscaloosa on the corner of Lurleen Wallace Blvd. S and 8th Street. Presently zoned BC.
The owner will consider a leaseback from the purchaser if desired.
Key Highlights
- Historic office building totaling about 6,000 SF in downtown Tuscaloosa
- Located on the corner of Lurleen Wallace Blvd. S and 8th Street
- Currently occupied by a law firm
Financial Insights
Estimated NOI and Cap Rate
NOI / Yr
$24,788
Cap Rate
3.55%
Suggested Prices Based on Cap Rates
Cap Rate 5%
$495,760
$495.8K
Cap Rate 7%
$354,114
$354.1K
Cap Rate 9%
$275,422
$275.4K
Market Conditions
NOI Build-Up for 2,140 SF
Gross rent
$42.4K $19.80/SF
− Vacancy
−$9.3K −$4.36/SF
EGI
$33.1K $15.44/SF
− OpEx
−$8.3K −$3.86/SF
NOI
$24.8K $11.58/SF
Area
Tuscaloosa, AL
Vacancy
22.00%
Lease Rate
$19.80 /SF/Yr
Expense Ratio
25.00%
Simulate Cap Rate and NOI
Suggested Prices Based on Cap Rates
Cap Rate 5%
$495,760
Cap Rate 7%
$354,114
Cap Rate 9%
$275,422
Alternative Uses
Best Use
Office B
$354.1K
$309.9K – $413.1K
NOI $24,788 @ 7.0% cap · market cap 3.55%
Second Best
—
—
no second resolved use
Theoretical Best
Office A
$514.3K
$450.0K – $600.0K
NOI $35,998 @ 7.0% cap · market cap 5.15%
Zoning and permitted uses should be independently verified with authorities.
How Realmo checks its estimates
Property Analytics
Unlock full access to Insights
Subscribe to Realmo Intelligence
Open Analytics
Current Use
Lease Details
Single-tenant
Tenancy
Location Intelligence
Trade Area within ½ mile
1,797
Businesses Nearby
Explore this area
Business Placement
Demographics for 35401, AL
41,852
Population
19,517
Households
2.1
Avg Household Size
26
Median Age
27%
College-Educated
85%
High-School Grad
40.1 sq mi
ZIP Area
1,044
Density / Sq Mi
$30,031
Median Household Income
$13,041
Median Earnings
$911
Median Rent
$141,100
Median Home Value
Check the figures for this property
Cap Rate, Value Estimation, Potential NOI and more
View Realmo Analytics
Market
Vacancy Rate% for Office in South region

Questions? Ask Rey
Realmo’s AI knows this listing — price, zoning, demand, history. Ask anything.



Frequently Asked Questions
What type of property is this?
Office building - Historic office building totaling about 6,000 SF, currently occupied by a law firm with dedicated and on-street parking.
Where is this office building located?
The property is located at 2606 8th St Tuscaloosa, AL.
What is the asking price?
The asking price for this property is $699,000.
What are key features of this property?
This property features: Historic office building totaling about 6,000 SF in downtown Tuscaloosa; Located on the corner of Lurleen Wallace Blvd. S and 8th Street; Currently occupied by a law firm


