Brick Mixed-Use Property with
For Sale
$1,475,000
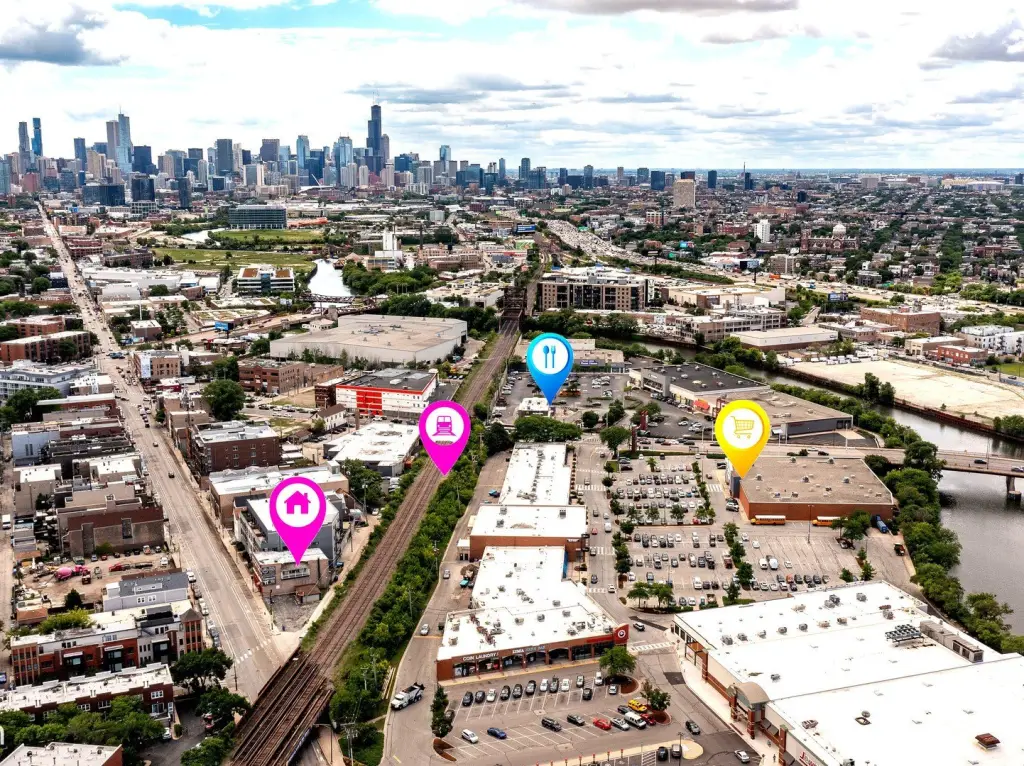
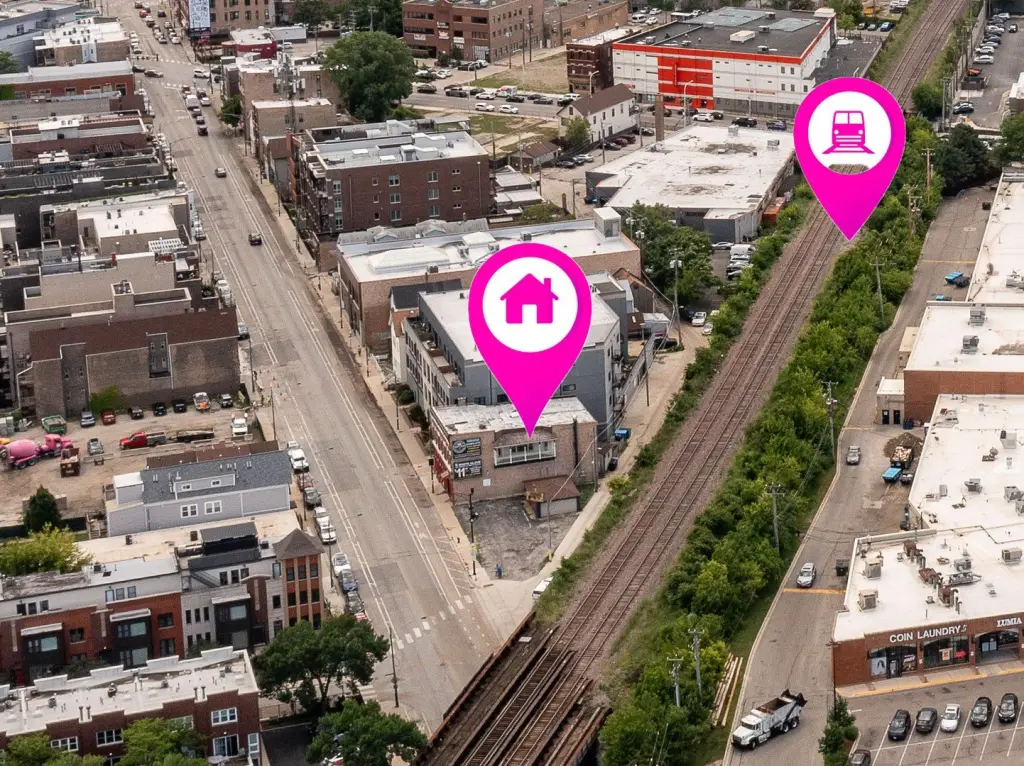
2506 N Clybourn Avenue, Chicago, IL 60614
Commercial Sale, Chicago, IL
Property Size5,500 SF
Lot Size0.23 Acres
Price / SF$268.18
Days on Market112
Property Features for 2506 N Clybourn Avenue
General Information
Property type
Commercial Sale
Property subtype
Other
Zoning
COMMR
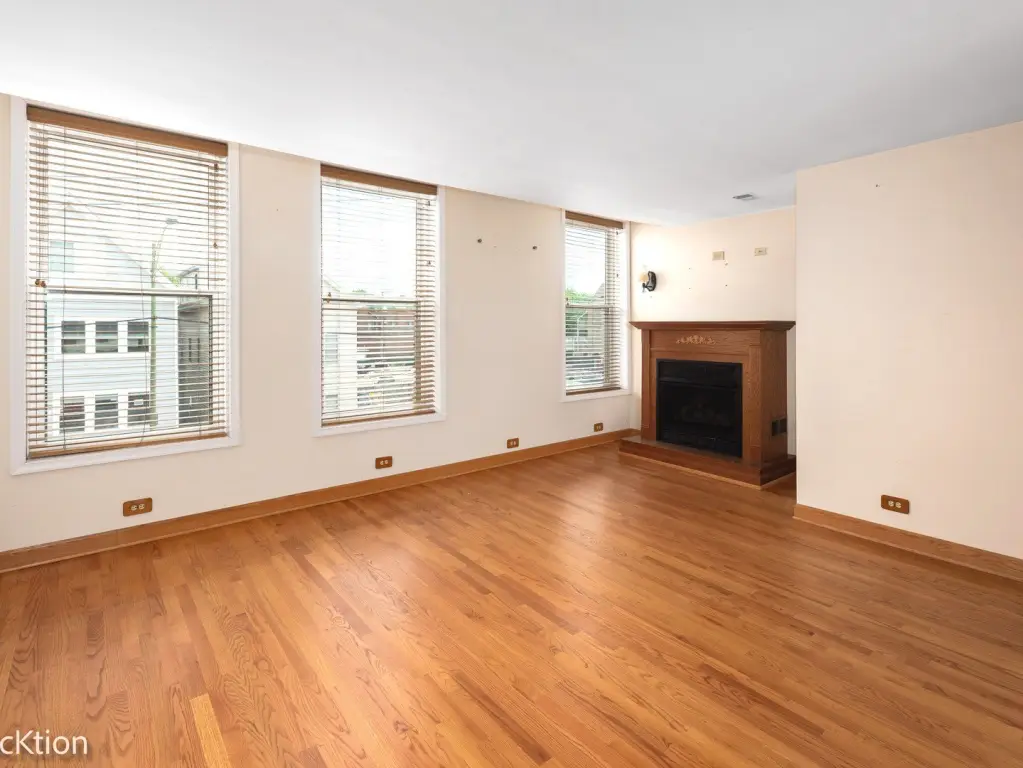
Fireplace
1
Directions
Heading West on Fullerton go North on Clybourn Ave to 2506
Subdivision
CHI - Lincoln Park
Standard status
Active
APN
14304000020000
Lot size
0.23 Acres
Taxes and HOA fees
Tax Year
2024
Tax Annual Amount
34719
Utilities
Utilities
Water Available
Cooling system
Window Unit(s), Central Air
Amenities
fireplace
balcony
in-unit laundry
garage
walk-in cooler
Building Details
Year built
1900
Floors in Building
2
Number of units
4
Flooring type
Wood, Vinyl
Building materials
Brick
Roof type
Membrane, Rubber
Listing Agency:
Hometown Real Estate Group LLC
(773) 625-1121
Listed By:
Brian Costello · License #475143211
(773) 870-2773
Added: Jun 19
Changed: Sep 12
Last Checked: Oct 8 at 2:06AM
MLS# 12681126
Copyright © 2026 Midwest Real Estate Data, LLC. All rights reserved. All information provided by the listing agent/broker is deemed reliable but is not guaranteed and should be independently verified.
Investment Insights
Based on property information with market context.
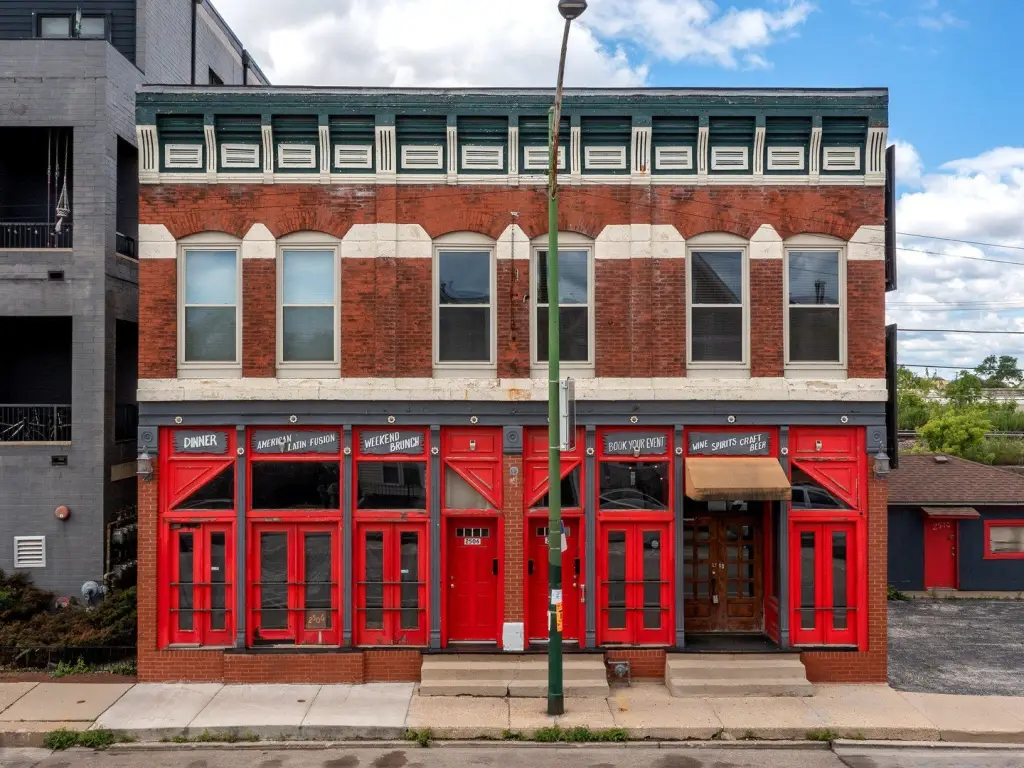
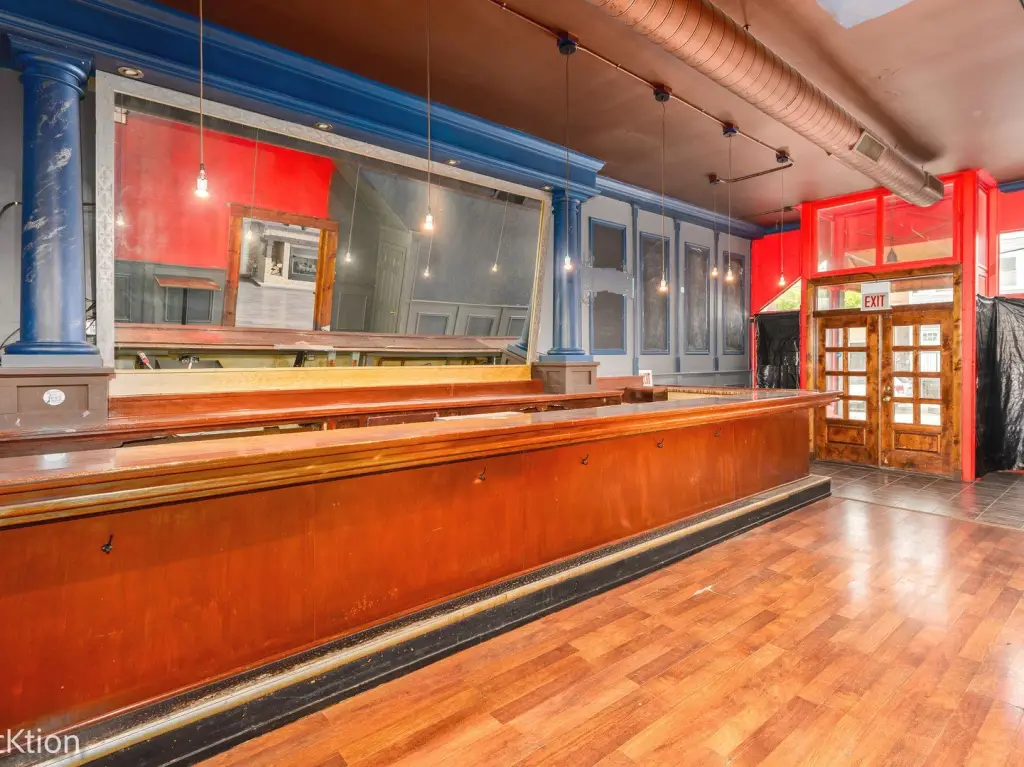
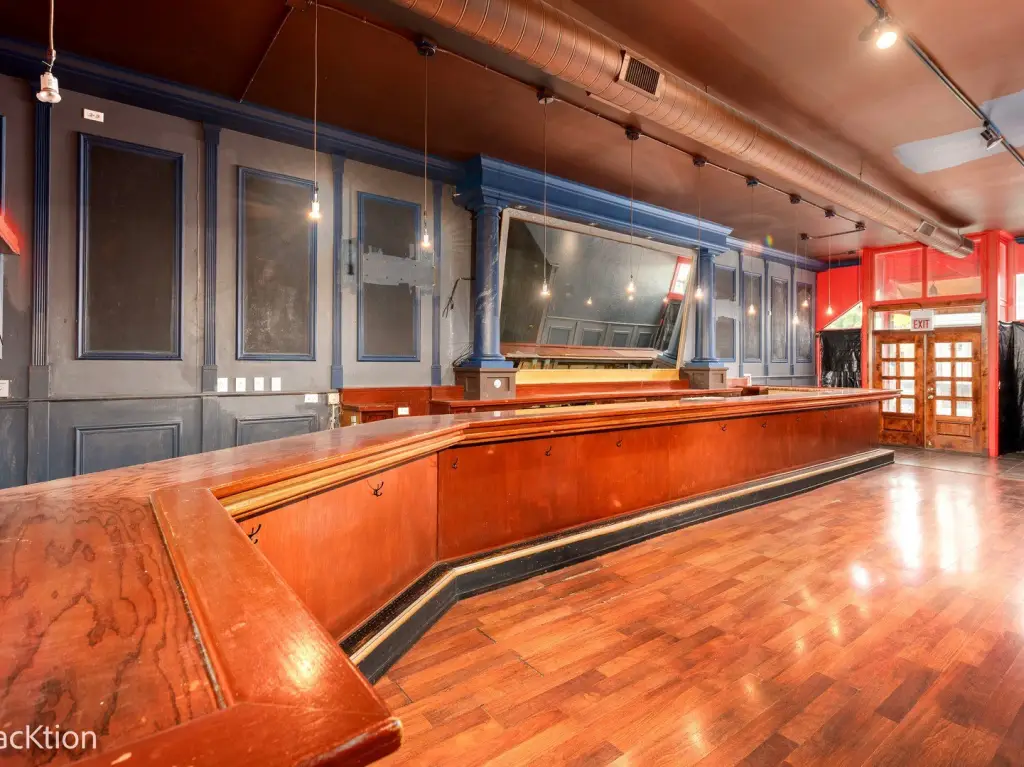
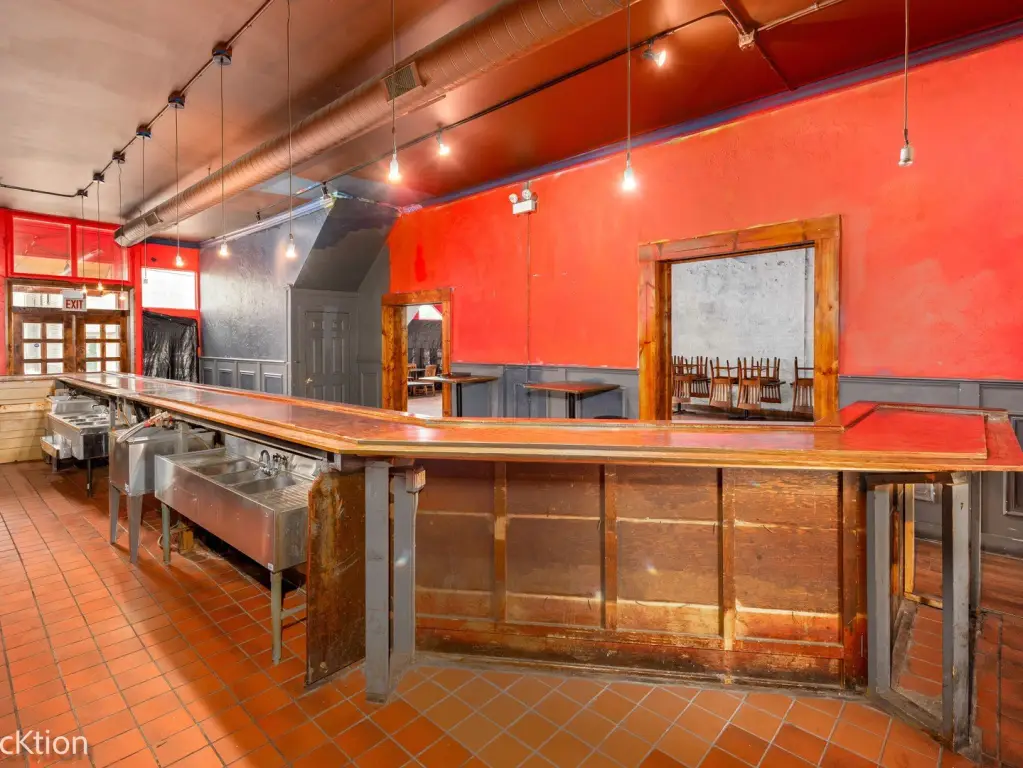
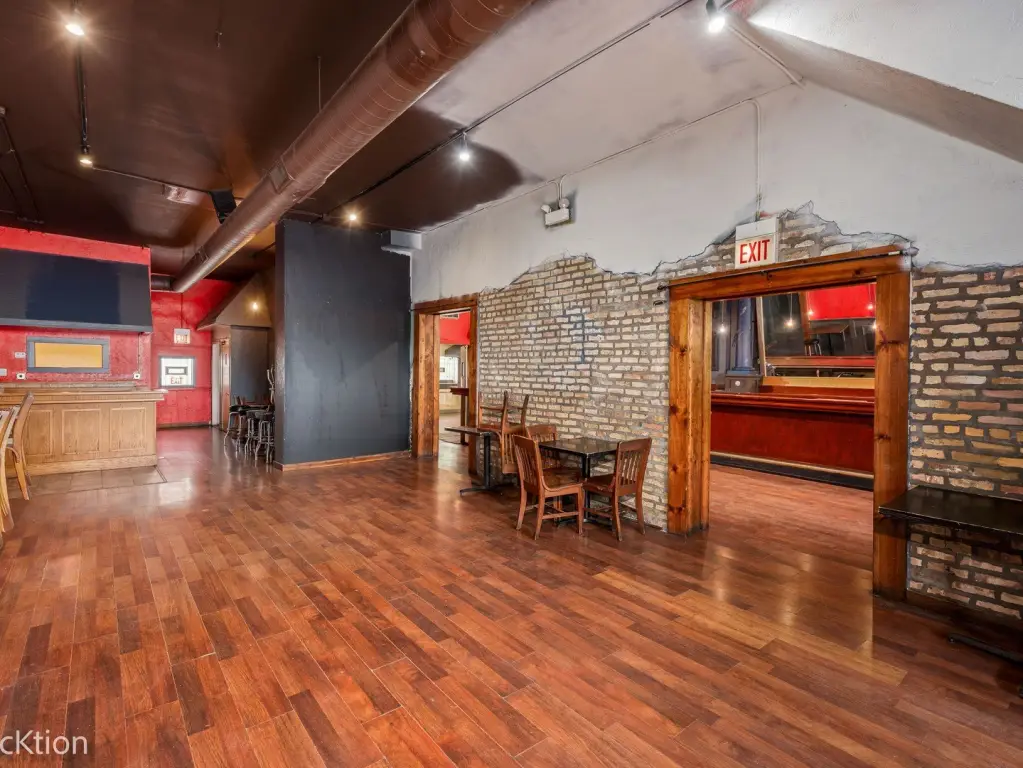
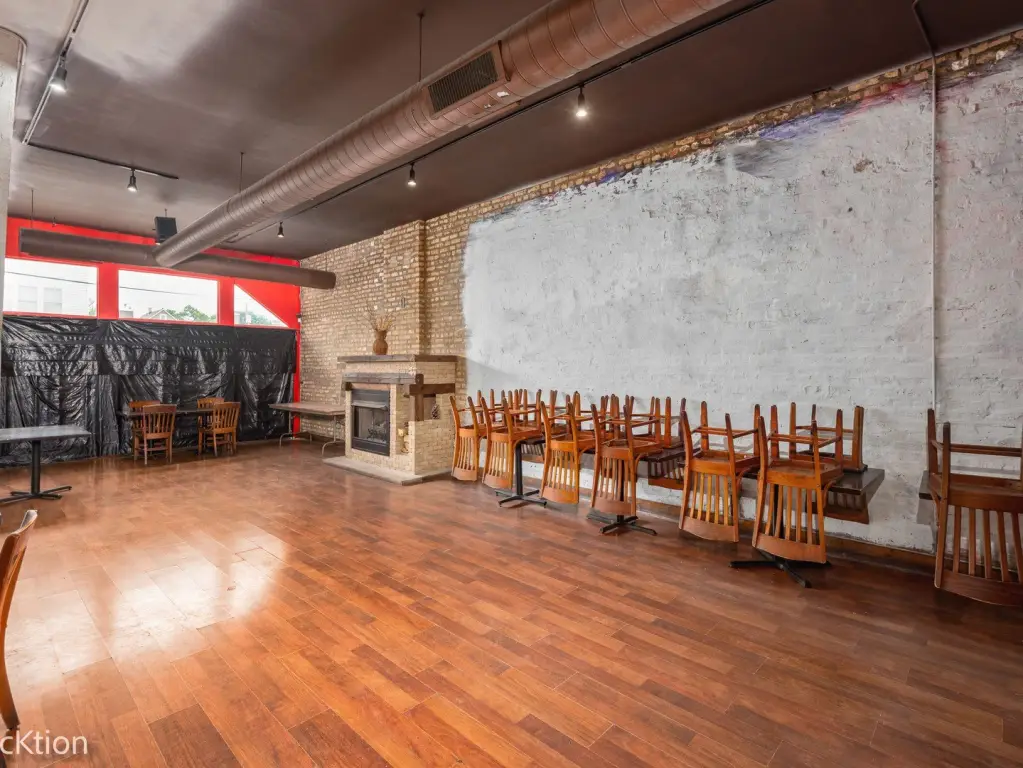
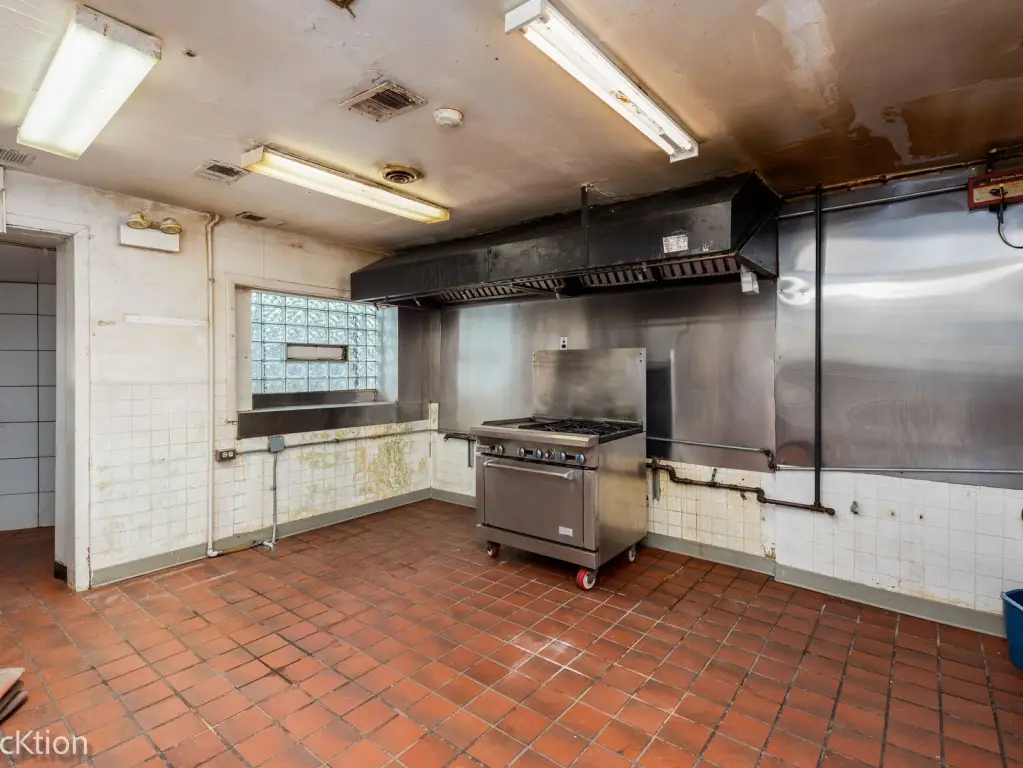
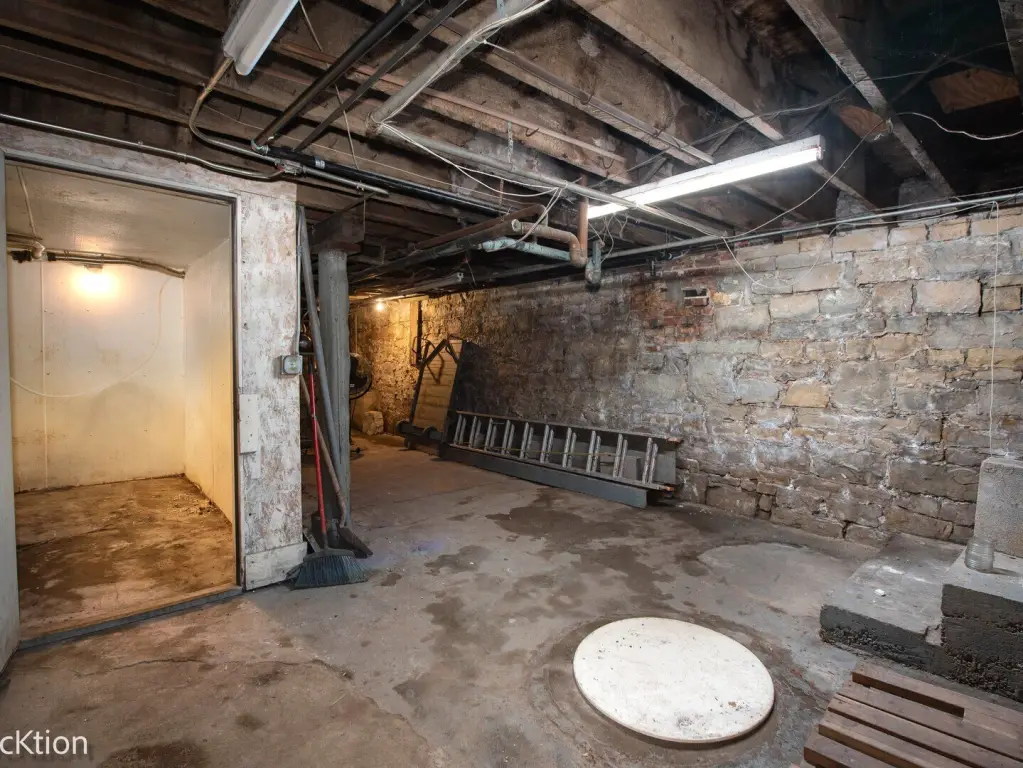
Located at 2506 N Clybourn Avenue in Chicago, this solid-brick mixed-use property contains approximately 5,500 square feet and was built in 1900. The main level offers a 2,700-square-foot restaurant and bar with exposed brick, a fireplace, two bar areas, two restrooms, and a commercial kitchen. An unfinished basement provides storage and includes a walk-in cooler.
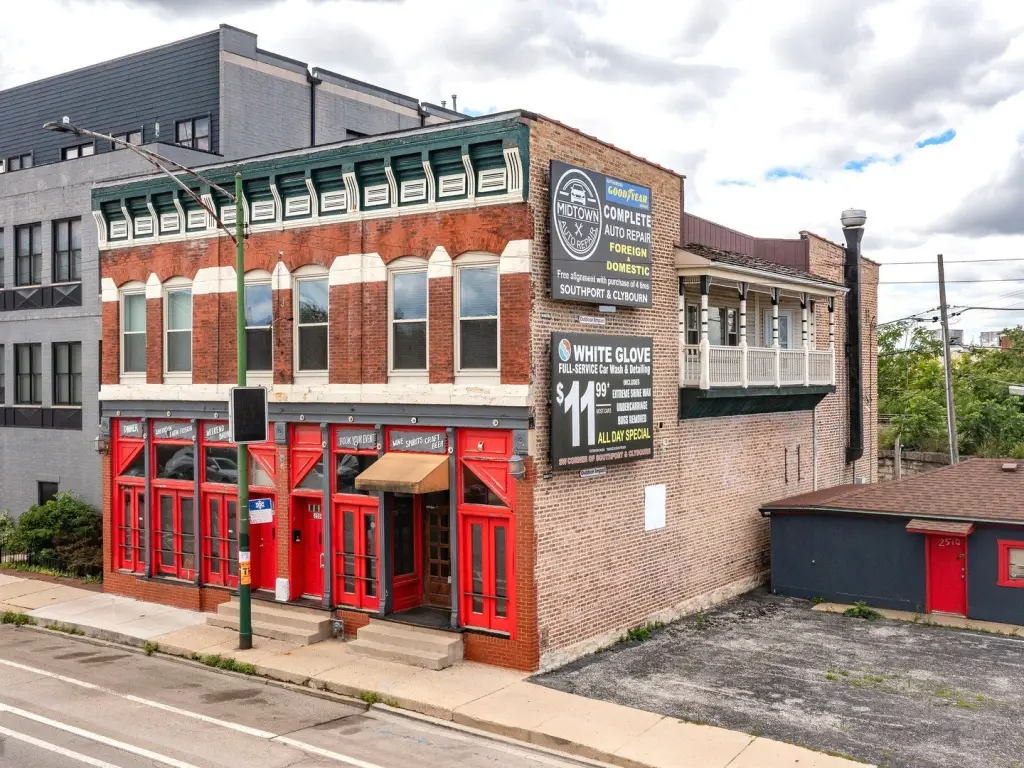
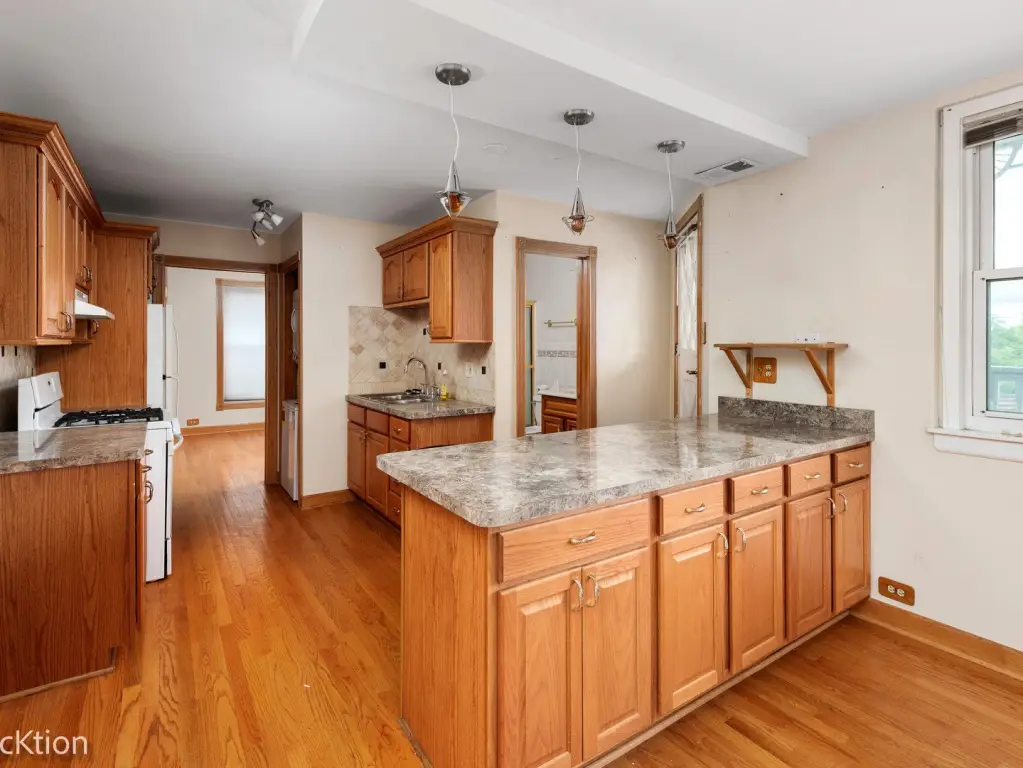
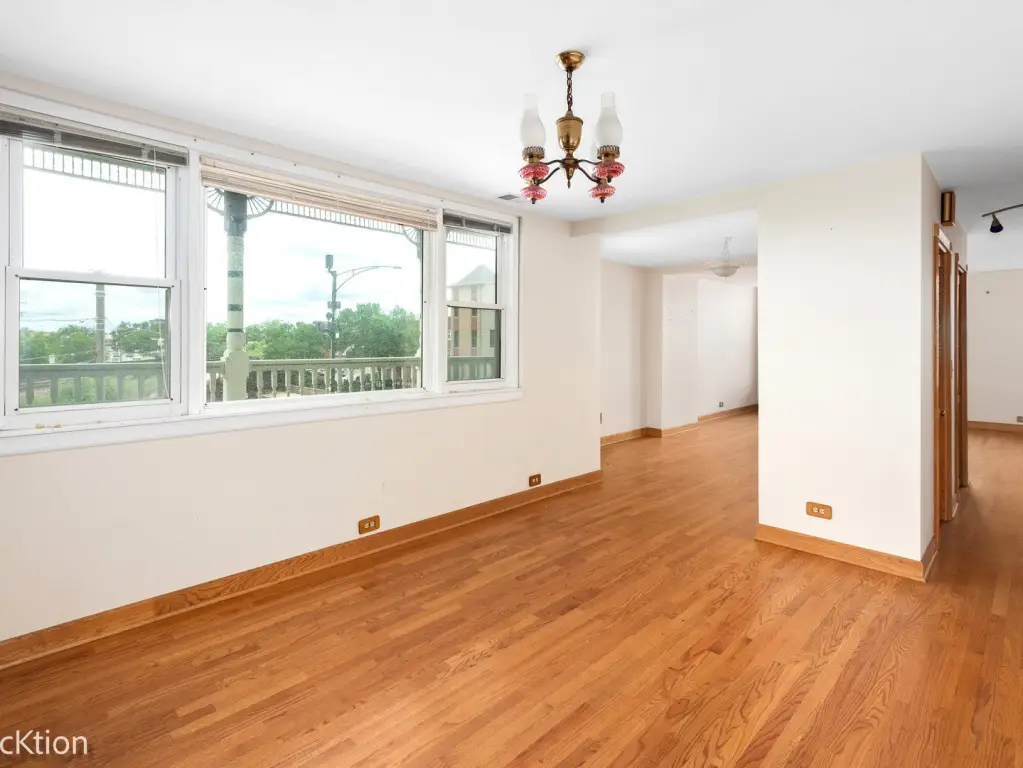
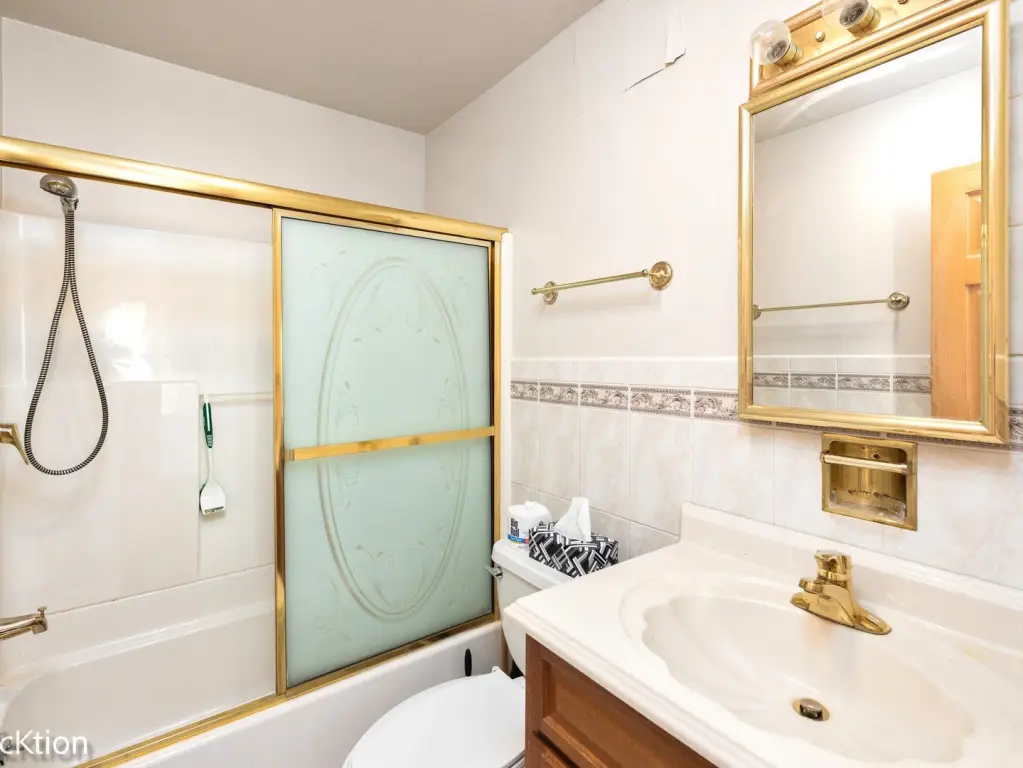
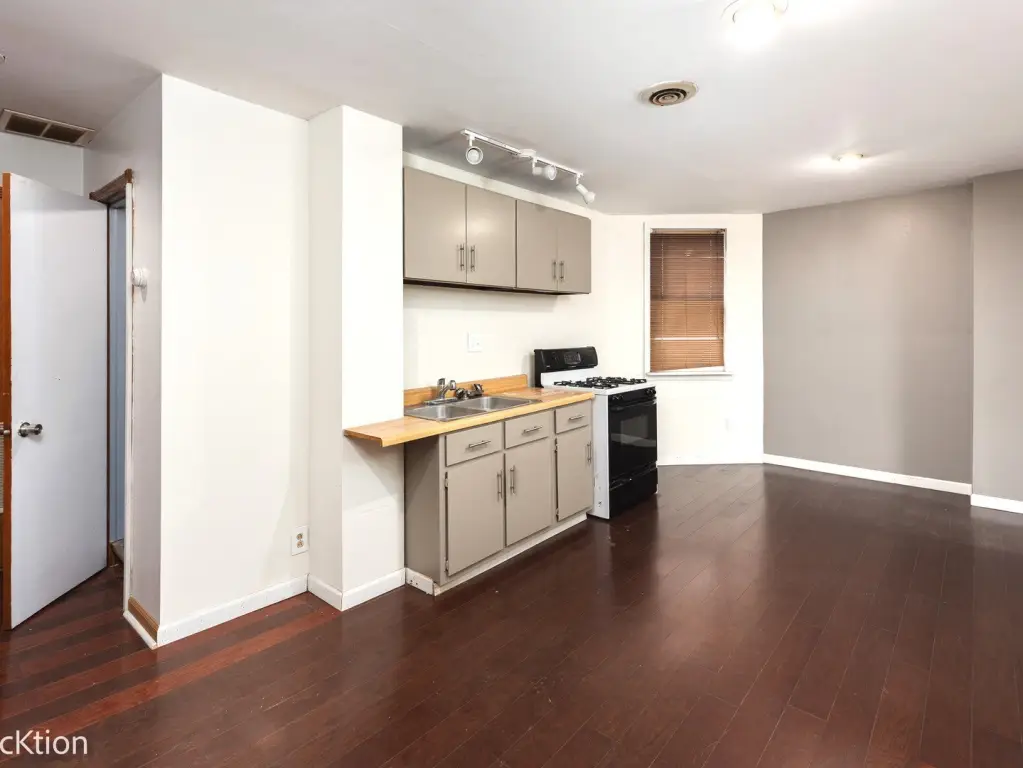
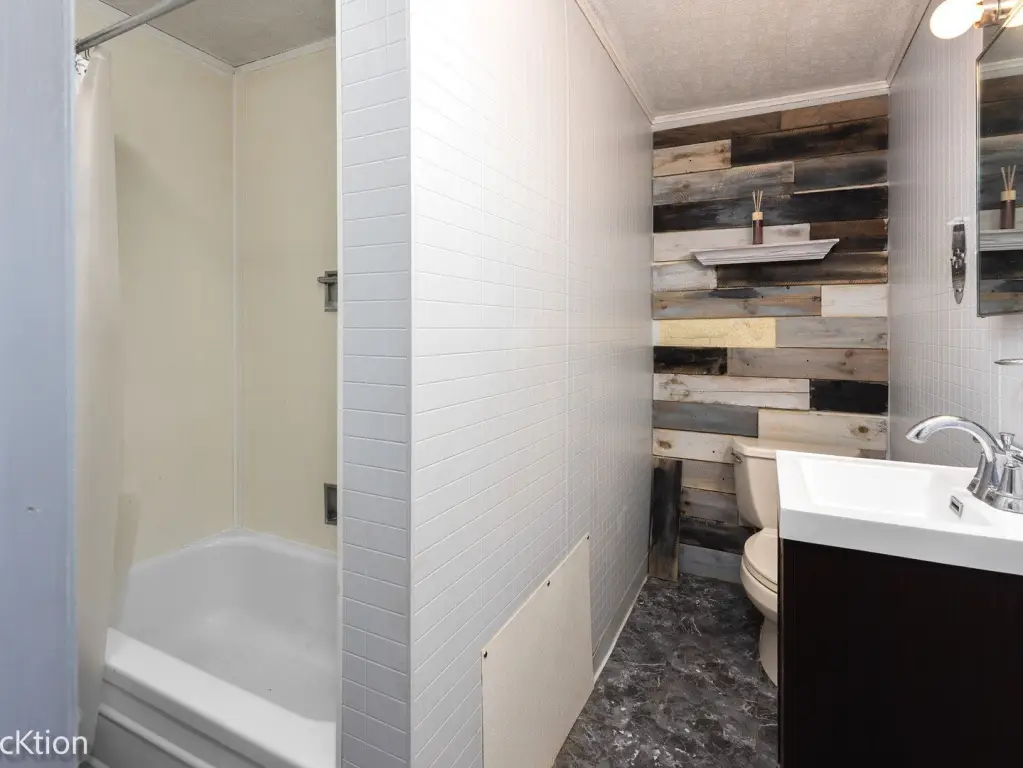
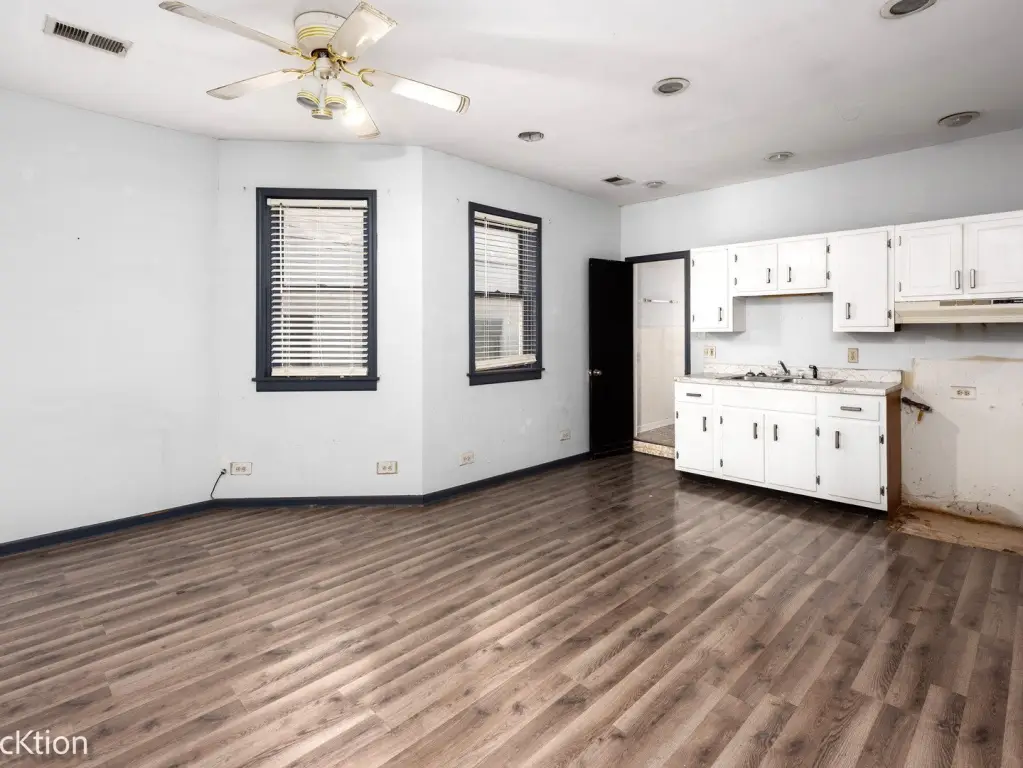
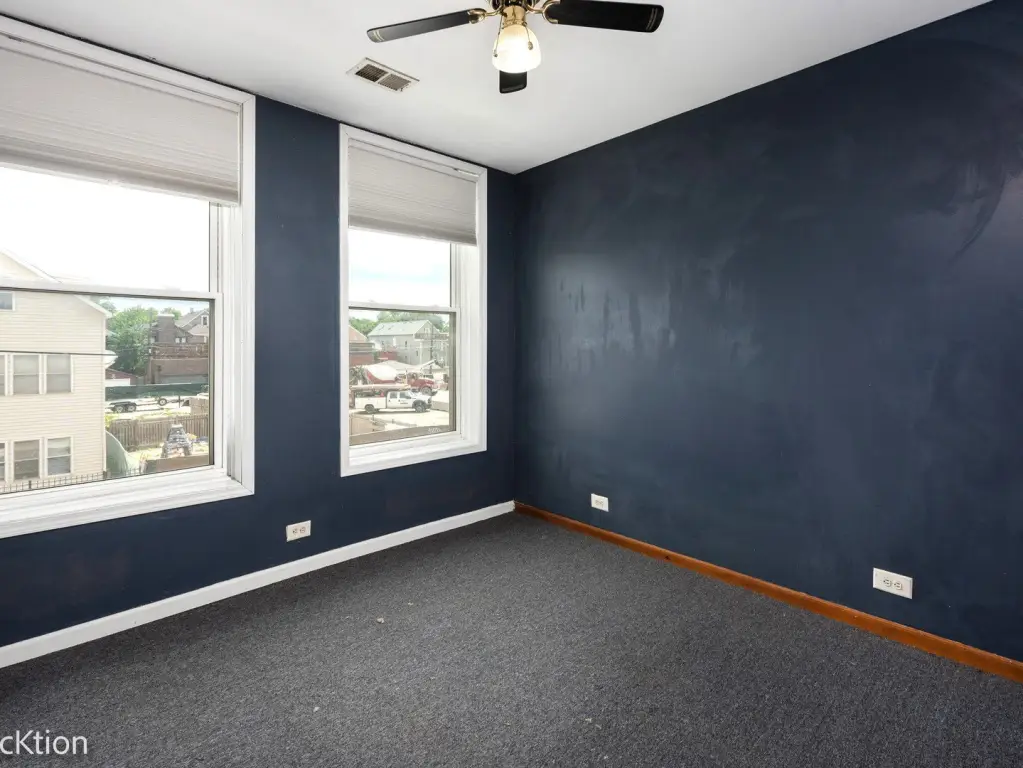
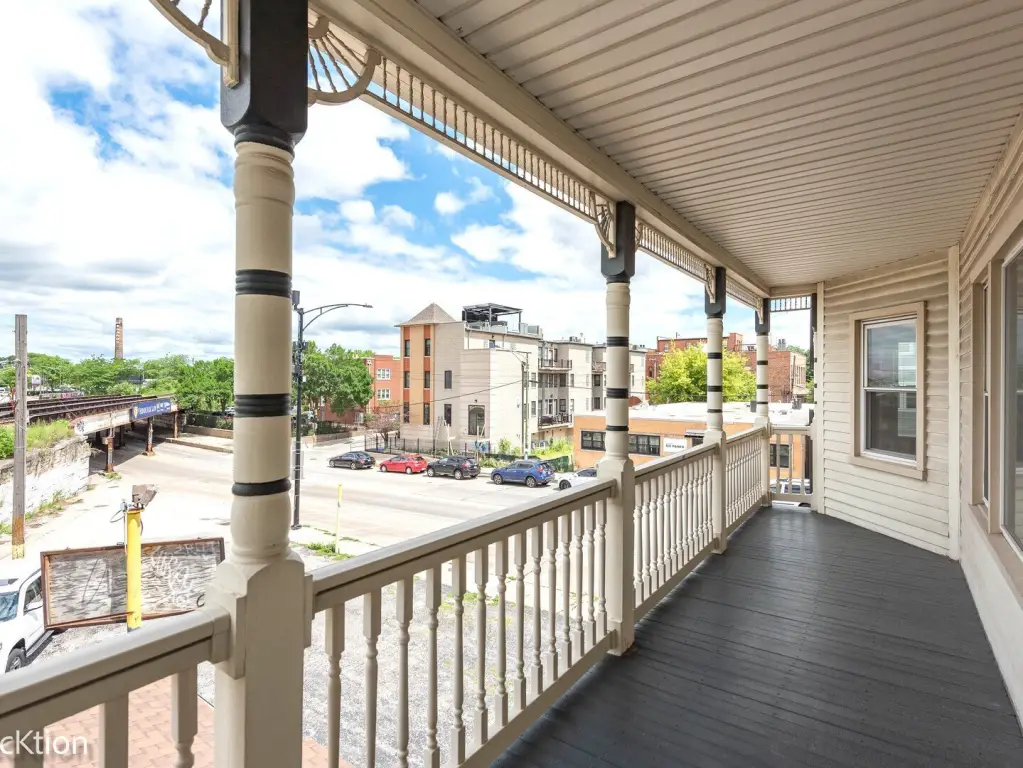
The second floor includes a one-bedroom owner’s apartment with a fireplace, full bathroom, in-unit laundry, and private balcony, along with a two-bedroom apartment and a non-conforming one-bedroom apartment. Exterior features include a detached two-plus-car garage, private patio, and space for approximately 10–12 vehicles. The property is currently vacant and is being sold as-is, allowing the next owner to renovate, occupy, or lease the building.
The second floor includes a one-bedroom owner’s apartment with a fireplace, full bathroom, in-unit laundry, and private balcony, along with a two-bedroom apartment and a non-conforming one-bedroom apartment. Exterior features include a detached two-plus-car garage, private patio, and space for approximately 10–12 vehicles. The property is currently vacant and is being sold as-is, allowing the next owner to renovate, occupy, or lease the building.
Key Highlights
- Approximately 5,500 SF mixed‑use building on a 0.2296‑acre lot
- 2,700‑square‑foot restaurant and bar with commercial kitchen, two bars, fireplace, and two restrooms
- Three residential units: one 1‑bedroom owner’s apartment, one 2‑bedroom apartment, and one non‑conforming 1‑bedroom apartment
Financial Insights
Estimated NOI and Cap Rate
NOI / Yr
$102,366
Cap Rate
6.94%
Suggested Prices Based on Cap Rates
Cap Rate 5%
$2,047,320
$2.0M
Cap Rate 7%
$1,462,371
$1.5M
Cap Rate 9%
$1,137,400
$1.1M
Market Conditions
NOI Build-Up for 5,500 SF
Gross rent
$145.2K $26.40/SF
− Vacancy
−$8.7K −$1.58/SF
EGI
$136.5K $24.82/SF
− OpEx
−$34.1K −$6.20/SF
NOI
$102.4K $18.61/SF
Area
Chicago, IL
Vacancy
6.00%
Lease Rate
$26.40 /SF/Yr
Expense Ratio
25.00%
Simulate Cap Rate and NOI
Suggested Prices Based on Cap Rates
Cap Rate 5%
$2,047,320
Cap Rate 7%
$1,462,371
Cap Rate 9%
$1,137,400
Alternative Uses
Best Use
Specialty Retail
$1.46M
$1.28M – $1.71M
NOI $102,366 @ 7.0% cap · market cap 6.94%
Second Best
Mixed Use
$1.33M
$1.16M – $1.55M
NOI $92,813 @ 7.0% cap · market cap 6.29%
Theoretical Best
Office A
$2.59M
$2.27M – $3.03M
NOI $181,526 @ 7.0% cap · market cap 12.31%
Zoning and permitted uses should be independently verified with authorities.
Property Analytics
Unlock full access to Insights
Subscribe to Realmo Intelligence
Open Analytics
Current Use
Lease Details
3
Residential units
Location Intelligence
Trade Area within ½ mile
2,639
Businesses Nearby
Explore this area
Business Placement
Demographics for 60614, IL
73,173
Population
38,089
Households
1.9
Avg Household Size
31
Median Age
86%
College-Educated
98%
High-School Grad
3.2 sq mi
ZIP Area
22,867
Density / Sq Mi
$139,561
Median Household Income
$86,386
Median Earnings
$2,019
Median Rent
$730,700
Median Home Value
Check the figures for this property
Cap Rate, Value Estimation, Potential NOI and more
View Realmo Analytics
Market
Vacancy Rate% for Multifamily in Midwest region

Questions? Ask Rey
Realmo’s AI knows this listing — price, zoning, demand, history. Ask anything.


Frequently Asked Questions
What type of property is this?
Mixed-use property - Vacant corner building combines a restaurant and bar with three residential units, private outdoor space, and detached garage parking.
Where is this mixed-use property located?
The property is located at 2506 N Clybourn Avenue Chicago, IL.
What is the asking price?
The asking price for this property is $1,475,000.
What are key features of this property?
This property features: Approximately 5,500 SF mixed‑use building on a 0.2296‑acre lot; 2,700‑square‑foot restaurant and bar with commercial kitchen, two bars, fireplace, and two restrooms; Three residential units: one 1‑bedroom owner’s apartment, one 2‑bedroom apartment, and one non‑conforming 1‑bedroom apartment


