Mixed-Use Asset Near Crown
For Sale
$2,399,000
250 N Main St, Crown Point, IN 46307
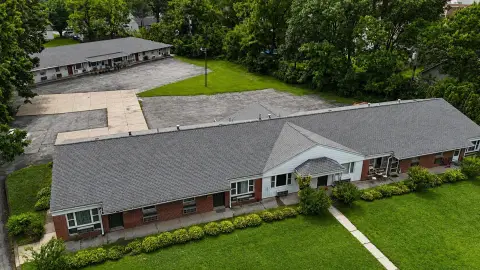
Mixed-use property with residential and commercial units near Crown Point.
Property Size12,606 SF
Price / SF$190.31
Days on Market146
Property Features for 250 N Main St
General Information
Standard status
Active
Size
12,606 SF
Taxes and HOA fees
Annual Taxes
$26,019
Listing Agency:
eXp Realty, LLC
(888) 611-3912
Listed By:
Tony Mitidiero
(708) 259-3734
Source:
Exprealty
Added: May 21
Changed: Sep 11
Last Checked: Oct 11 at 9:11AM
Displayed information is deemed reliable but is not guaranteed and should be independently verified. All listing content including descriptions, pricing, images are the copyrighted material of eXp Realty, LLC
Investment Insights
Based on property information with market context.
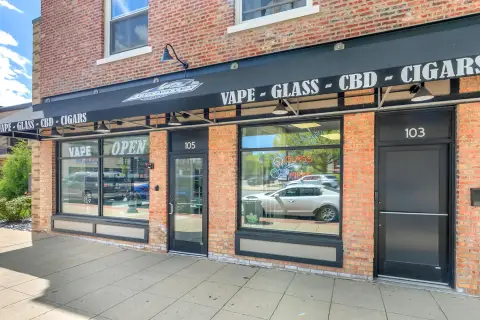
This mixed-use property is located within walking distance of Crown Point Square. Originally designed as 12 units, the property is currently configured as 16 units. It features four 1,000 sq. ft. two-bedroom residential units, each equipped with in-unit laundry. Additionally, there are twelve commercial spaces, along with a shared conference room and breakroom for the lower-level tenants. The property has undergone recent capital improvements, including the mansard roof, flat roof, windows, gutters, soffits, fascia, and the two entranceways with new aluminum wrap and new individual roofs, plus new mailboxes and a furnace pump. The building has a total size of 12,606 sq. ft. This property is positioned for a long-term investor or business owner-occupant seeking diversified income as Crown Point grows as the hub of Northwest Indiana.
Key Highlights
- Strong cash flow with great tenants in place.
- Mixed‑use property with four residential units (including in‑unit laundry) and twelve commercial spaces.
- Located in a high‑visibility corridor, 2.5 blocks from Crown Point Square.
Financial Insights
Estimated NOI and Cap Rate
NOI / Yr
$124,799
Cap Rate
5.20%
Suggested Prices Based on Cap Rates
Cap Rate 5%
$2,495,980
$2.5M
Cap Rate 7%
$1,782,843
$1.8M
Cap Rate 9%
$1,386,656
$1.4M
Market Conditions
NOI Build-Up for 12,606 SF
Gross rent
$226.9K $18.00/SF
− Vacancy
−$27.2K −$2.16/SF
EGI
$199.7K $15.84/SF
− OpEx
−$74.9K −$5.94/SF
NOI
$124.8K $9.90/SF
Area
Lake County, IN
Vacancy
12.00%
Lease Rate
$18.00 /SF/Yr
Expense Ratio
37.50%
Simulate Cap Rate and NOI
Suggested Prices Based on Cap Rates
Cap Rate 5%
$2,495,980
Cap Rate 7%
$1,782,843
Cap Rate 9%
$1,386,656
Alternative Uses
Best Use
Mixed Use
$1.78M
$1.56M – $2.08M
NOI $124,799 @ 7.0% cap · market cap 5.20%
Second Best
Apartment 5plus
$1.59M
$1.39M – $1.86M
NOI $111,527 @ 7.0% cap · market cap 4.65%
Theoretical Best
Specialty Retail
$3.52M
$3.08M – $4.11M
NOI $246,337 @ 7.0% cap · market cap 10.27%
Zoning and permitted uses should be independently verified with authorities.
How Realmo checks its estimates
Property Analytics
Unlock full access to Insights
Subscribe to Realmo Intelligence
Open Analytics
Current Use
Location Intelligence
Trade Area within ½ mile
1,226
Businesses Nearby
Explore this area
Business Placement
Demographics for 46307, IN
69,248
Population
26,081
Households
2.7
Avg Household Size
41
Median Age
33%
College-Educated
94%
High-School Grad
87.2 sq mi
ZIP Area
794
Density / Sq Mi
$102,118
Median Household Income
$50,612
Median Earnings
$1,308
Median Rent
$293,500
Median Home Value
Check the figures for this property
Cap Rate, Value Estimation, Potential NOI and more
View Realmo Analytics
Market
Vacancy Rate% for Multifamily in Midwest region

Questions? Ask Rey
Realmo’s AI knows this listing — price, zoning, demand, history. Ask anything.


Frequently Asked Questions
What type of property is this?
Mixed-use property - Mixed-use property with residential and commercial units near Crown Point.
Where is this mixed-use property located?
The property is located at 250 N Main St Crown Point, IN.
What is the asking price?
The asking price for this property is $2,399,000.
What are key features of this property?
This property features: Strong cash flow with great tenants in place.; Mixed‑use property with four residential units (including in‑unit laundry) and twelve commercial spaces.; Located in a high‑visibility corridor, 2.5 blocks from Crown Point Square.