Historic Estate with Two
For Sale
Contact for pricing
248 North Cumberland Street, Jackson, TN 38301
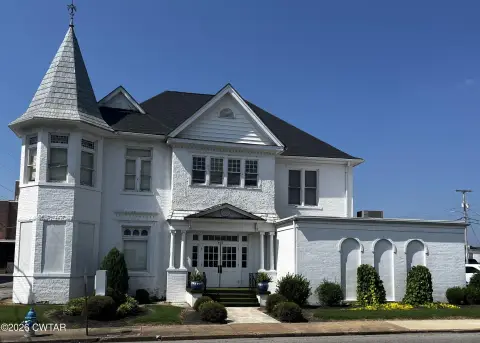
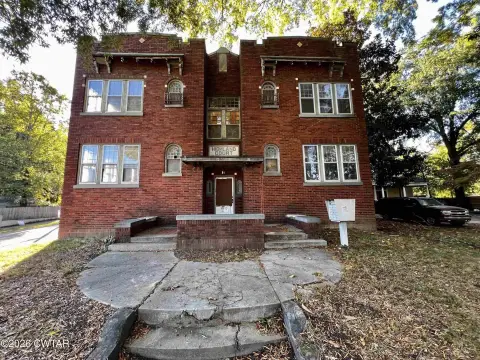
Two historic homes from the 1870s with maintained gardens and a pavilion across six parcels in an Opportunity Zone.
Property Size7,945 SF
Lot Size3.00 Acres
Price / SF$157.33
Days on Market181
Property Features for 248 North Cumberland Street
General Information
Standard status
Active
Size
7,945 SF
Class
B
Lot size
3.00 Acres
Property subtype
Hospitality, Mixed Use, Special Purpose
Zoning
RG-3 & RG-3H
Investment Type
Owner/User
Additional Details
Opportunity Zone
Yes
Building Details
Year Built
1870
Year Renovated
2007
Buildings
6
Stories
2
Listing Agency:
HCB Development
Listed By:
Chris Alexander · License #TN 326115
(731) 267-5067
Source:
Crexi
Added: Apr 27
Changed: Oct 4
Last Checked: Oct 23 at 4:49AM
Displayed information is deemed reliable but is not guaranteed and should be independently verified. All listing content including descriptions, pricing, images are the copyrighted material of HCB Development

Ask AI about this property
Review the available facts, identify missing information and prepare questions for the agent.
Investment Insights
Based on property information with market context.
This for-sale historic estate features two historic homes dating to the 1870s, along with maintained gardens and a pavilion. The property is set across six parcels totaling 3+/- acres, offering multiple structures and outdoor amenities within the existing site configuration.
The offering is located in Downtown Jackson at 248 North Cumberland Street. It is within an Opportunity Zone and zoned RG-3.
As presented, the Leatherwood Estate provides an assemblage well-suited for owner-use or adaptive reuse given its historic buildings, garden setting, pavilion, and multi-parcel footprint.
The offering is located in Downtown Jackson at 248 North Cumberland Street. It is within an Opportunity Zone and zoned RG-3.
As presented, the Leatherwood Estate provides an assemblage well-suited for owner-use or adaptive reuse given its historic buildings, garden setting, pavilion, and multi-parcel footprint.
Key Highlights
- Two historic homes built in 1870 in the heart of Downtown Jackson
- Includes maintained gardens and a pavilion
- 3+/- acres across six parcels
Financial Insights
Estimated NOI and Cap Rate
NOI / Yr
$48,570
Cap Rate
3.89%
Suggested Prices Based on Cap Rates
Cap Rate 5%
$971,400
$971.4K
Cap Rate 7%
$693,857
$693.9K
Cap Rate 9%
$539,667
$539.7K
Market Conditions
NOI Build-Up for 7,945 SF
Gross rent
$119.2K $15.00/SF
− Vacancy
−$16.9K −$2.13/SF
EGI
$102.3K $12.87/SF
− OpEx
−$53.7K −$6.76/SF
NOI
$48.6K $6.11/SF
Area
Madison County, TN
Vacancy
14.20%
Lease Rate
$15.00 /SF/Yr
Expense Ratio
52.50%
Simulate Cap Rate and NOI
Suggested Prices Based on Cap Rates
Cap Rate 5%
$971,400
Cap Rate 7%
$693,857
Cap Rate 9%
$539,667
Alternative Uses
Best Use
Hotel Hospitality
$693.9K
$607.1K – $809.5K
NOI $48,570 @ 7.0% cap · market cap 3.89%
Second Best
—
—
no second resolved use
Theoretical Best
Office A
$1.64M
$1.43M – $1.91M
NOI $114,522 @ 7.0% cap · market cap 9.16%
Zoning and permitted uses should be independently verified with authorities.
How Realmo checks its estimates
Property Analytics
Current Use
Location Intelligence
Trade Area within ½ mile
1,120
Businesses Nearby
Explore this area
Business Placement
Demographics for 38301, TN
34,170
Population
15,769
Households
2.2
Avg Household Size
37
Median Age
16%
College-Educated
85%
High-School Grad
150.9 sq mi
ZIP Area
226
Density / Sq Mi
$40,062
Median Household Income
$28,542
Median Earnings
$958
Median Rent
$119,400
Median Home Value
Frequently Asked Questions
What type of property is this?
Hotel - Two historic homes from the 1870s with maintained gardens and a pavilion across six parcels in an Opportunity Zone.
Where is this hotel located?
The property is located at 248 North Cumberland Street Jackson, TN.
What is the asking price?
The asking price for this property is $1,250,000.
What are key features of this property?
This property features: Two historic homes built in 1870 in the heart of Downtown Jackson; Includes maintained gardens and a pavilion; 3+/- acres across six parcels


