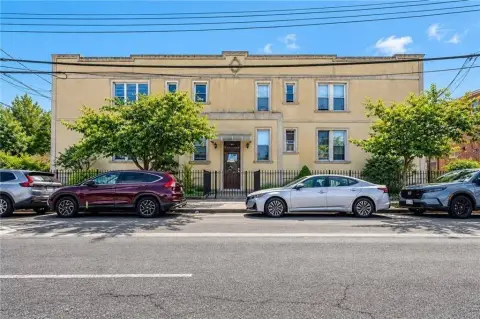
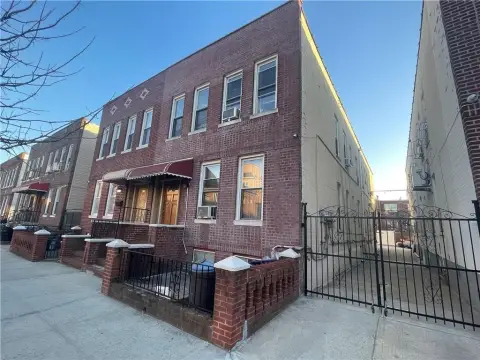
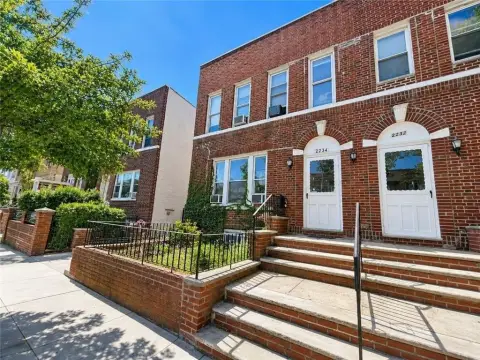
Gravesend/Bensonhurst Four-Family Brick
For Sale
$1,899,888
Pending
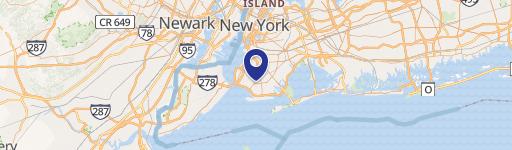
2476 84th St, Brooklyn, NY 11214
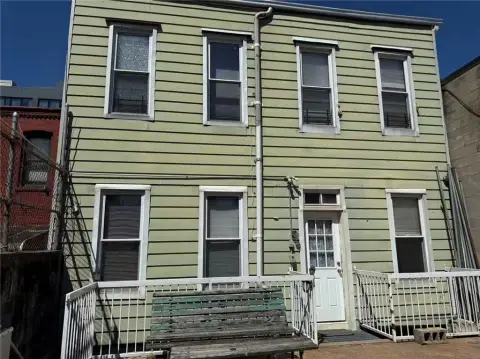
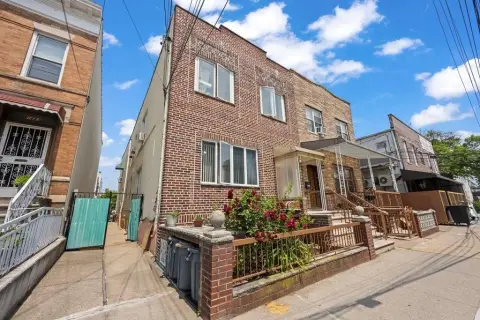
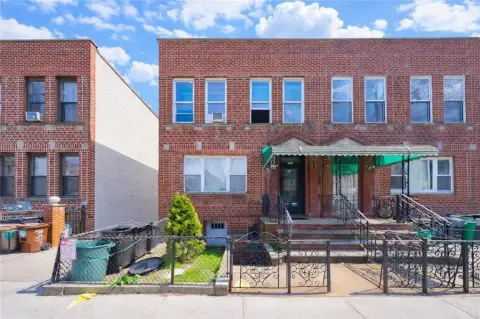
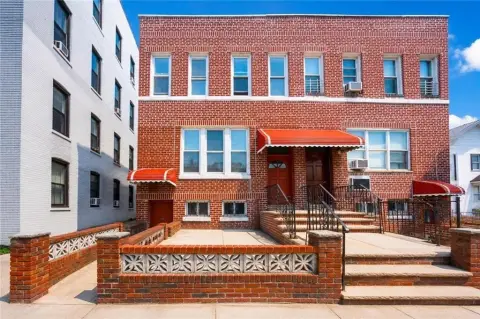
Well-maintained four-family building near transportation and shopping.
Property Size3,075 SF
Lot Size0.07 Acres
Days on Market227
Property Features for 2476 84th St
General Information
Standard status
Pending
Size
3,075 SF
Lot size
0.07 Acres
Property subtype
Multi Family
Taxes and HOA fees
Annual Taxes
$12,115
Building Details
Building Size
3,075 SF
Stories
2
Listed By:
Scott J. O'Brien
(718) 720-2300
Source:
Elliman
Added: Mar 11
Changed: Oct 18
Last Checked: Oct 23 at 8:47AM
Displayed information is deemed reliable but is not guaranteed and should be independently verified. All listing content including descriptions, pricing, images are the copyrighted material of Scott J. O'Brien

Ask AI about this property
Review the available facts, identify missing information and prepare questions for the agent.
Investment Insights
Based on property information with market context.
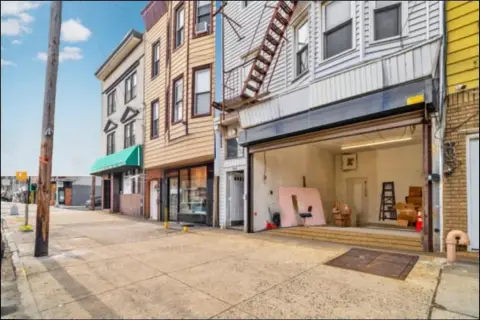
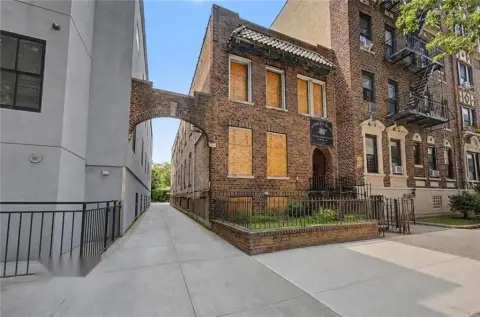
Located on the border of Gravesend and Bensonhurst, this well-maintained, all-brick, four-family building presents an opportunity for investors and end-users. Each of the four units features two bedrooms, providing ample living space. The property offers rental income potential, making it an option for investors. The setup also suits those looking to live in one unit while renting out the others. The 25th Avenue subway station, served by the D train, is a short distance away, providing access to Brooklyn and Manhattan. The shopping corridors of 86th Street and Stillwell Avenue are nearby, offering retail and dining options.
Key Highlights
- Strong rental income potential from four units, ideal for investors
- Located near the D train (25th Avenue station) for convenient access to Brooklyn and Manhattan
- Well‑maintained, all‑brick, four‑family building
Financial Insights
Estimated NOI and Cap Rate
NOI / Yr
$83,870
Cap Rate
4.41%
Suggested Prices Based on Cap Rates
Cap Rate 5%
$1,677,400
$1.7M
Cap Rate 7%
$1,198,143
$1.2M
Cap Rate 9%
$931,889
$931.9K
Market Conditions
NOI Build-Up for 3,075 SF
Gross rent
$125.5K $40.80/SF
− Vacancy
−$5.6K −$1.84/SF
EGI
$119.8K $38.96/SF
− OpEx
−$35.9K −$11.69/SF
NOI
$83.9K $27.27/SF
Area
ZIP 11214
Vacancy
4.50%
Lease Rate
$40.80 /SF/Yr
Expense Ratio
30.00%
Simulate Cap Rate and NOI
Suggested Prices Based on Cap Rates
Cap Rate 5%
$1,677,400
Cap Rate 7%
$1,198,143
Cap Rate 9%
$931,889
Alternative Uses
Best Use
Multifamily LT 5
$1.20M
$1.05M – $1.40M
NOI $83,870 @ 7.0% cap · market cap 4.41%
Second Best
Apartment 5plus
$1.07M
$939.6K – $1.25M
NOI $75,167 @ 7.0% cap · market cap 3.96%
Theoretical Best
Office A
$1.79M
$1.57M – $2.09M
NOI $125,566 @ 7.0% cap · market cap 6.61%
Zoning and permitted uses should be independently verified with authorities.
How Realmo checks its estimates
Property Analytics
Contact the owner directly
Get the owner's phone numbers and email
Open Analytics
Location Intelligence
Trade Area within ½ mile
3,578
Businesses Nearby
Explore this area
Business Placement
Demographics for 11214, NY
96,560
Population
33,341
Households
2.9
Avg Household Size
39
Median Age
32%
College-Educated
76%
High-School Grad
2.0 sq mi
ZIP Area
48,280
Density / Sq Mi
$64,286
Median Household Income
$41,172
Median Earnings
$1,710
Median Rent
$1,007,400
Median Home Value
Check the figures for this property
Cap Rate, Value Estimation, Potential NOI and more
View Realmo Analytics
Market
Vacancy Rate% for Multifamily in Northeast region


Frequently Asked Questions
What type of property is this?
Quadplex - Well-maintained four-family building near transportation and shopping.
Where is this quadplex located?
The property is located at 2476 84th St Brooklyn, NY.
What is the asking price?
The asking price for this property is $1,899,888.
What are key features of this property?
This property features: Strong rental income potential from four units, ideal for investors; Located near the D train (25th Avenue station) for convenient access to Brooklyn and Manhattan; Well‑maintained, all‑brick, four‑family building


