Spacious Home in Spring
For Sale
$985,000
244 Blauvelt Road #213, Monsey, NY 10952
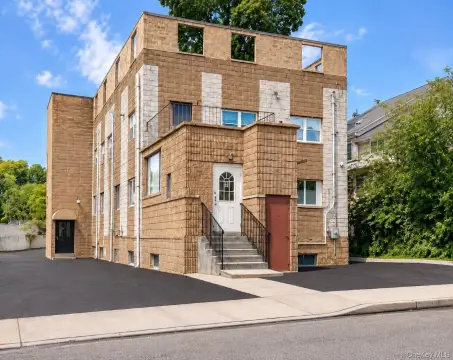
Refined 5-bedroom home with modern finishes and convenient location.
Property Size2,704 SF
Days on Market483
Property Features for 244 Blauvelt Road #213
General Information
Standard status
Active
Size
2,704 SF
Property subtype
Condominium
Amenities
Central Air
Baseboard
Electricity Connected, Natural Gas Connected
Building Details
Building Size
2,704 SF
Year Built
2025
Listing Agency:
Pascack Valley
Listed By:
Menachem Jankovits · License #10401361116
(718) 702-3424
Source:
Kw
Added: Jun 11, 2025
Changed: Oct 6
Last Checked: Oct 5 at 4:20PM
Displayed information is deemed reliable but is not guaranteed and should be independently verified. All listing content including descriptions, pricing, images are the copyrighted material of Pascack Valley
Investment Insights
Based on property information with market context.
Located at 242 Blauvelt Road in Spring Valley, this thoughtfully designed front unit offers nearly 2,700 sq. ft. of living space. The home features five bedrooms and three bathrooms. The layout is airy and light-filled, enhanced by 9-ft ceilings and elegant finishes. The upgraded kitchen flows into a spacious dining room, suitable for entertaining and family gatherings. A dedicated playroom and private porch add to the comfort and functionality. The bedrooms are generously sized, including a primary suite. One bedroom is suited as a guest space, office, or playroom, as it does not have a window. The three modern bathrooms feature clean, tasteful finishes. Additional features include a storage room and convenient access to nearby grocery stores and shopping. The property is located across from a park, offering green space and views.
Key Highlights
- Spacious Layout: Nearly 2,700 sq. ft. with 5 bedrooms and 3 bathrooms.
- Upgraded Kitchen: Flows into a spacious dining room, ideal for entertaining.
- Convenient Location: Close to grocery stores, shopping, and across from a park.
Financial Insights
Estimated NOI and Cap Rate
NOI / Yr
$44,314
Cap Rate
4.50%
Suggested Prices Based on Cap Rates
Cap Rate 5%
$886,280
$886.3K
Cap Rate 7%
$633,057
$633.1K
Cap Rate 9%
$492,378
$492.4K
Market Conditions
NOI Build-Up for 2,704 SF
Gross rent
$86.0K $31.80/SF
− Vacancy
−$5.4K −$2.00/SF
EGI
$80.6K $29.80/SF
− OpEx
−$36.3K −$13.41/SF
NOI
$44.3K $16.39/SF
Area
Rockland County, NY
Vacancy
6.30%
Lease Rate
$31.80 /SF/Yr
Expense Ratio
45.00%
Simulate Cap Rate and NOI
Suggested Prices Based on Cap Rates
Cap Rate 5%
$886,280
Cap Rate 7%
$633,057
Cap Rate 9%
$492,378
Alternative Uses
Best Use
Apartment 5plus
$633.1K
$553.9K – $738.6K
NOI $44,314 @ 7.0% cap · market cap 4.50%
Second Best
—
—
no second resolved use
Theoretical Best
Specialty Retail
$1.79M
$1.56M – $2.09M
NOI $125,148 @ 7.0% cap · market cap 12.71%
Zoning and permitted uses should be independently verified with authorities.
Property Analytics
Unlock full access to Insights
Subscribe to Realmo Intelligence
Open Analytics
Current Use
Location Intelligence
Trade Area within ½ mile
579
Businesses Nearby
Explore this area
Business Placement
Demographics for 10952, NY
47,426
Population
11,743
Households
4
Avg Household Size
19
Median Age
26%
College-Educated
85%
High-School Grad
8.9 sq mi
ZIP Area
5,329
Density / Sq Mi
$70,696
Median Household Income
$35,340
Median Earnings
$1,715
Median Rent
$786,300
Median Home Value
Check the figures for this property
Cap Rate, Value Estimation, Potential NOI and more
View Realmo Analytics
Market
Vacancy Rate% for Multifamily in Northeast region

Questions? Ask Rey
Realmo’s AI knows this listing — price, zoning, demand, history. Ask anything.



Frequently Asked Questions
What type of property is this?
Apartment building - Refined 5-bedroom home with modern finishes and convenient location.
Where is this apartment building located?
The property is located at 244 Blauvelt Road #213 Monsey, NY.
What is the asking price?
The asking price for this property is $985,000.
What are key features of this property?
This property features: Spacious Layout: Nearly 2,700 sq. ft. with 5 bedrooms and 3 bathrooms.; Upgraded Kitchen: Flows into a spacious dining room, ideal for entertaining.; Convenient Location: Close to grocery stores, shopping, and across from a park.



