Four-Story Mixed-Use
For Sale
$10,750,000
242 Tenth Avenue, New York, NY 10001
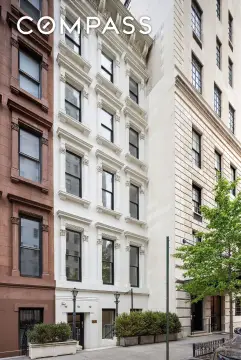
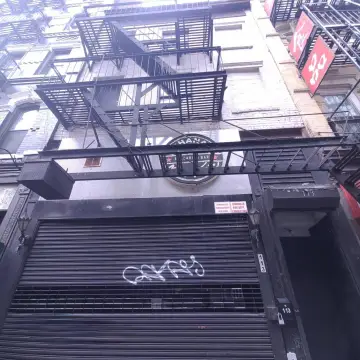
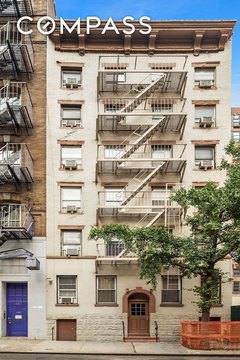
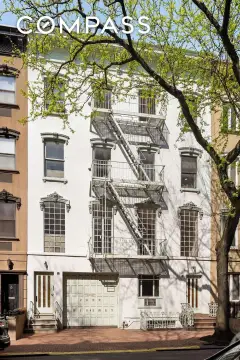
Renovated free-market apartments accompany vacant retail space with outdoor seating and a dedicated take-out structure.
Property Size5,738 SF
Days on Market121
Property Features for 242 Tenth Avenue
General Information
Standard status
Active
Size
5,738 SF
Property subtype
Commercial
Site & Location
Corner Location
Yes
Road Access
Yes
Additional Details
Multifamily Units
6
Amenities
outdoor garden seating
dedicated structure for take-out operations
Building Details
Building Size
5,738 SF
Buildings
1
Stories
4
Tenancy
Single
Listing Agency:
Matthews Real Estate Investments Services | New York
Listed By:
Brock Emmetsberger · License #10301208301 (NY)
(646) 868-0013
Source:
Matthews
Added: Jun 16
Changed: Oct 13
Last Checked: Oct 12 at 4:45PM
Displayed information is deemed reliable but is not guaranteed and should be independently verified. All listing content including descriptions, pricing, images are the copyrighted material of Matthews Real Estate Investments Services | New York
Investment Insights
Based on property information with market context.
This 5,738-square-foot, four-story mixed-use property combines a ground-floor retail space with six free-market residential apartments. The apartments underwent a full gut renovation, while the retail component will be delivered vacant. Outdoor garden seating and a separate take-out structure expand the ground-floor configuration and provide additional functional space for a future operator.
The property occupies the northeast corner of West 24th Street and Tenth Avenue in Manhattan, near the High Line and within a residential and retail setting. Zoning is identified as R7B and C2-5, and the property carries a Tax Class 2B designation. The combination of renovated residential units, vacant commercial space, and a prominent corner position supports a range of ownership and leasing strategies.
The property occupies the northeast corner of West 24th Street and Tenth Avenue in Manhattan, near the High Line and within a residential and retail setting. Zoning is identified as R7B and C2-5, and the property carries a Tax Class 2B designation. The combination of renovated residential units, vacant commercial space, and a prominent corner position supports a range of ownership and leasing strategies.
Key Highlights
- 5,738‑square‑foot, four‑story mixed‑use property
- Ground‑floor retail space will be delivered vacant
- Six free‑market apartments completed a full gut renovation
Financial Insights
Estimated NOI and Cap Rate
NOI / Yr
$807,477
Cap Rate
7.51%
Suggested Prices Based on Cap Rates
Cap Rate 5%
$16,149,540
$16.1M
Cap Rate 7%
$11,535,386
$11.5M
Cap Rate 9%
$8,971,967
$9.0M
Market Conditions
NOI Build-Up for 5,738 SF
Gross rent
$1.35M $235.68/SF
− Vacancy
−$198.8K −$34.64/SF
EGI
$1.15M $201.04/SF
− OpEx
−$346.1K −$60.31/SF
NOI
$807.5K $140.72/SF
Area
New York, NY
Vacancy
14.70%
Lease Rate
$235.68 /SF/Yr
Expense Ratio
30.00%
Simulate Cap Rate and NOI
Suggested Prices Based on Cap Rates
Cap Rate 5%
$16,149,540
Cap Rate 7%
$11,535,386
Cap Rate 9%
$8,971,967
Alternative Uses
Best Use
Retail
$11.54M
$10.09M – $13.46M
NOI $807,477 @ 7.0% cap · market cap 7.51%
Second Best
Mixed Use
$2.61M
$2.29M – $3.05M
NOI $182,899 @ 7.0% cap · market cap 1.70%
Theoretical Best
Specialty Retail
$14.28M
$12.50M – $16.66M
NOI $999,789 @ 7.0% cap · market cap 9.30%
Zoning and permitted uses should be independently verified with authorities.
How Realmo checks its estimates
Property Analytics
Unlock full access to Insights
Subscribe to Realmo Intelligence
Open Analytics
Current Use
Lease Details
6
Residential units
Single-tenant
Tenancy
Yes
Paved road access
Location Intelligence
Trade Area within ½ mile
28,863
Businesses Nearby
Explore this area
Business Placement
Demographics for 10001, NY
32,612
Population
17,554
Households
1.9
Avg Household Size
35
Median Age
72%
College-Educated
93%
High-School Grad
0.6 sq mi
ZIP Area
54,353
Density / Sq Mi
$123,393
Median Household Income
$97,848
Median Earnings
$3,024
Median Rent
$793,000
Median Home Value
Check the figures for this property
Cap Rate, Value Estimation, Potential NOI and more
View Realmo Analytics
Market
Vacancy Rate% for Multifamily in Northeast region

Questions? Ask Rey
Realmo’s AI knows this listing — price, zoning, demand, history. Ask anything.






Frequently Asked Questions
What type of property is this?
Mixed-use property - Renovated free-market apartments accompany vacant retail space with outdoor seating and a dedicated take-out structure.
Where is this mixed-use property located?
The property is located at 242 Tenth Avenue New York, NY.
What is the asking price?
The asking price for this property is $10,750,000.
What are key features of this property?
This property features: 5,738‑square‑foot, four‑story mixed‑use property; Ground‑floor retail space will be delivered vacant; Six free‑market apartments completed a full gut renovation