Two-Story Storefront Retail
For Sale
$699,900
236 N Amelia Avenue, Deland, FL 32724
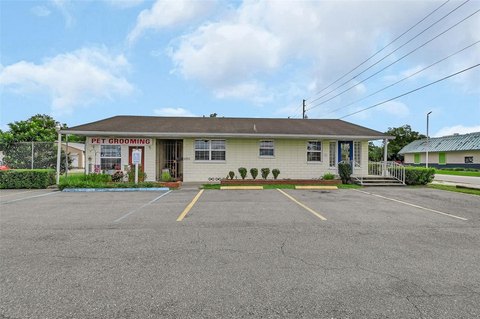
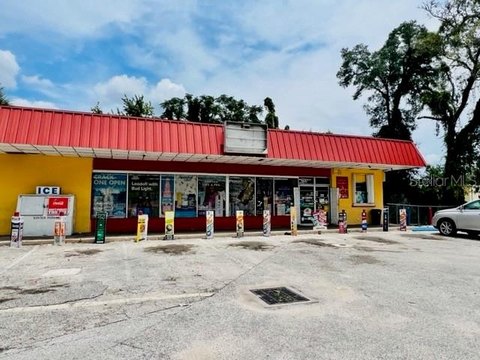
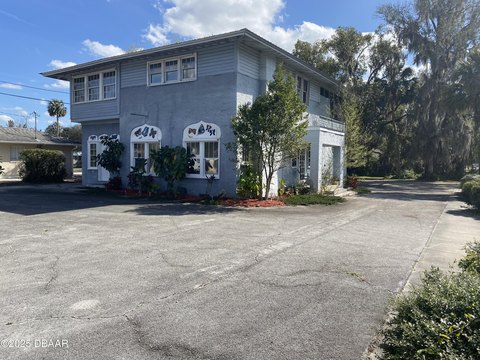
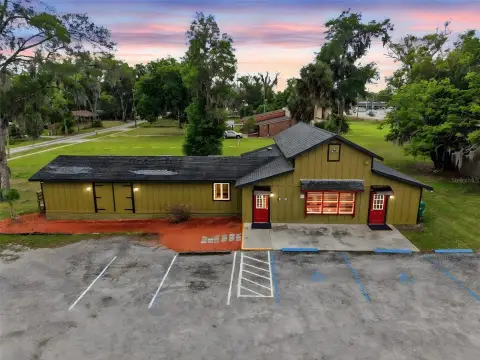
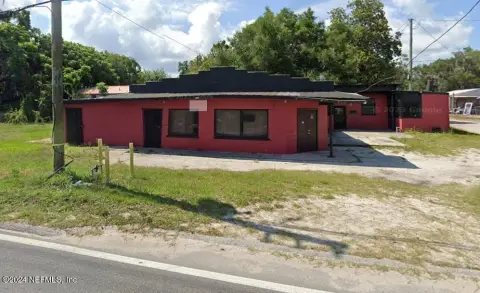
Two independently metered storefront buildings with city water and sewer, positioned with Amelia Avenue frontage for consistent street visibility.
Property Size2,722 SF
Price / SF$257.13
Days on Market222

Ask AI about this property
Review the available facts, identify missing information and prepare questions for the agent.
Property Features for 236 N Amelia Avenue
General Information
Standard status
Active
Size
2,722 SF
Property subtype
Commercial
Additional Details
Utilities to Site
Yes
Building Details
Year Built
1935
Listing Agency:
APARO-GRIFFIN PROPERTIES INC
Listed By:
Kathy Aparo-Griffin · License #3015677
(386) 738-2845
Source:
Realtygroupfl
Added: Mar 7
Changed: Oct 15
Last Checked: Oct 15 at 12:03AM
Displayed information is deemed reliable but is not guaranteed and should be independently verified. All listing content including descriptions, pricing, images are the copyrighted material of APARO-GRIFFIN PROPERTIES INC
Investment Insights
Based on property information with market context.
The property consists of two commercial storefront buildings that have been family-owned since 1988. Each building is separately metered and provided with city water and sewer. Both buildings are topped with durable metal roofs.
The buildings are situated on Amelia Avenue with frontage on a busy commercial corridor and an elevated position approximately five feet above the road, improving sightlines from street level. The site is located near downtown DeLand, offering convenient access to surrounding retail and business activity.
This configuration can fit a range of retail and mixed-use concepts, including options where separate spaces or tenants are desired. Because utilities are separately metered per building, the property also lends itself to straightforward operational separation. For buyers, the two-building setup provides flexibility to house one business while leasing or using the other, subject to applicable approvals and intended use.
The buildings are situated on Amelia Avenue with frontage on a busy commercial corridor and an elevated position approximately five feet above the road, improving sightlines from street level. The site is located near downtown DeLand, offering convenient access to surrounding retail and business activity.
This configuration can fit a range of retail and mixed-use concepts, including options where separate spaces or tenants are desired. Because utilities are separately metered per building, the property also lends itself to straightforward operational separation. For buyers, the two-building setup provides flexibility to house one business while leasing or using the other, subject to applicable approvals and intended use.
Key Highlights
- Two independently metered commercial storefront buildings with city water and sewer
- Amelia Avenue frontage with an elevated position about 5 feet above the road
- Each building is topped with a durable metal roof
Financial Insights
Estimated NOI and Cap Rate
NOI / Yr
$25,637
Cap Rate
3.66%
Suggested Prices Based on Cap Rates
Cap Rate 5%
$512,740
$512.7K
Cap Rate 7%
$366,243
$366.2K
Cap Rate 9%
$284,856
$284.9K
Market Conditions
NOI Build-Up for 2,722 SF
Gross rent
$40.8K $15.00/SF
− Vacancy
−$4.2K −$1.55/SF
EGI
$36.6K $13.46/SF
− OpEx
−$11.0K −$4.04/SF
NOI
$25.6K $9.42/SF
Area
Volusia County, FL
Vacancy
10.30%
Lease Rate
$15.00 /SF/Yr
Expense Ratio
30.00%
Simulate Cap Rate and NOI
Suggested Prices Based on Cap Rates
Cap Rate 5%
$512,740
Cap Rate 7%
$366,243
Cap Rate 9%
$284,856
Alternative Uses
Best Use
Retail
$366.2K
$320.5K – $427.3K
NOI $25,637 @ 7.0% cap · market cap 3.66%
Second Best
—
—
no second resolved use
Theoretical Best
Office A
$802.6K
$702.3K – $936.4K
NOI $56,182 @ 7.0% cap · market cap 8.03%
Zoning and permitted uses should be independently verified with authorities.
How Realmo checks its estimates
Property Analytics
Unlock full access to Insights
Subscribe to Realmo Intelligence
Open Analytics
Current Use
Lease Details
Yes
Utilities to site
Location Intelligence
Trade Area within ½ mile
1,700
Businesses Nearby
85k
Monthly Visits Nearby
Under-served
Demand for This Use
Explore this area
Business Placement
Foot Traffic Nearby
Dining 45%
Shops & Services 43%
Home Improvements & Furnishings 12%
Checkers
Dining
9,003 visits/mo
0.3 miles
Shell
Shops & Services
9,000 visits/mo
0.2 miles
Firehouse Subs
Dining
8,924 visits/mo
0.4 miles
Bank of America
Shops & Services
8,421 visits/mo
0.5 miles
Ace Hardware of Deland LLC
Home Improvements & Furnishings
7,941 visits/mo
0.3 miles
Demographics for 32724, FL
40,559
Population
18,555
Households
2.2
Avg Household Size
45
Median Age
31%
College-Educated
92%
High-School Grad
83.8 sq mi
ZIP Area
484
Density / Sq Mi
$72,729
Median Household Income
$41,204
Median Earnings
$1,184
Median Rent
$283,100
Median Home Value
Check the figures for this property
Cap Rate, Value Estimation, Potential NOI and more
View Realmo Analytics
Market
Vacancy Rate% for Retail in South region





Similar Off Market Nearby
- Spring flowers and plants Inc — 302 S Woodland Blvd, DeLand, FL 32720
- Dorothy's There's No Place Like Home — 100 E New York Ave, DeLand, FL 32724
Frequently Asked Questions
What type of property is this?
Storefront property - Two independently metered storefront buildings with city water and sewer, positioned with Amelia Avenue frontage for consistent street visibility.
Where is this storefront property located?
The property is located at 236 N Amelia Avenue Deland, FL.
What is the asking price?
The asking price for this property is $699,900.
What are key features of this property?
This property features: Two independently metered commercial storefront buildings with city water and sewer; Amelia Avenue frontage with an elevated position about 5 feet above the road; Each building is topped with a durable metal roof


