Mixed-Use Property with
For Sale
$695,000
1030 CAMPHOR Lane, Deland, FL 32720
Commercial Sale, DELAND, FL
Property Size2,400 SF
Lot Size0.65 Acres
Price / SF$202.62
Days on Market192
Property Features for 1030 CAMPHOR Lane
General Information
Property type
Commercial Sale
Property subtype
Other
Zoning
01B4
Security features
Security System
Window features
Blinds, Window Treatments
Appliances
Microwave, Refrigerator
Subdivision
STETSON HOME ESTATES DELAND
Lot features
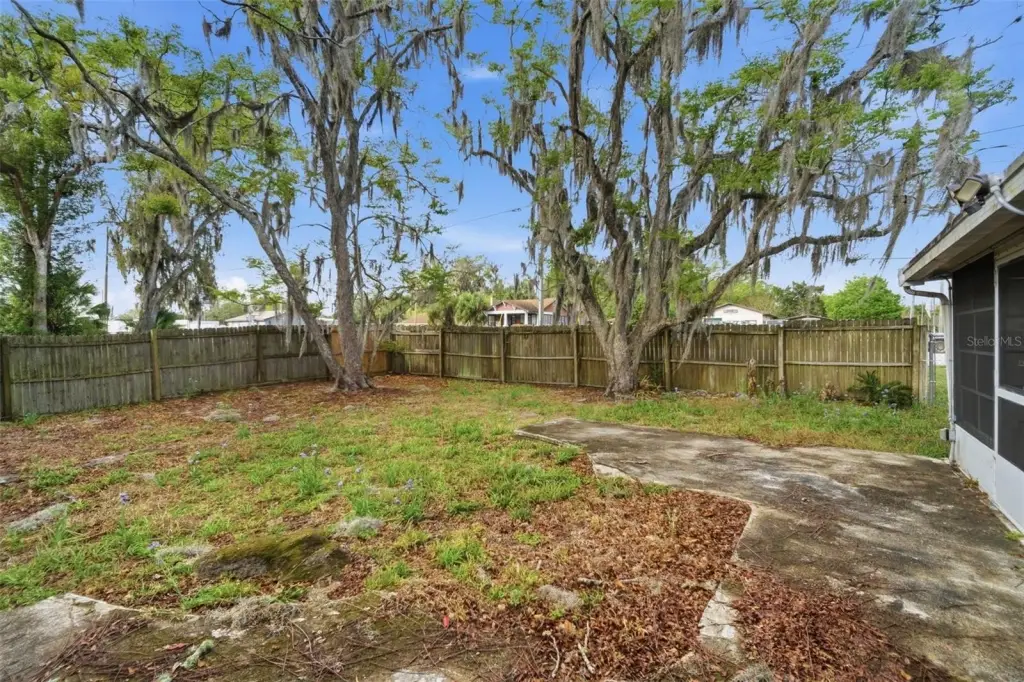
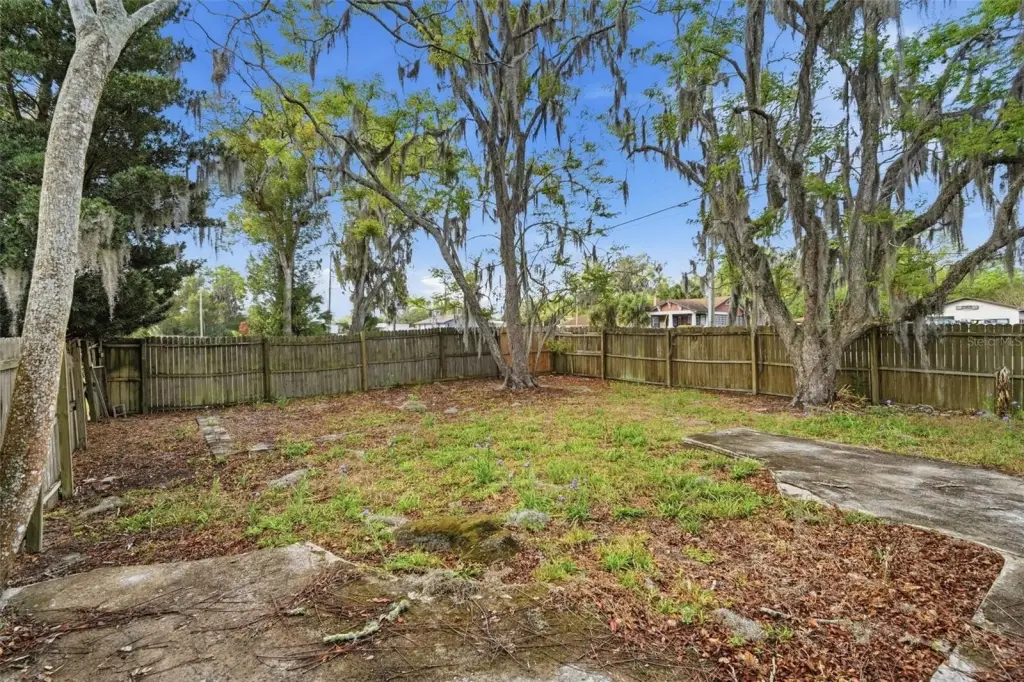
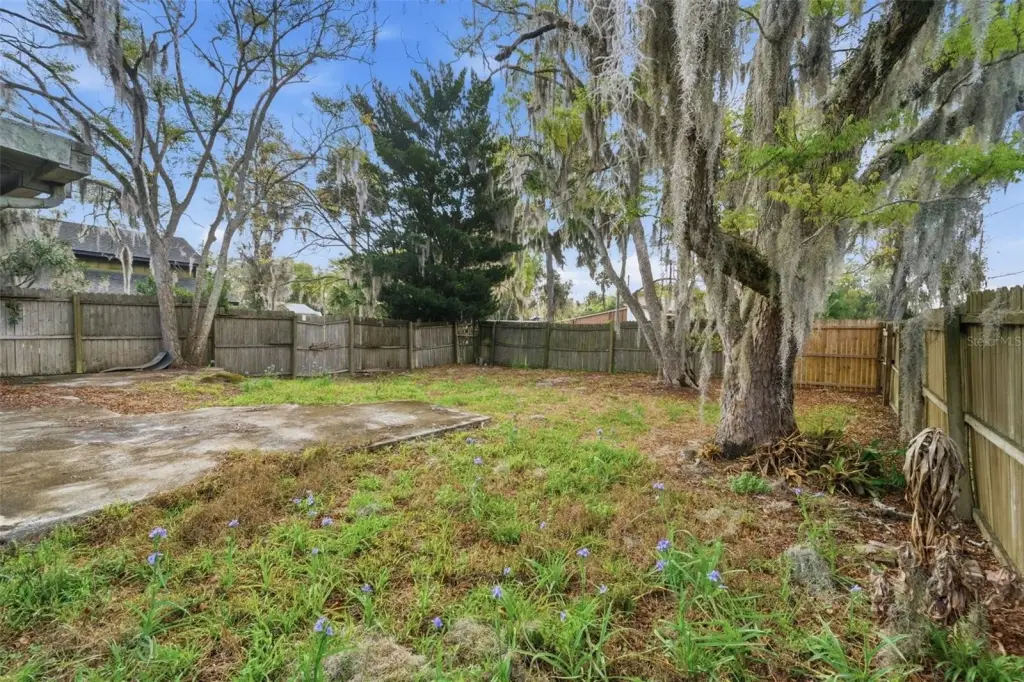
Corner Lot, Landscaped, Oversized Lot
Directions
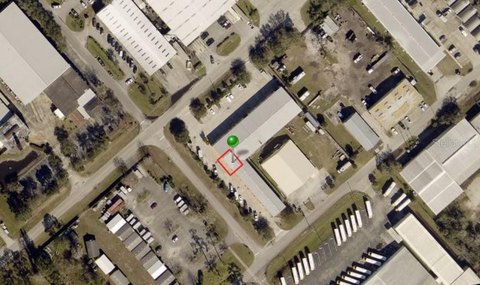
HIGHWAY 17-92 TO 15A LEFT TO CAMPHOR (CORNER 1030)
Standard status
Active
APN
70-17-02-23-00-1000
Size
3,430 SF
Lot size
0.65 Acres
Taxes and HOA fees
Tax Year
2025
Tax Description
17 17 30 LOTS 1TO4 INC BLK W STETSON HOMEESTATES MB 10 PG 79 PER OR 4055 PG 2893
Tax Annual Amount
4529
Legal Description
17 17 30 LOTS 1TO4 INC BLK W STETSON HOMEESTATES MB 10 PG 79 PER OR 4055 PG 2893
Utilities
Utilities
Electricity Available
Sewer type
Septic Tank
Heating system
Central
Cooling system
Central Air
Water source
Public
Building Details
Year built
1948
Floors in Building
1
Flooring type
Reclaimed wood, Tile - Ceramic, Carpet
Building materials
Metal Frame, Wood Siding
Roof type
Shingle
Listing Agency:
GLORY INTL. REAL ESTATE CO
(386) 775-7778
Listed By:
Louis Castriota · License #349095
(386) 469-9036
Added: Apr 2
Changed: Oct 10
Last Checked: Oct 10 at 11:06AM
MLS# V4948337
Copyright © 2026 Stellar MLS. All rights reserved. All information provided by the listing agent/broker is deemed reliable but is not guaranteed and should be independently verified.
Investment Insights
Based on property information with market context.
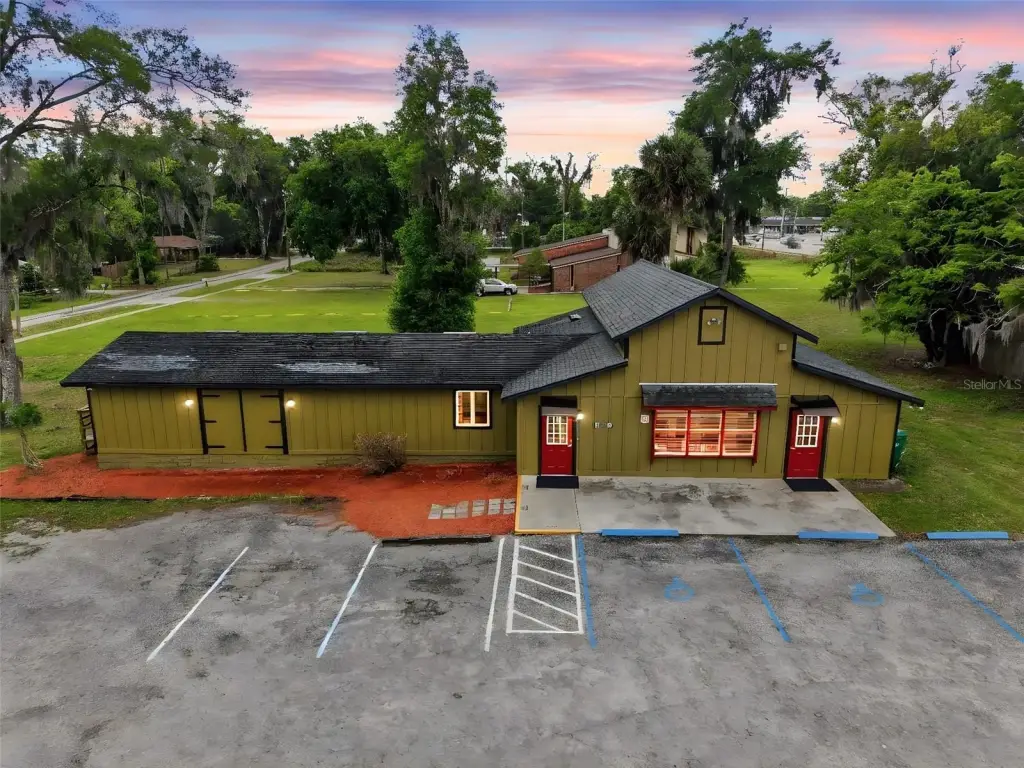
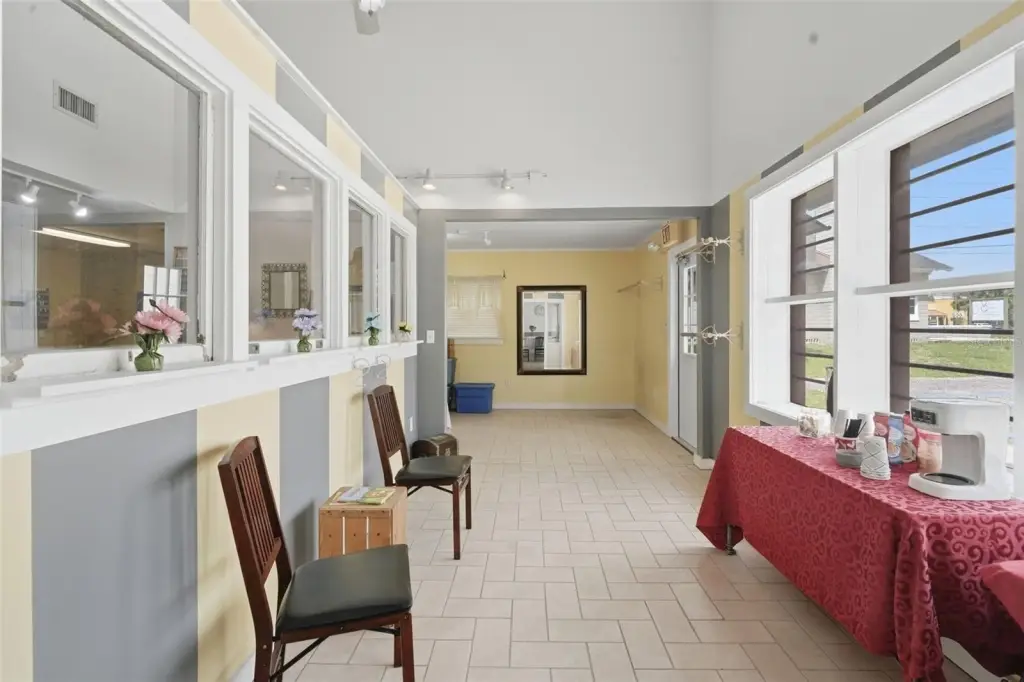
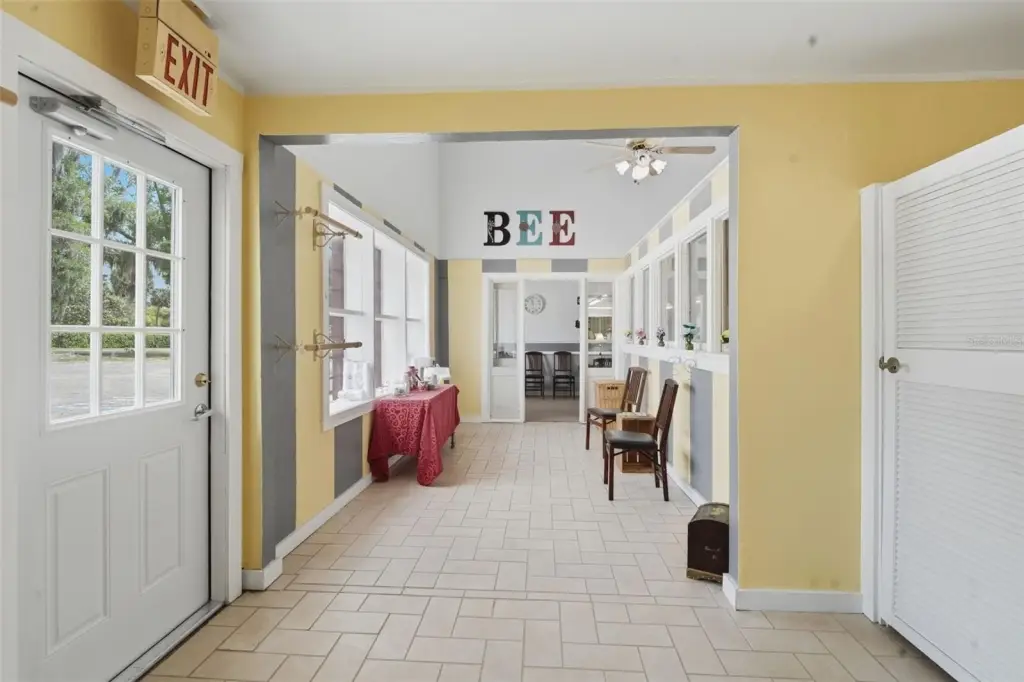
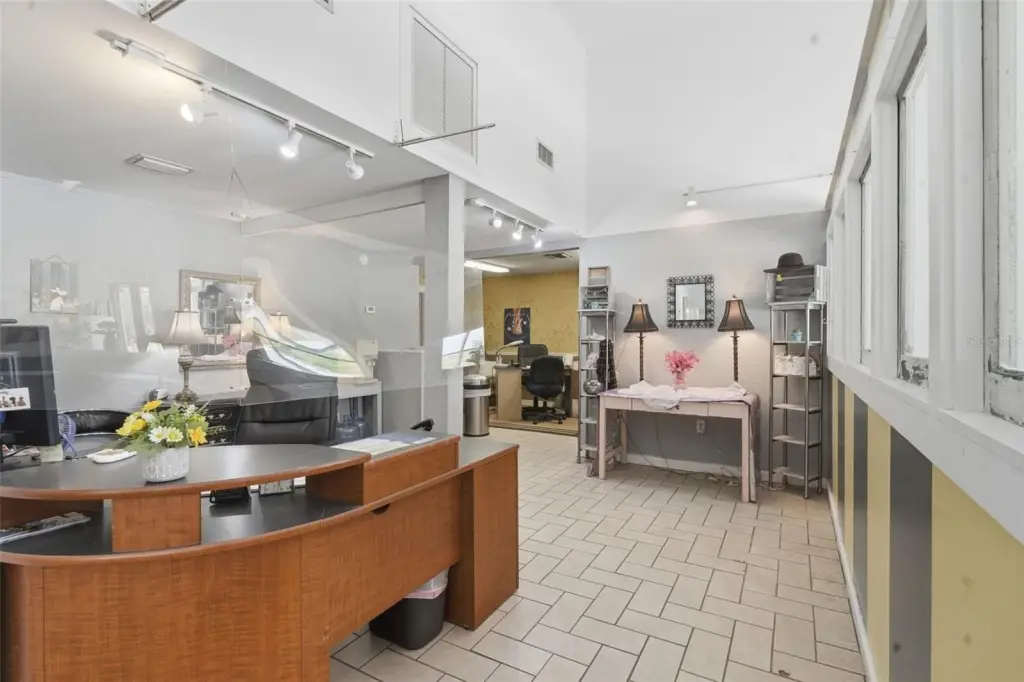
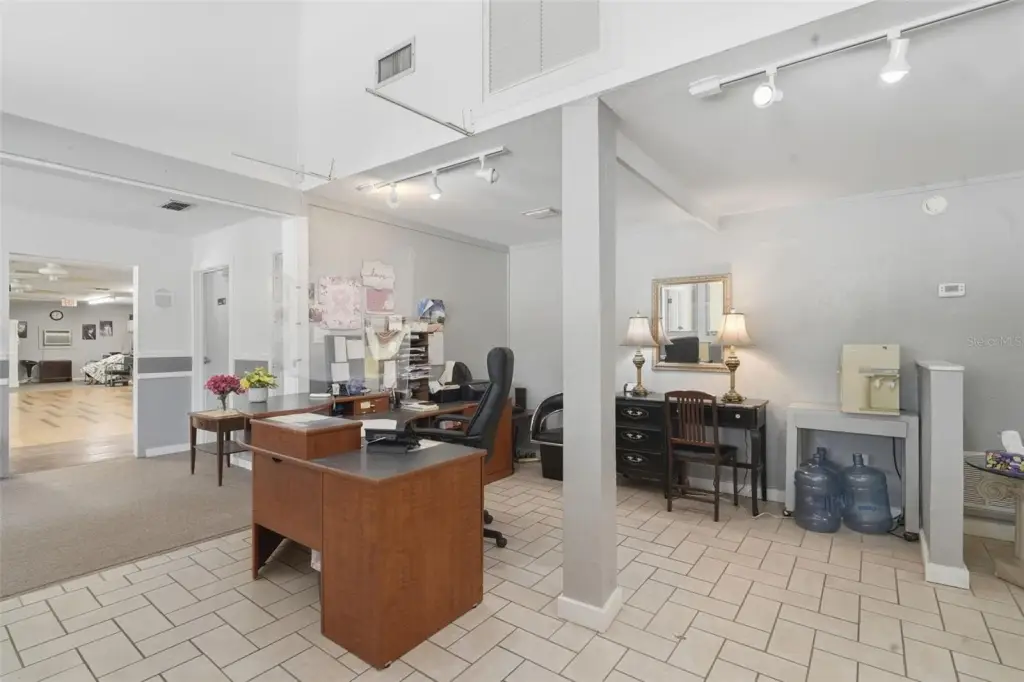
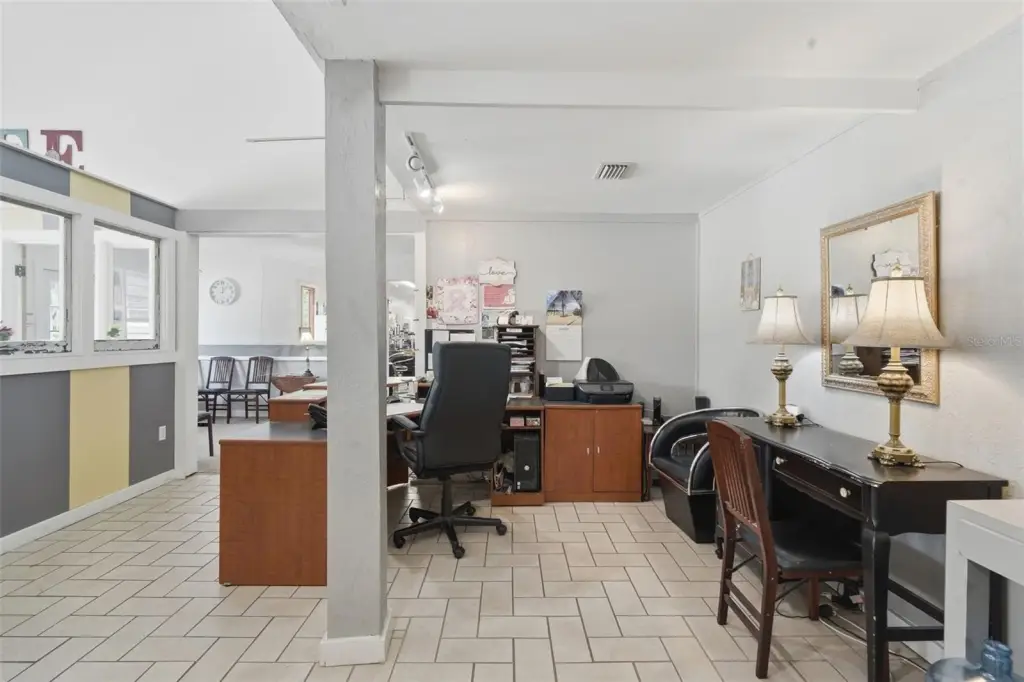
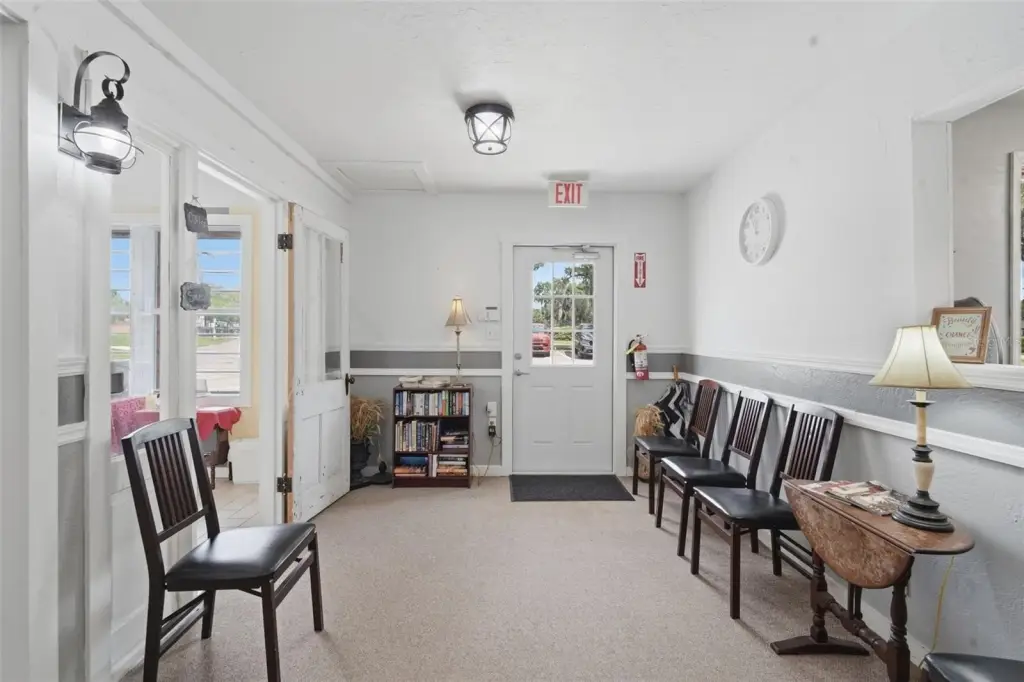
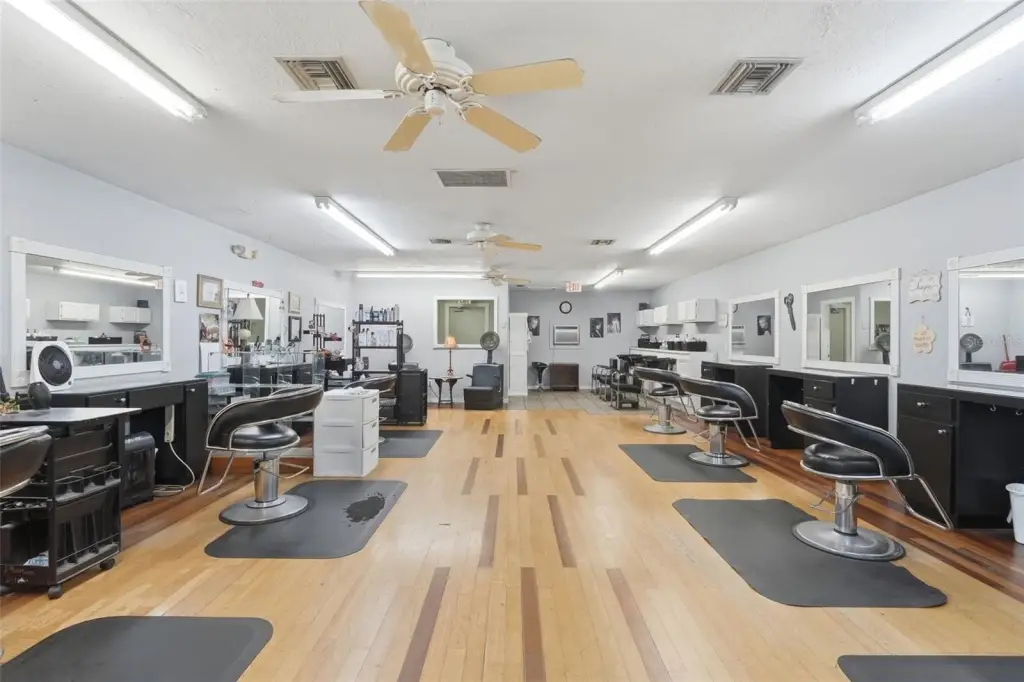
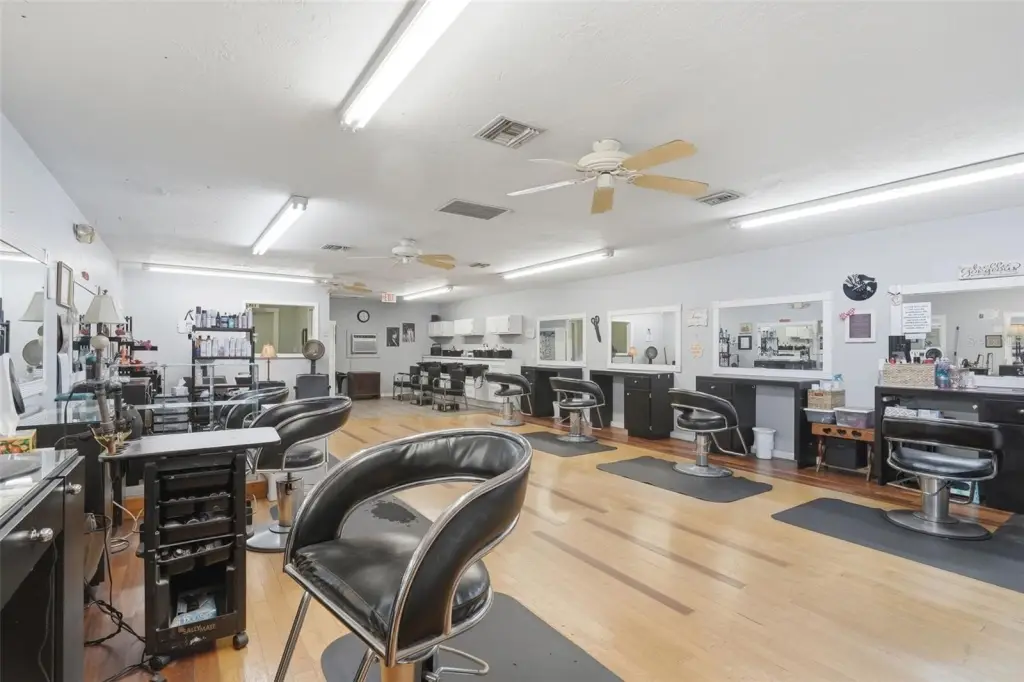
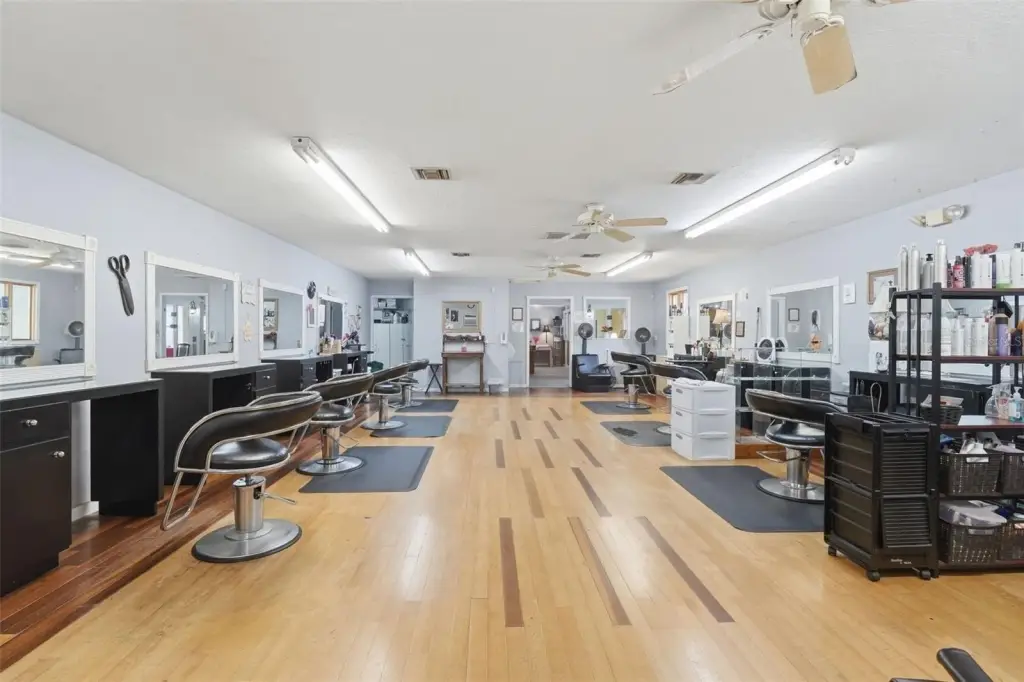
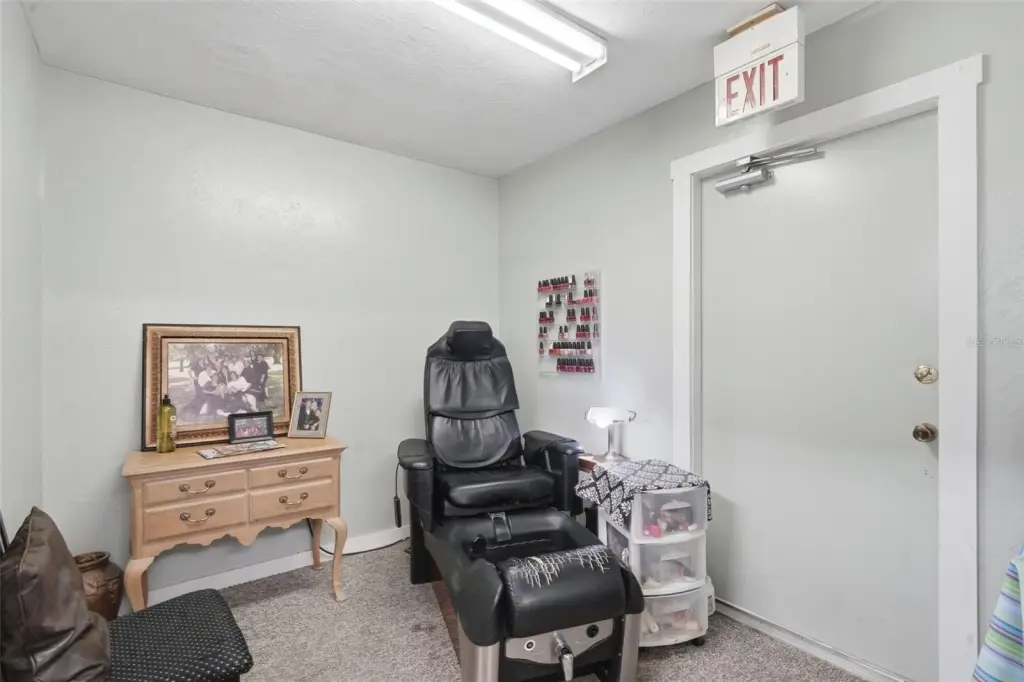
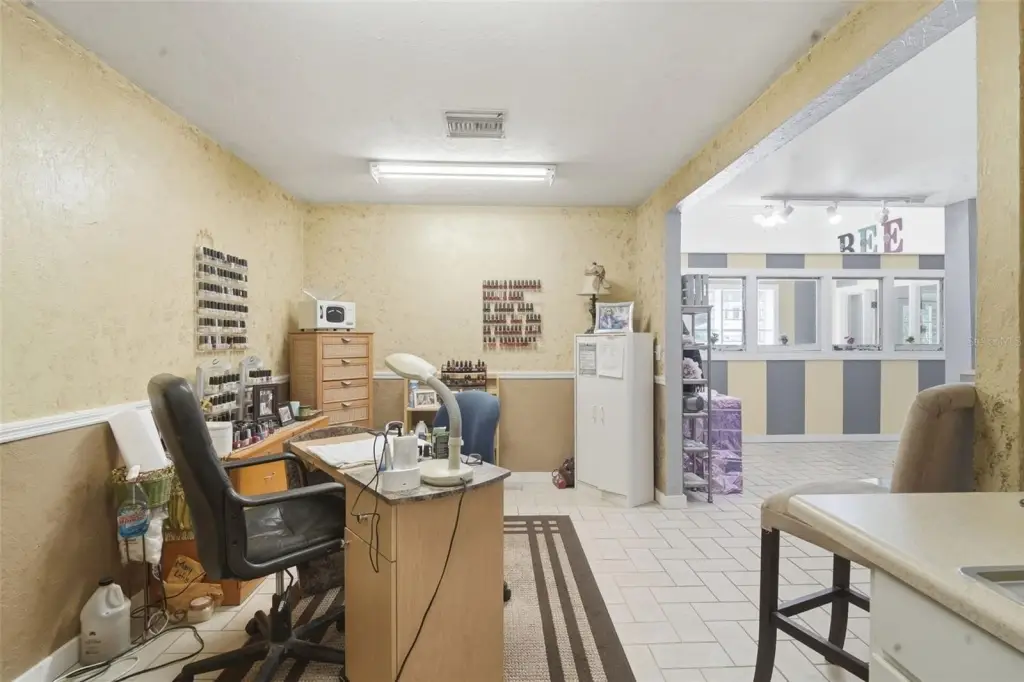
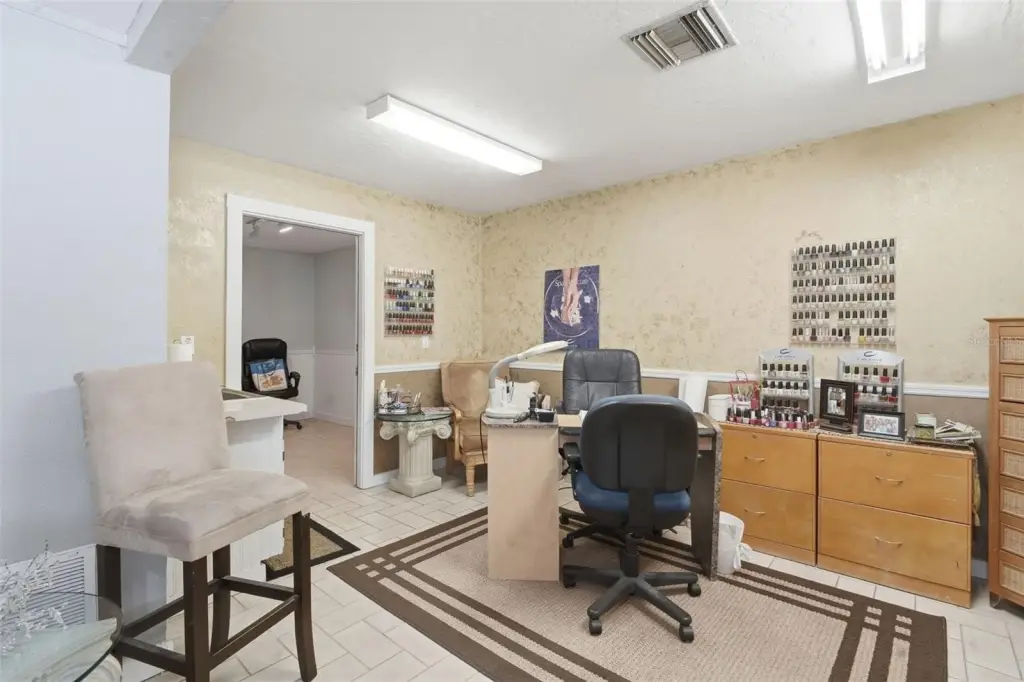
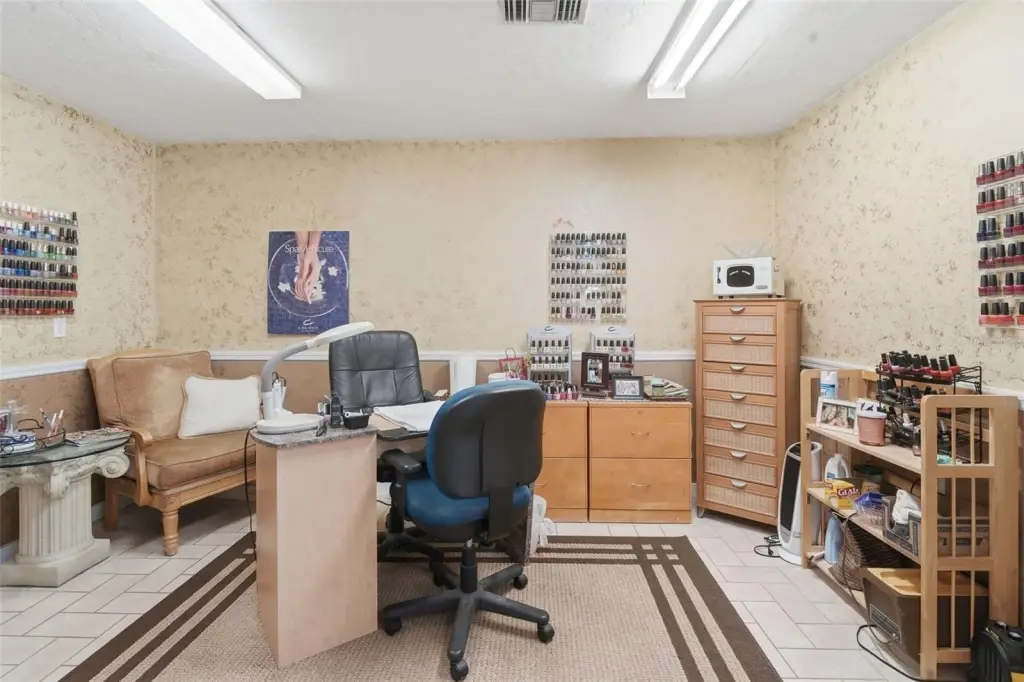
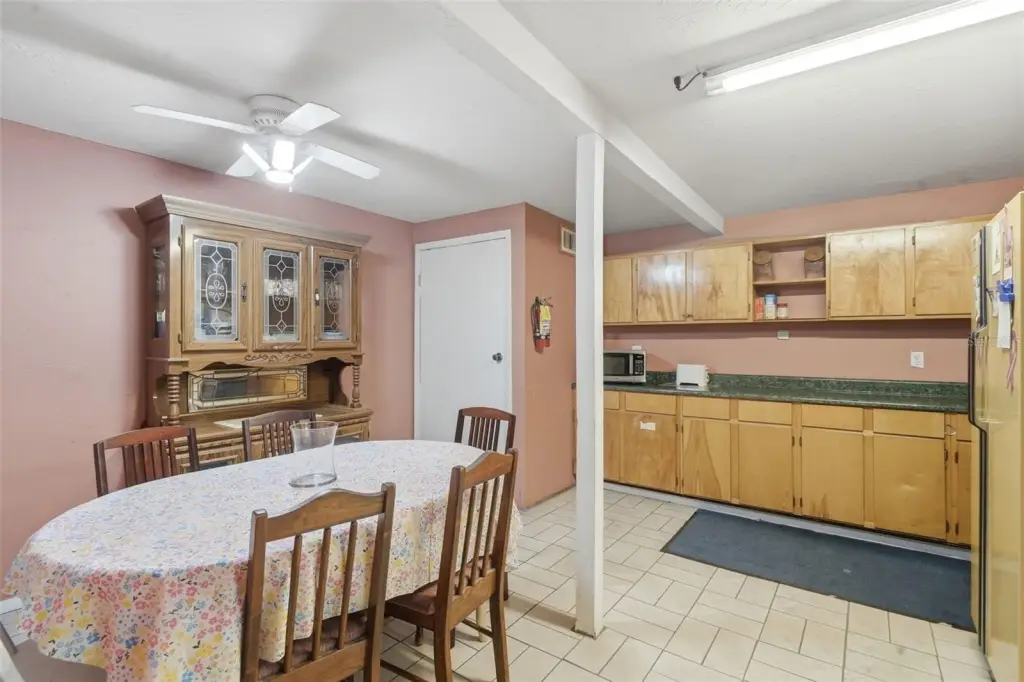
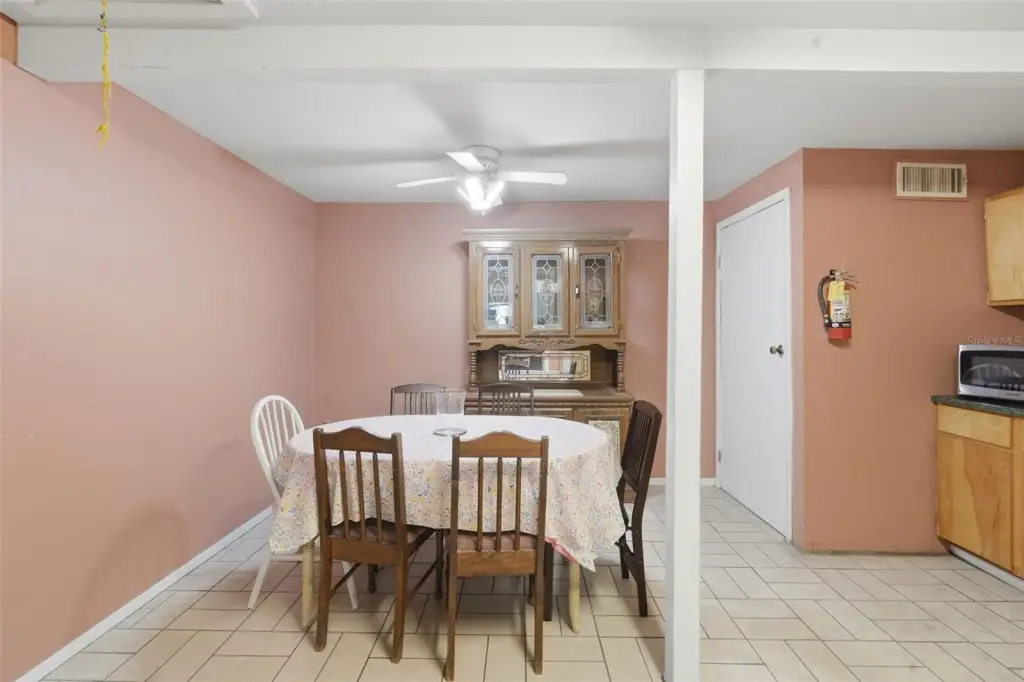
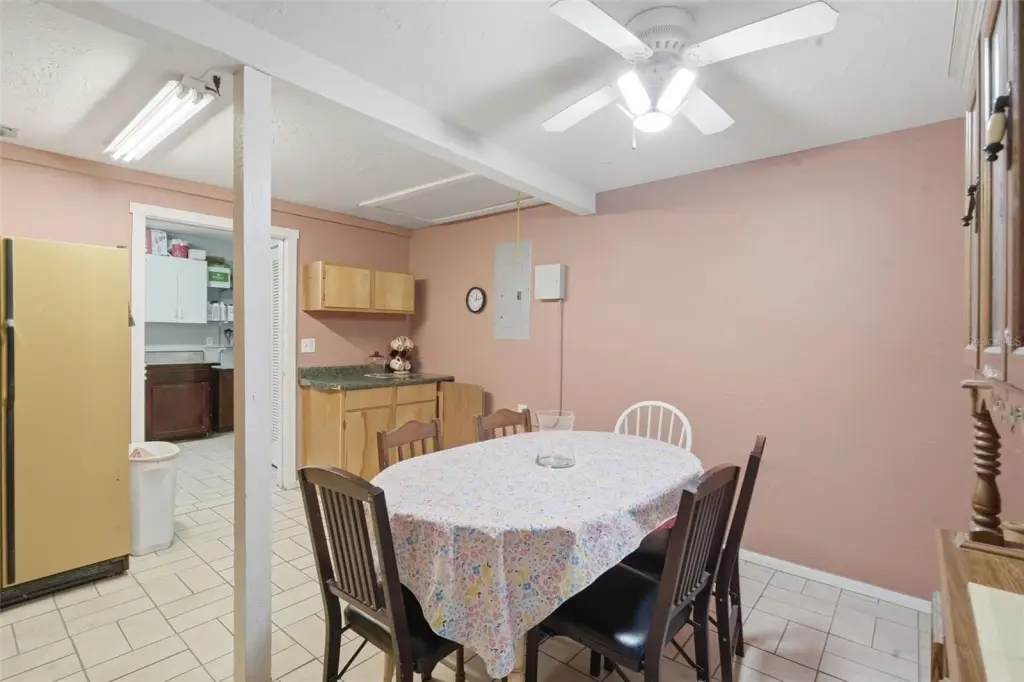
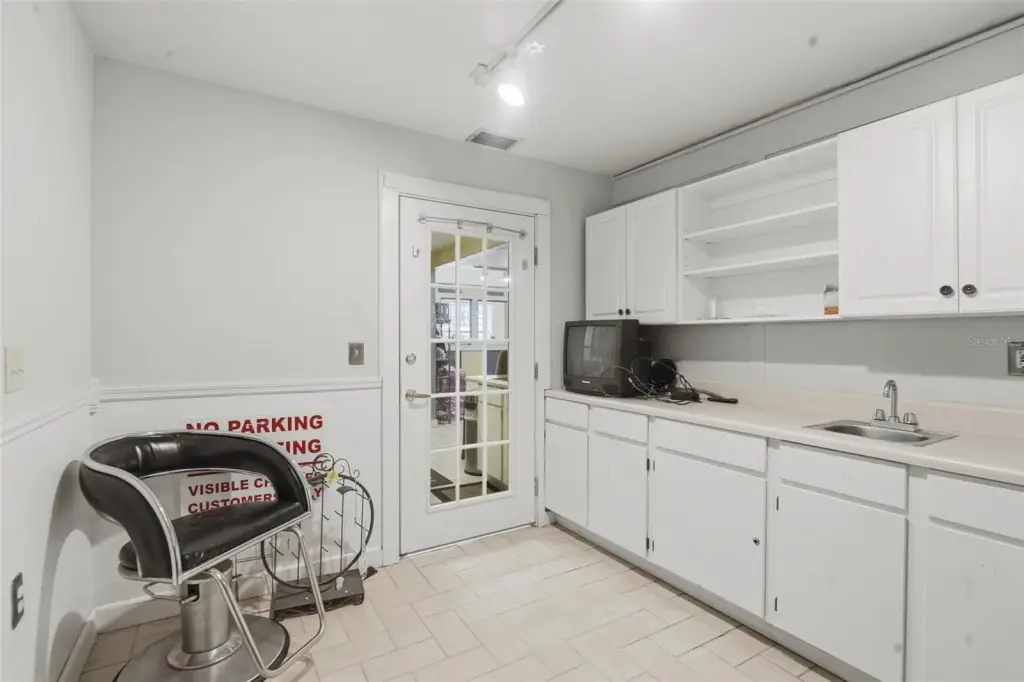
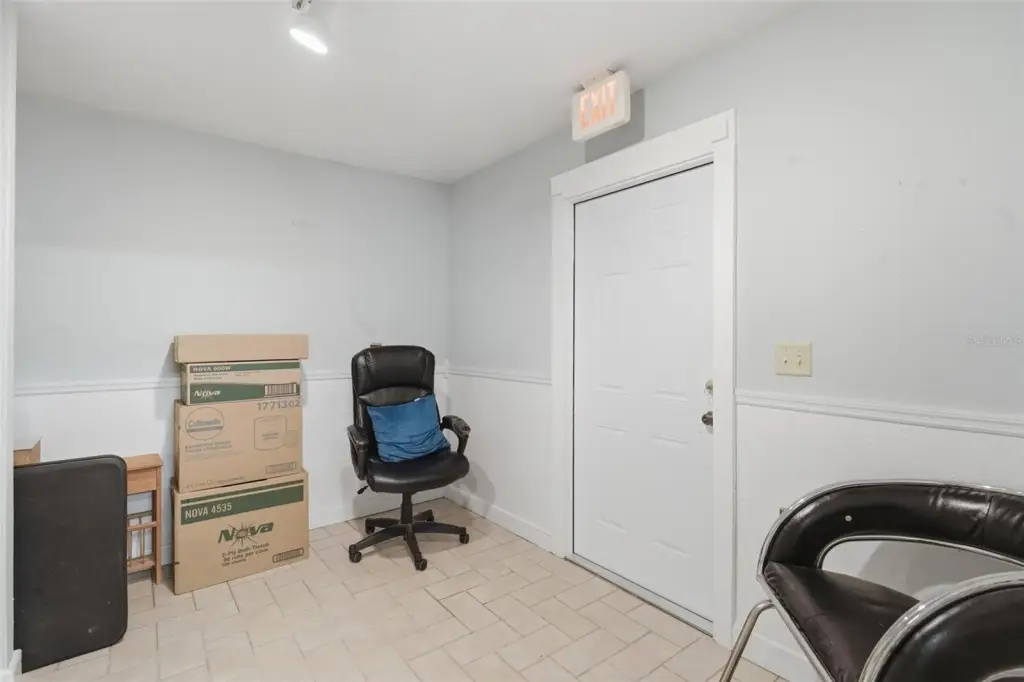
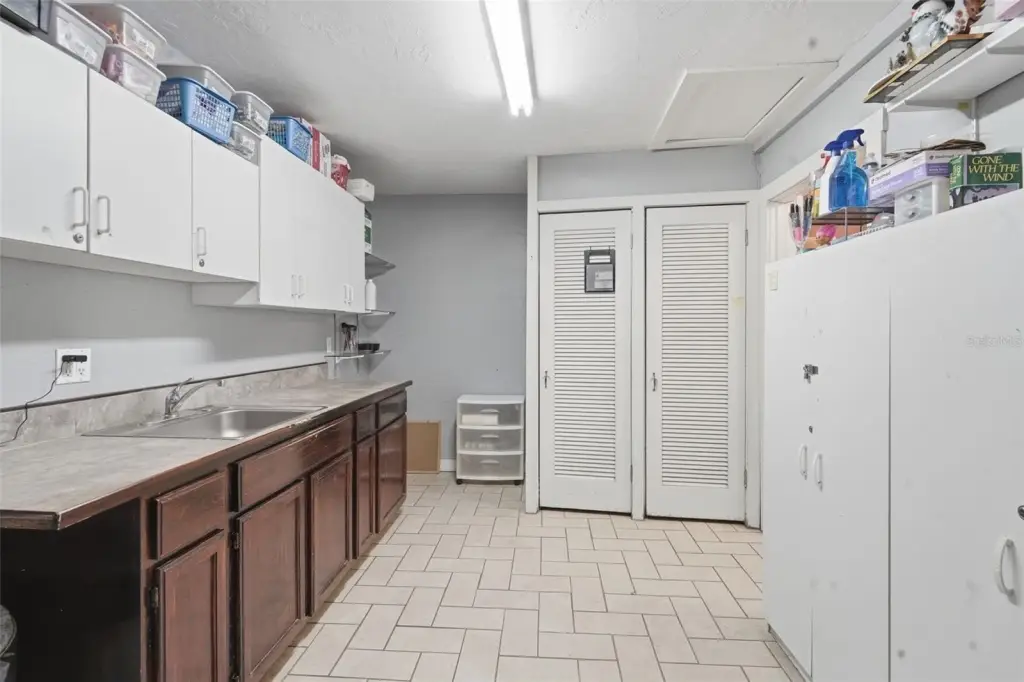
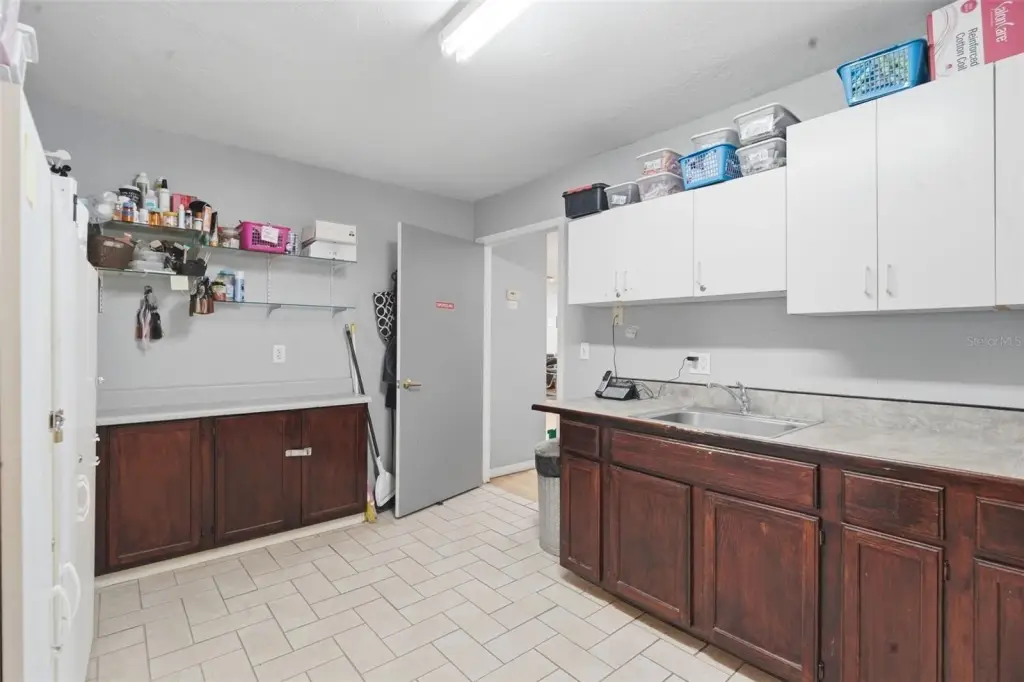
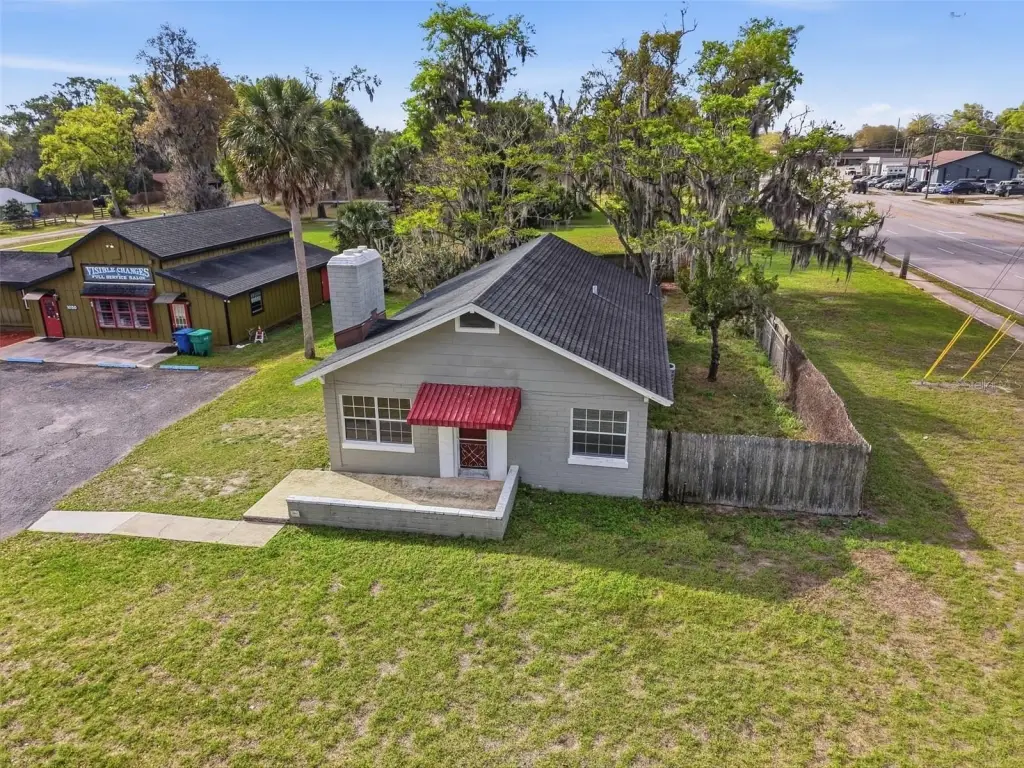
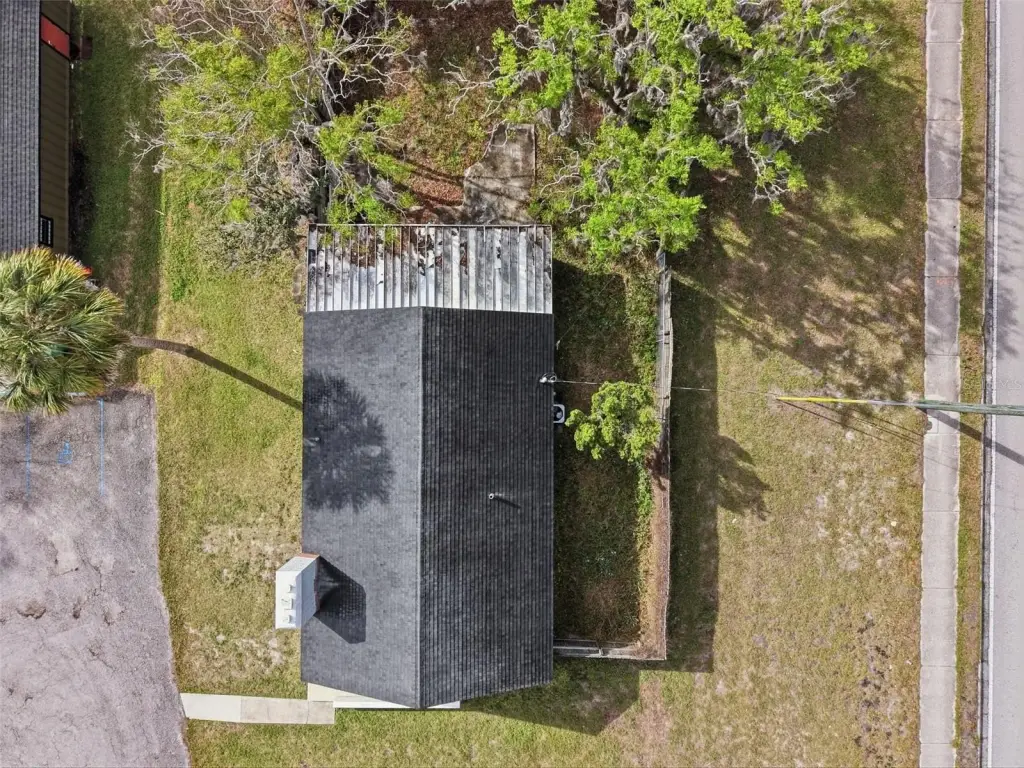
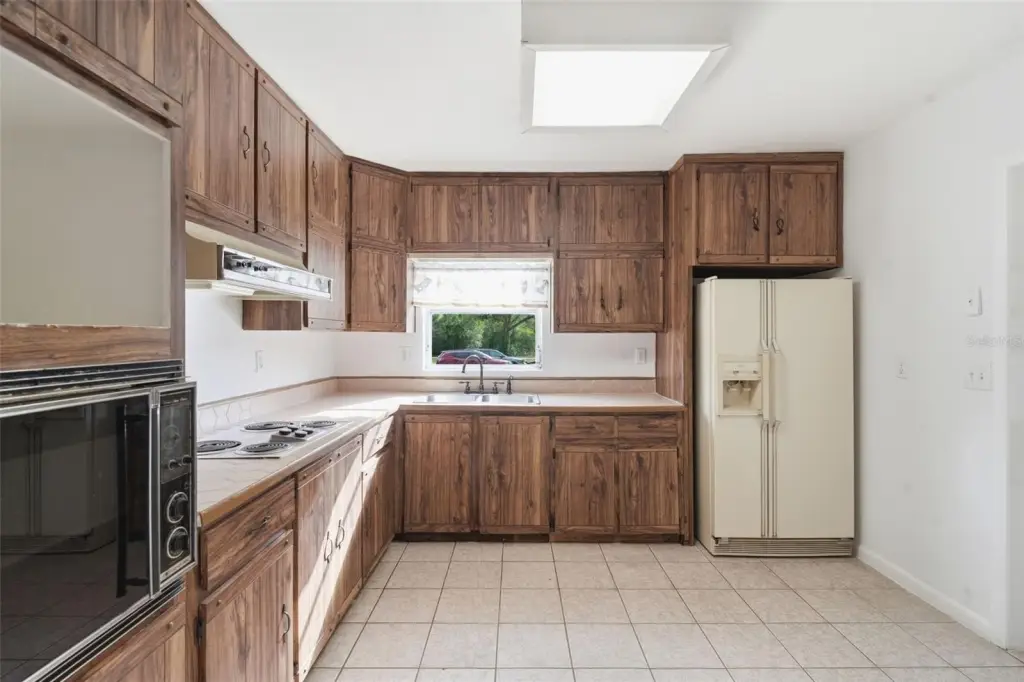
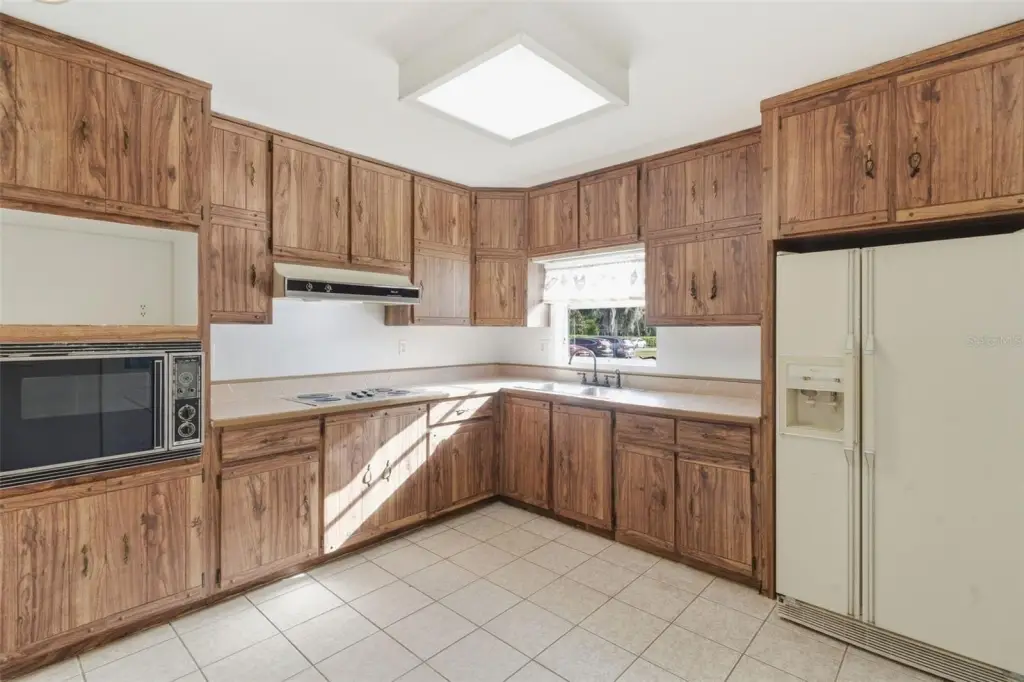
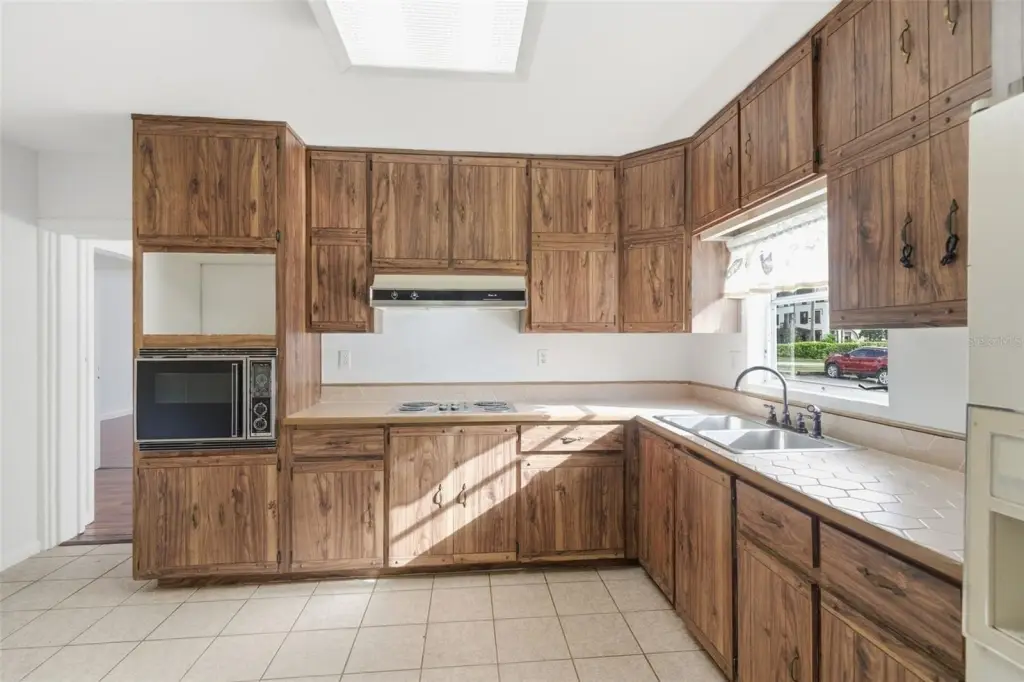
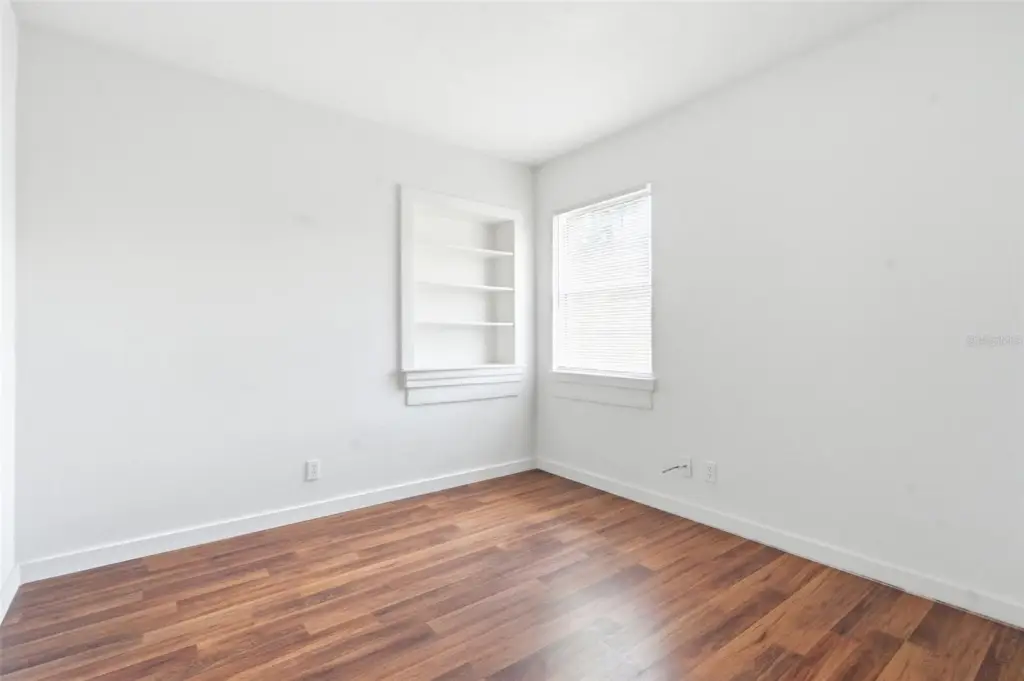
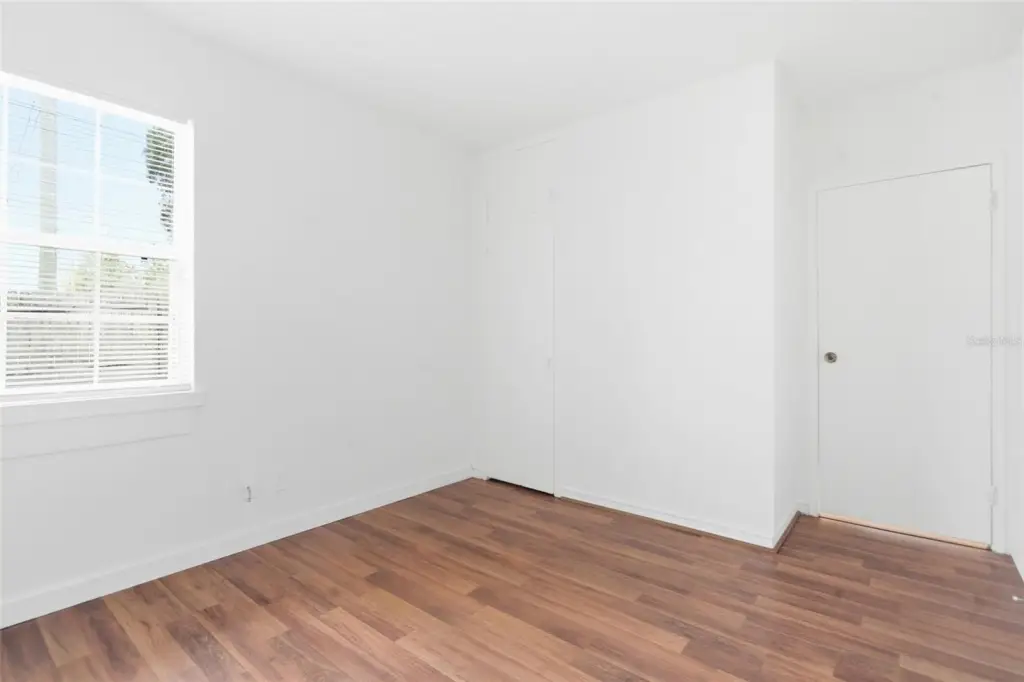
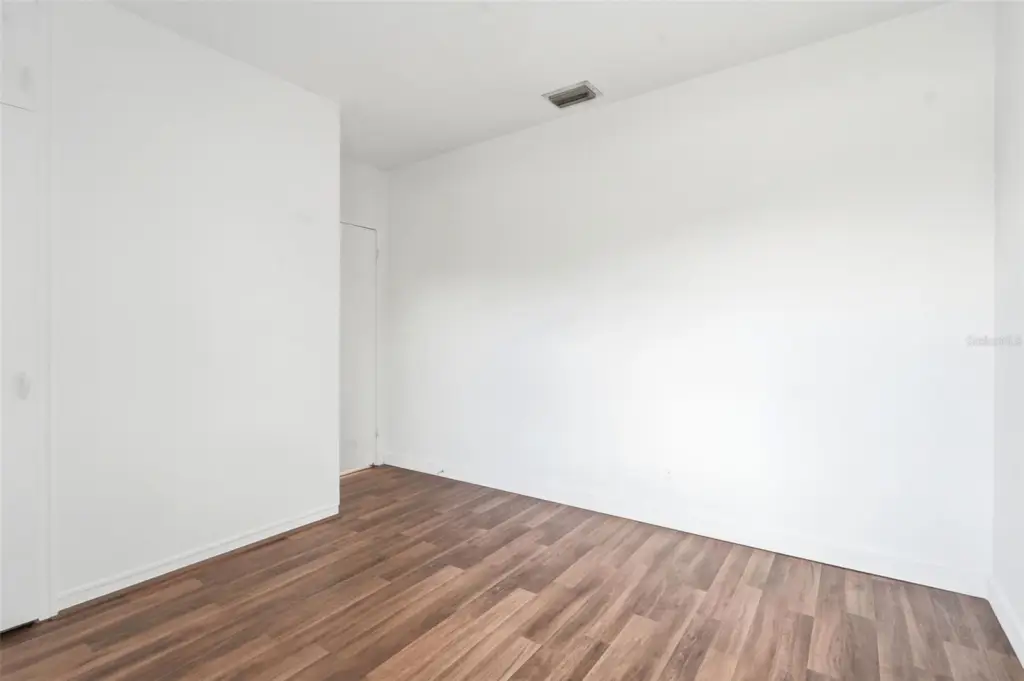
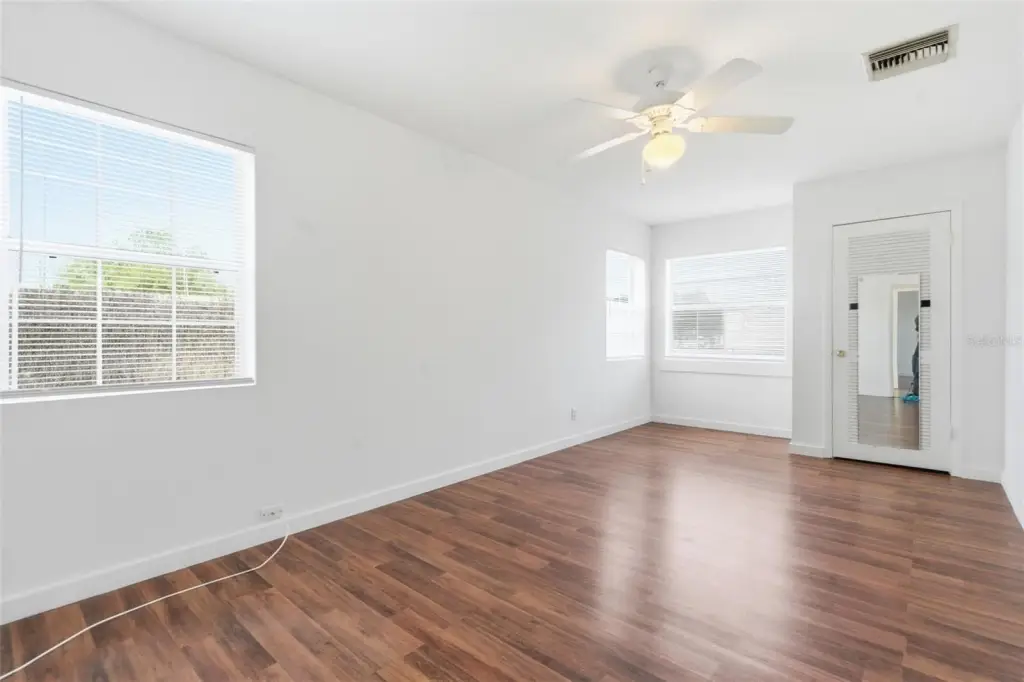
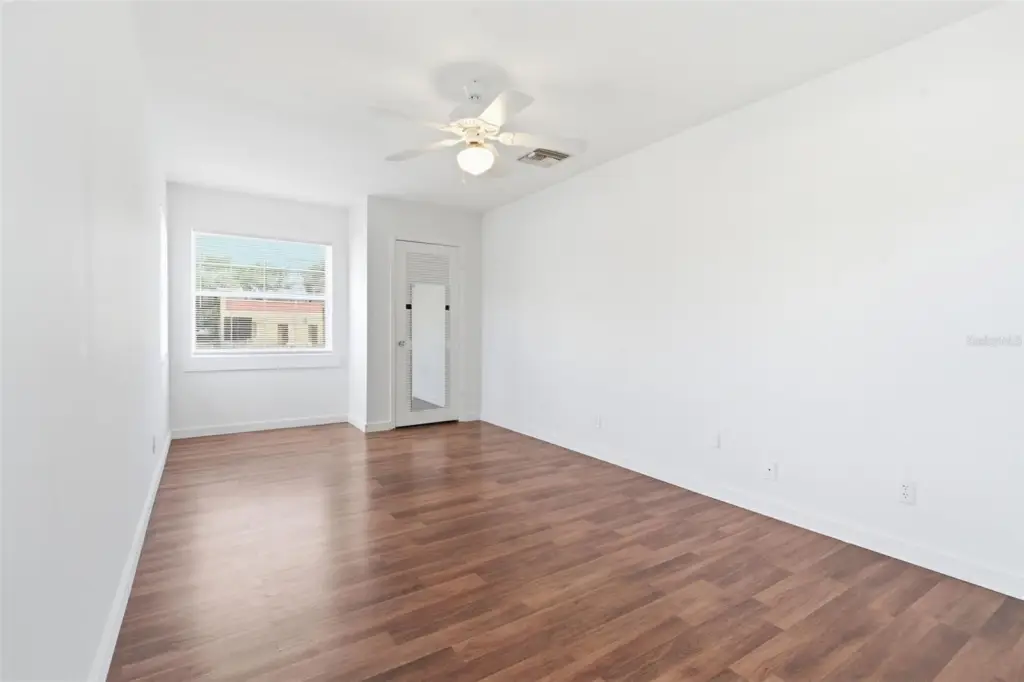
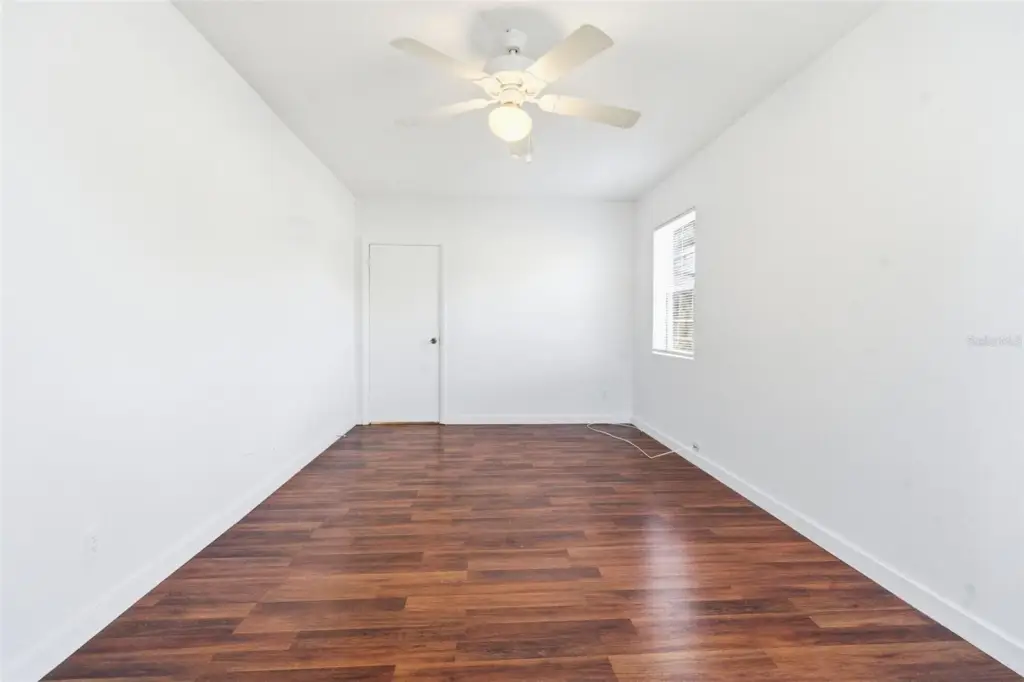
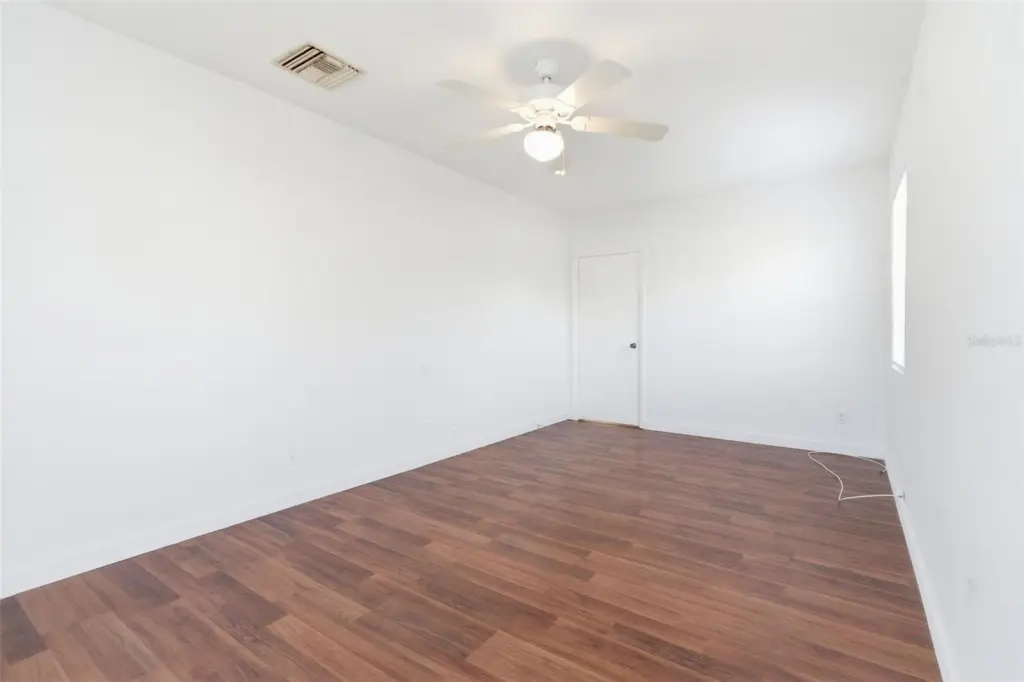
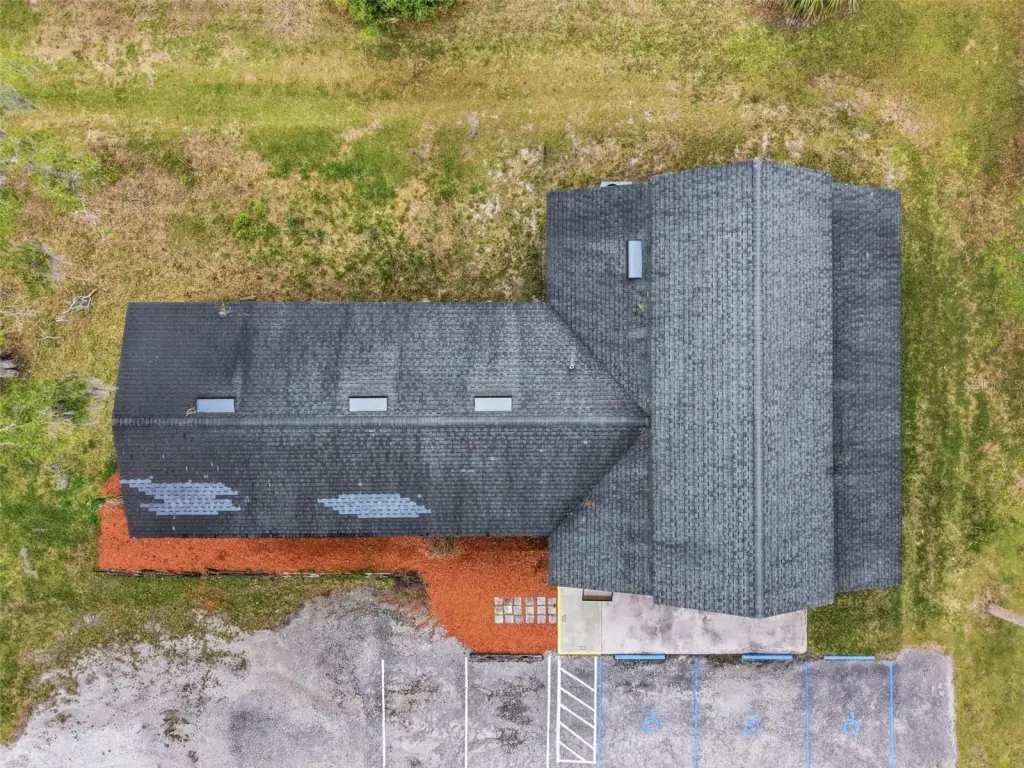
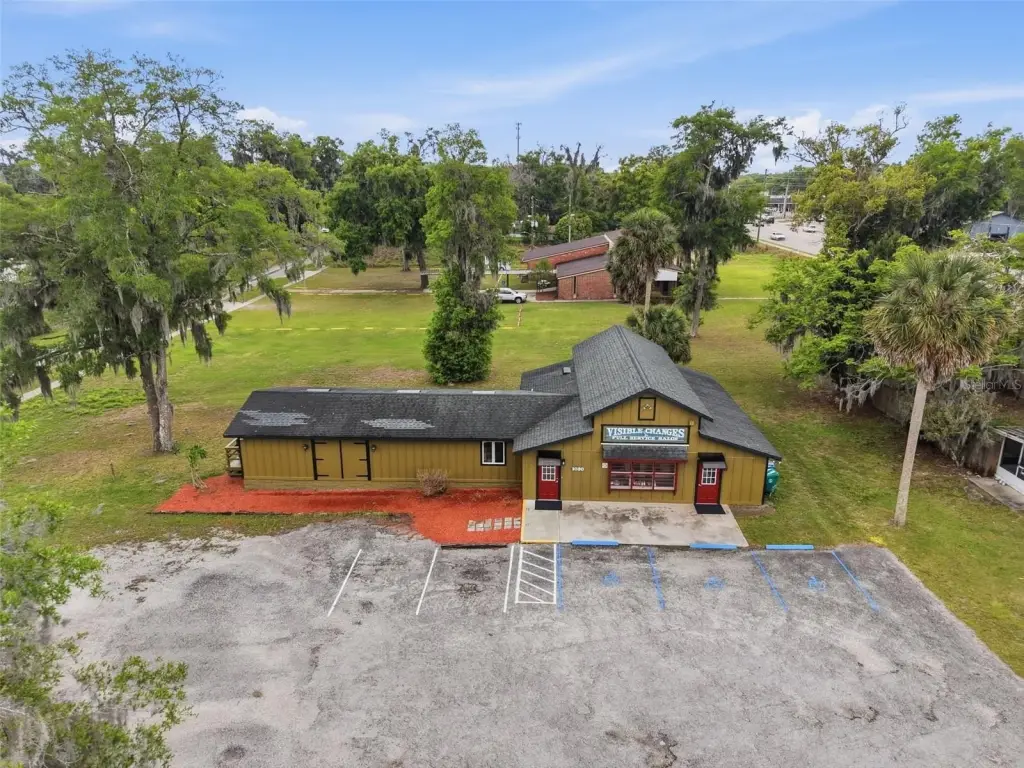
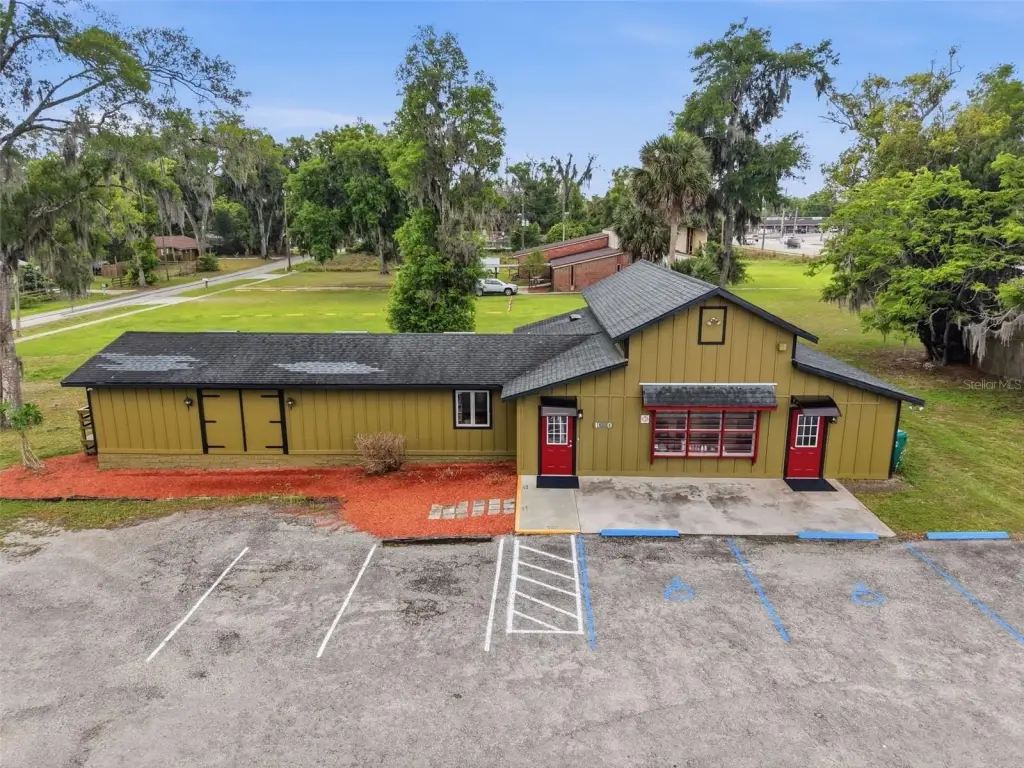
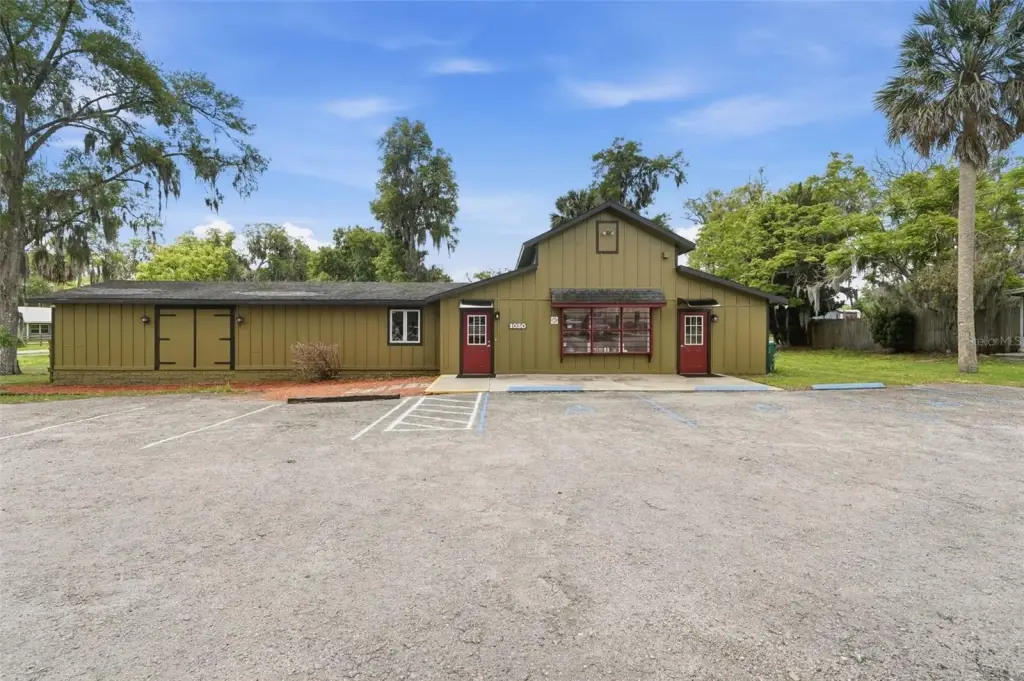
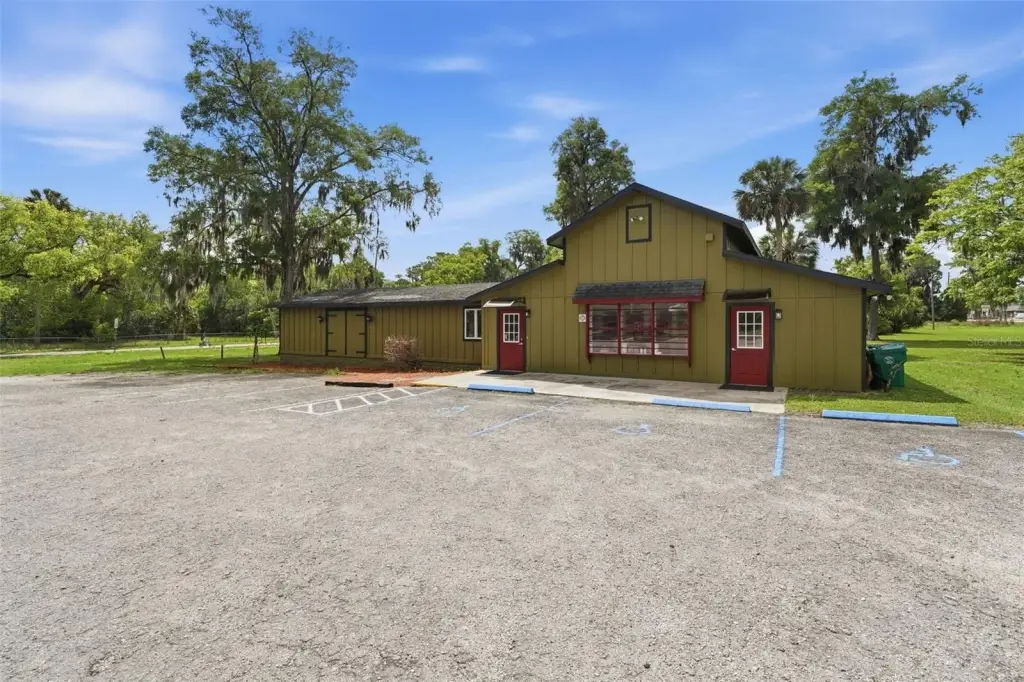
This mixed-use property includes two separate buildings totaling 3,430 square feet on approximately 0.65 acre. The primary commercial building provides approximately 2,400 square feet of heated and cooled space, with an open operating area, conference room, kitchen, additional rooms, and a layout offering 5 to 6 potential private offices. A business is currently operating in the commercial building.
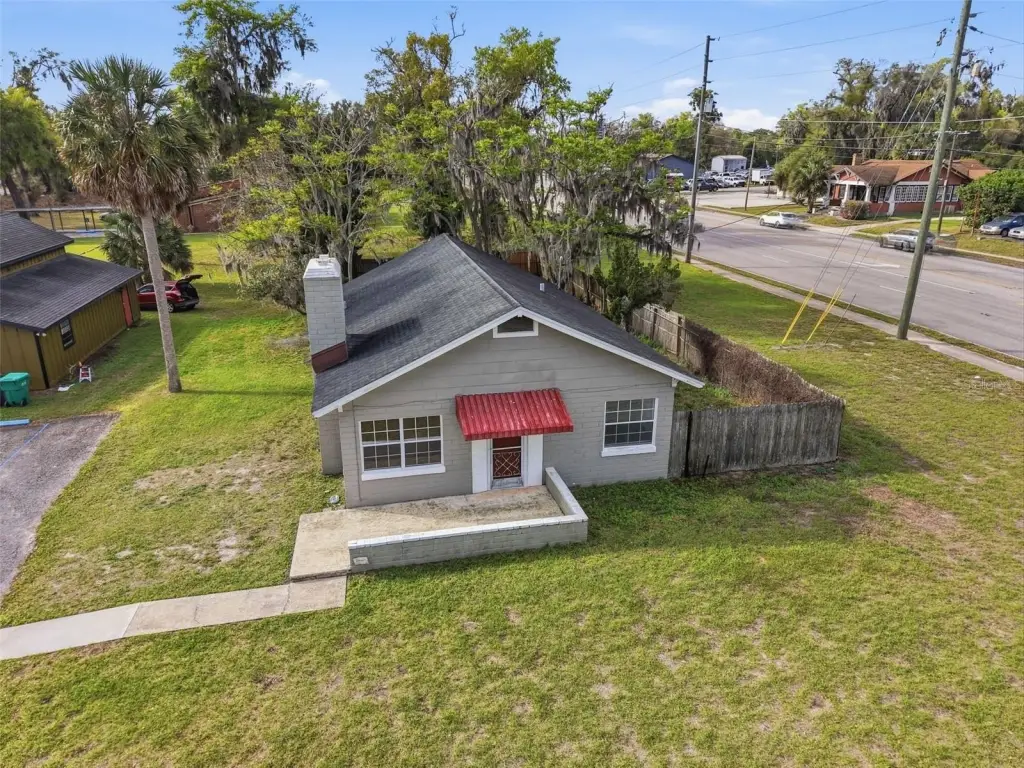
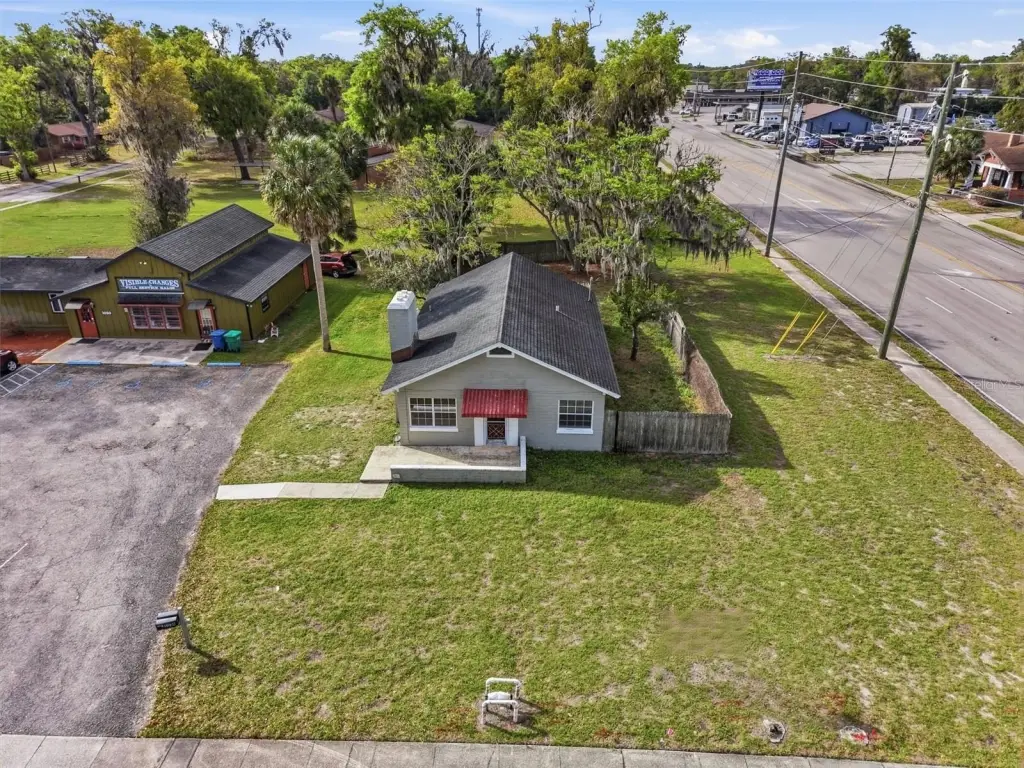
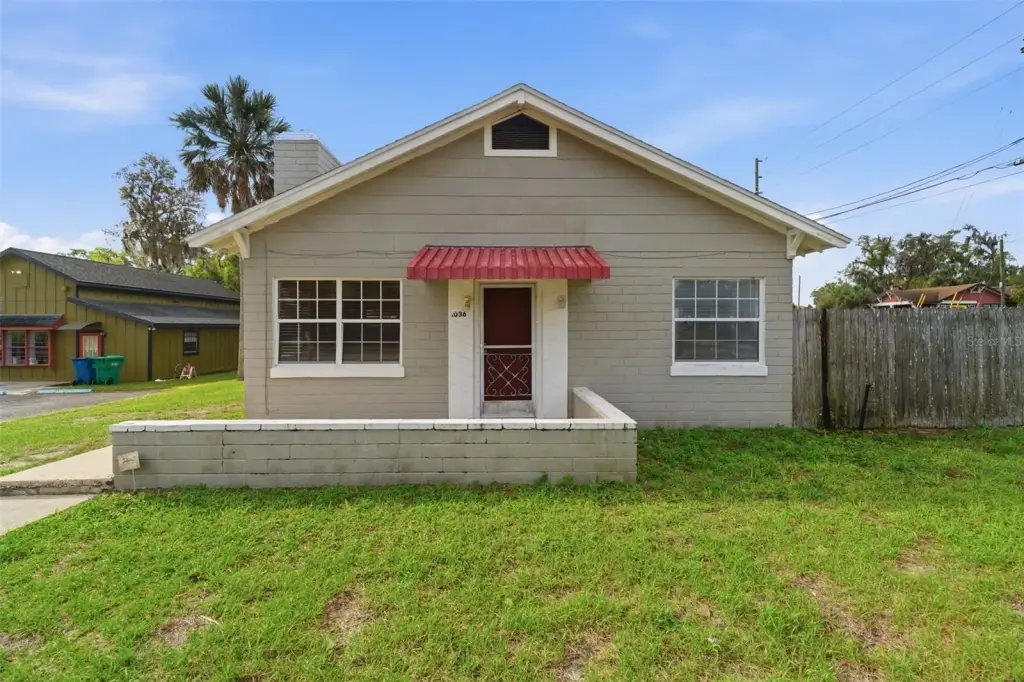
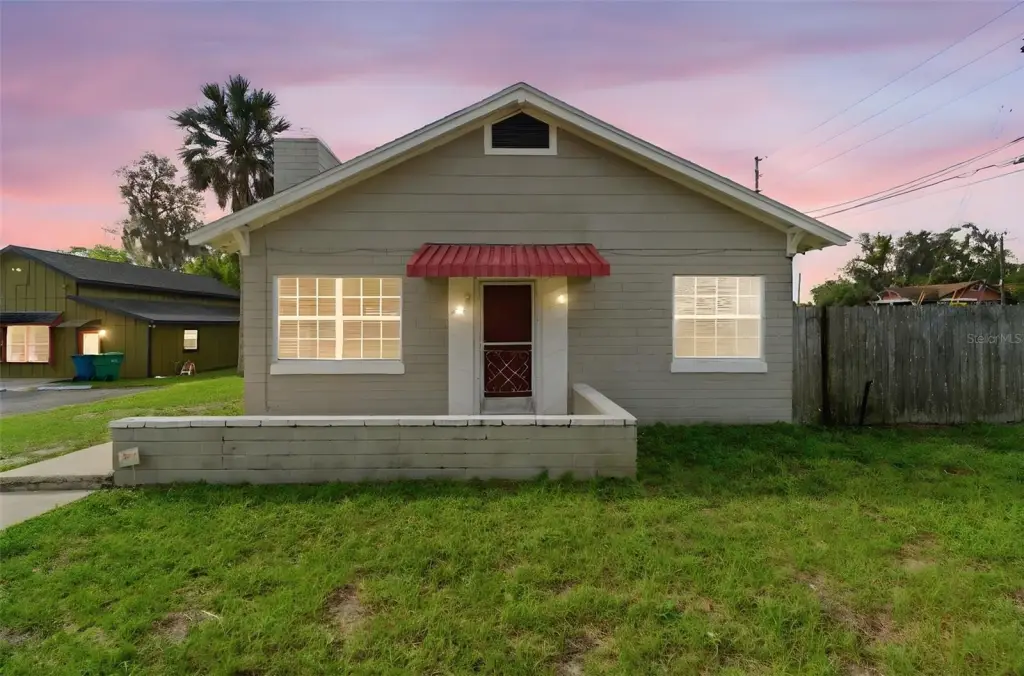
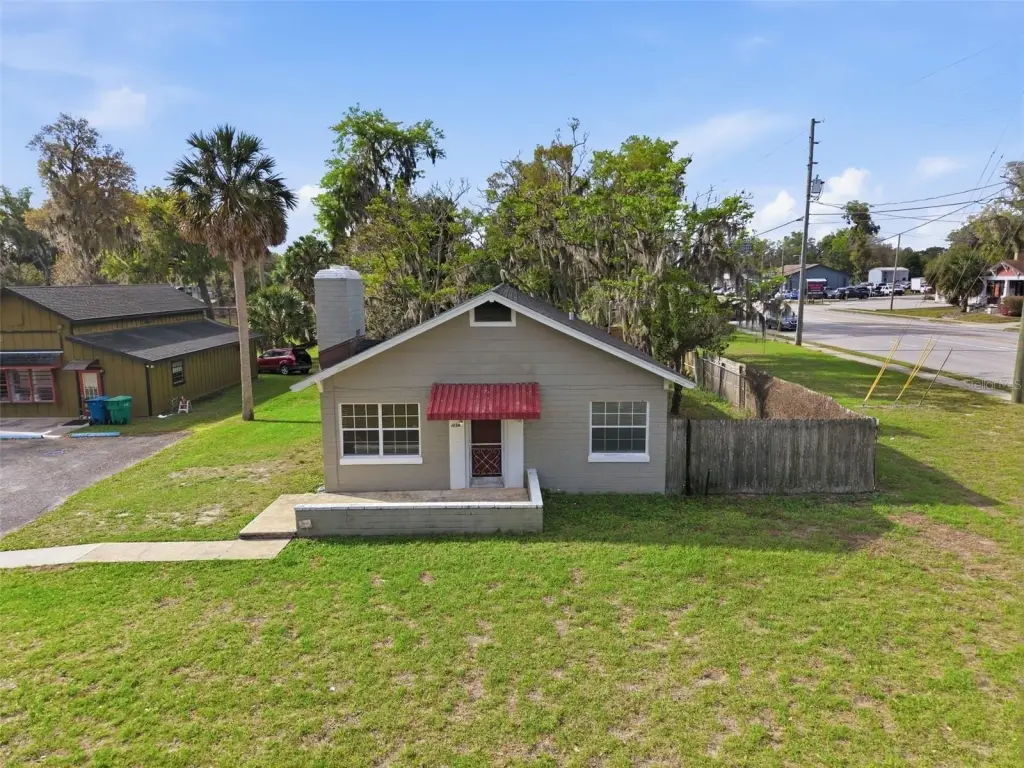
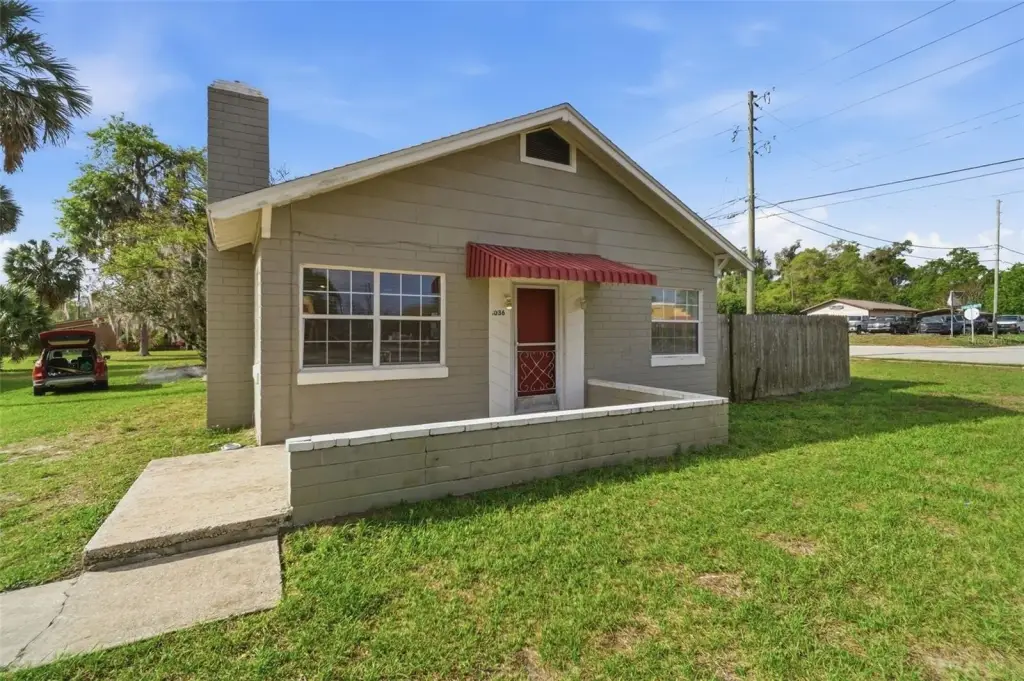
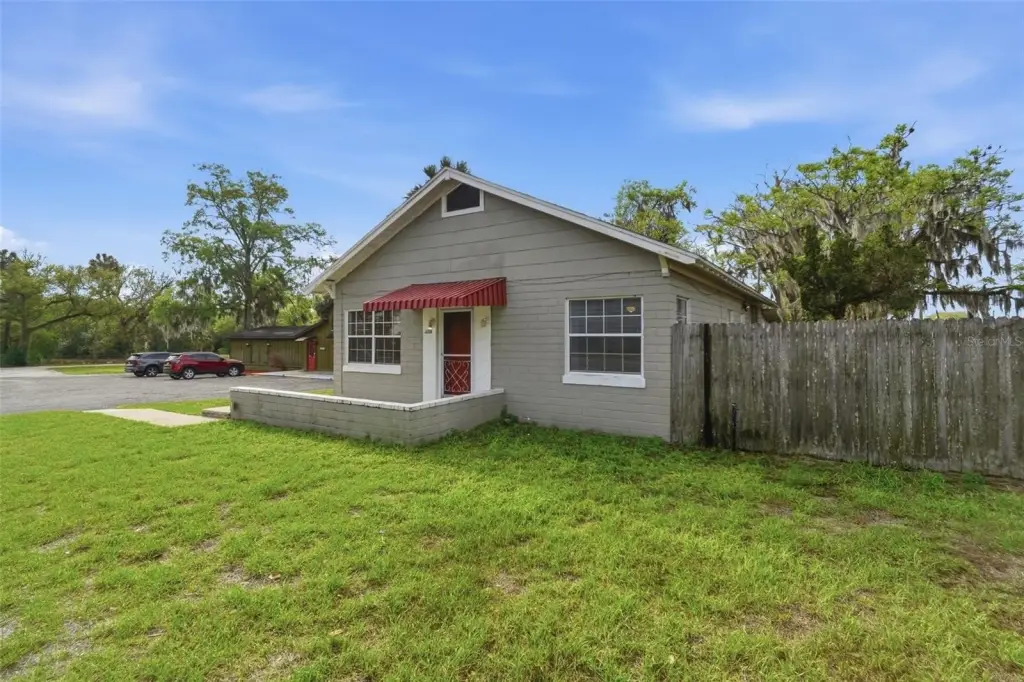
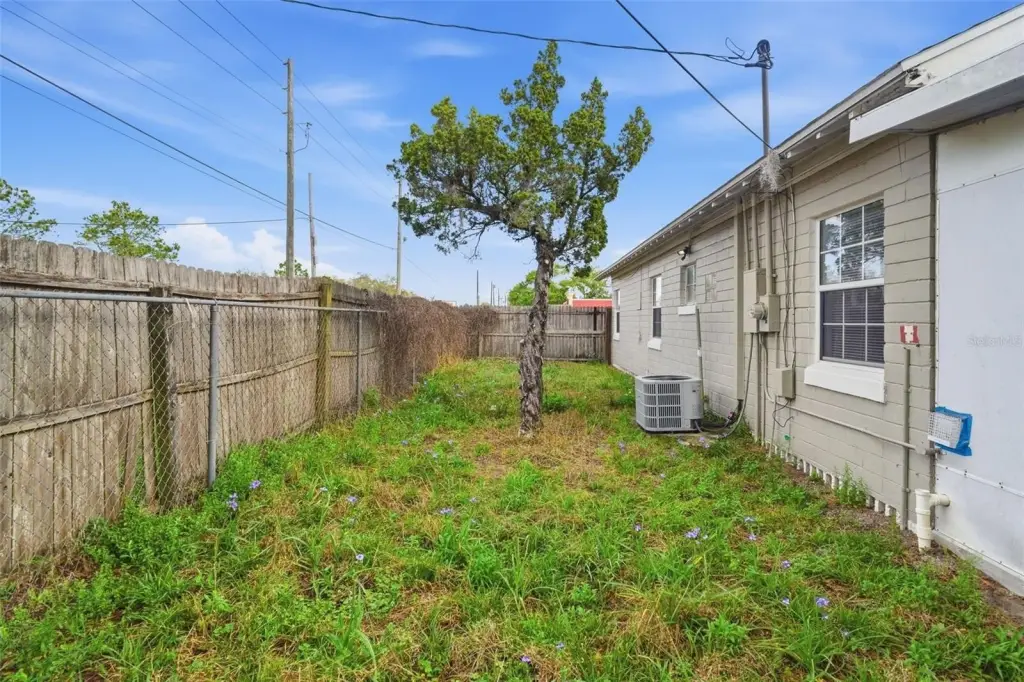
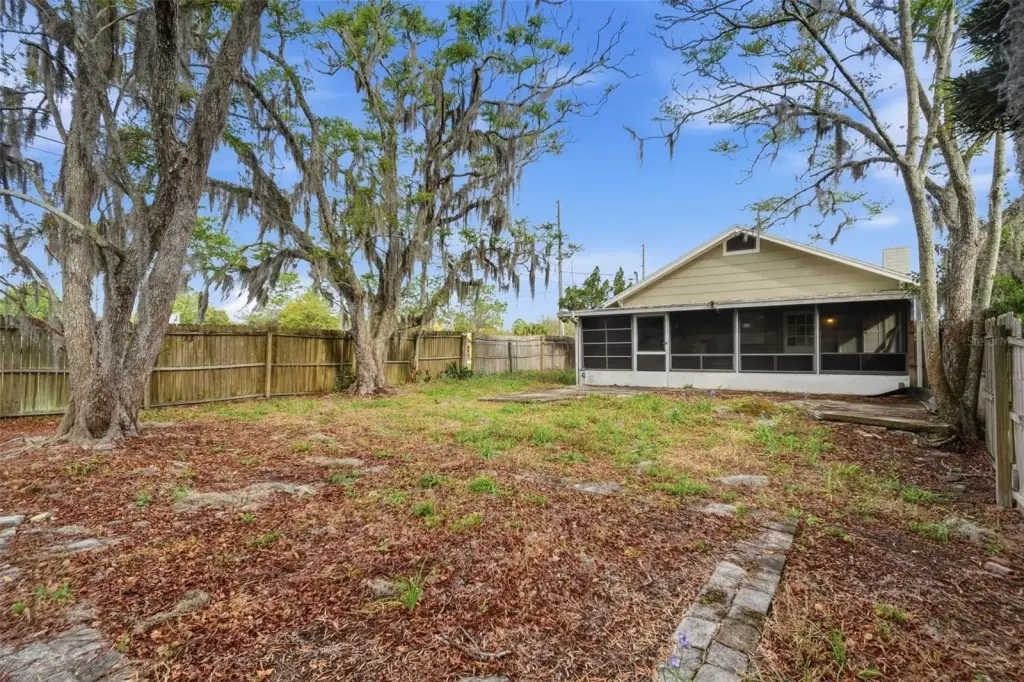
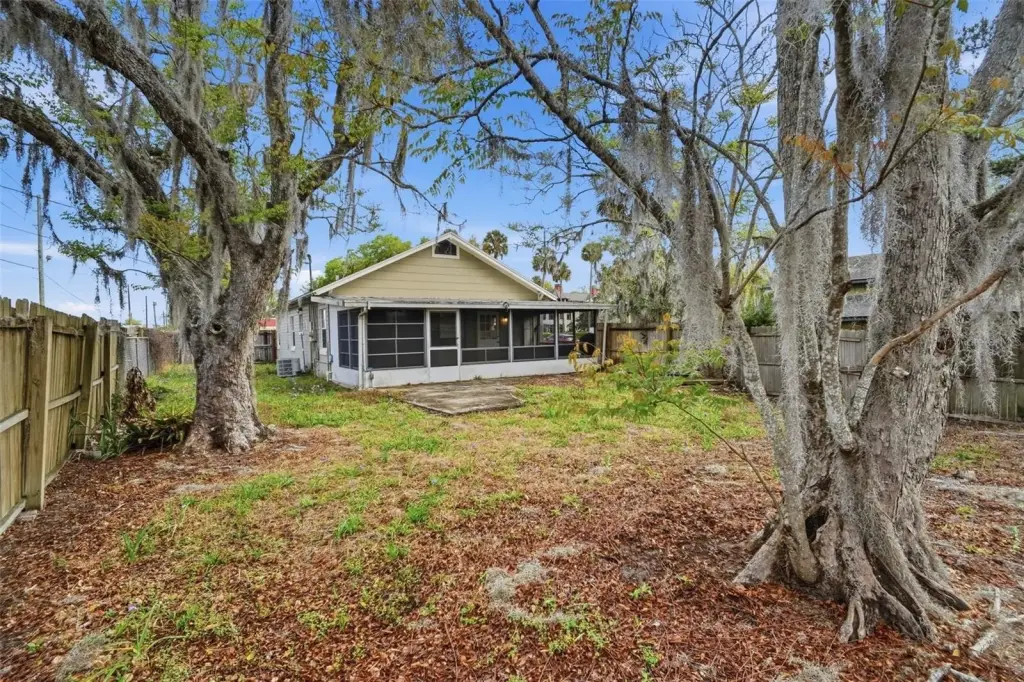
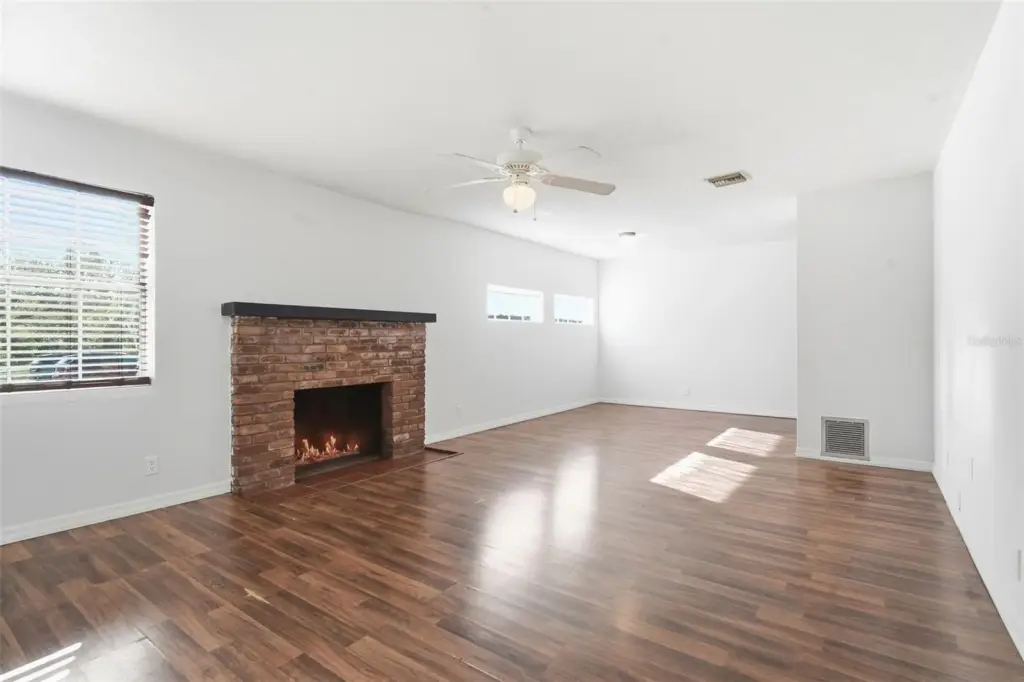
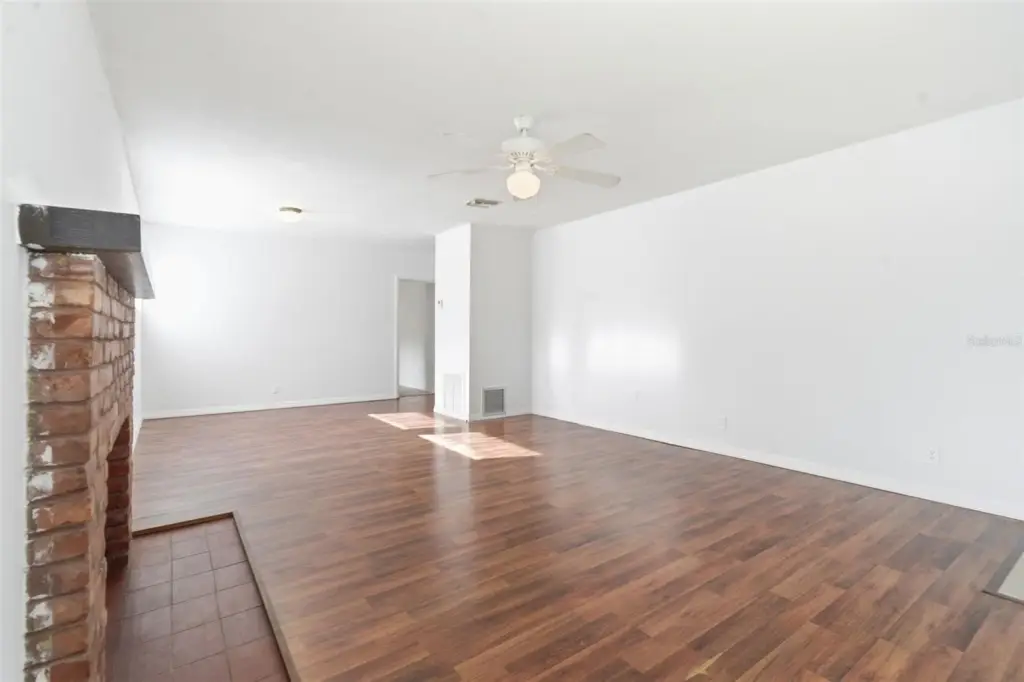
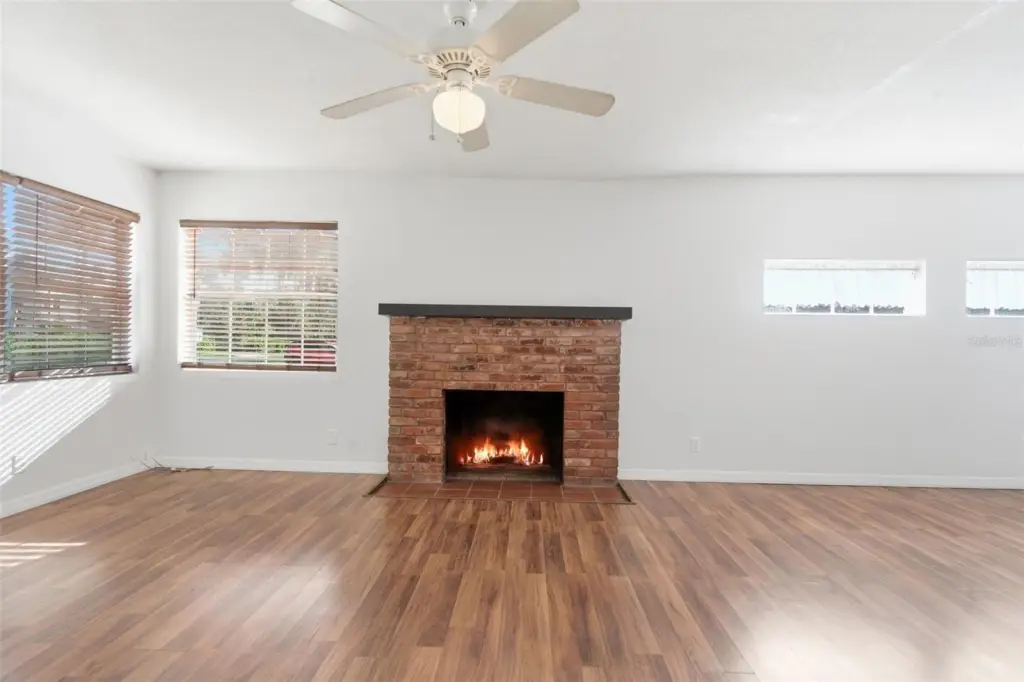
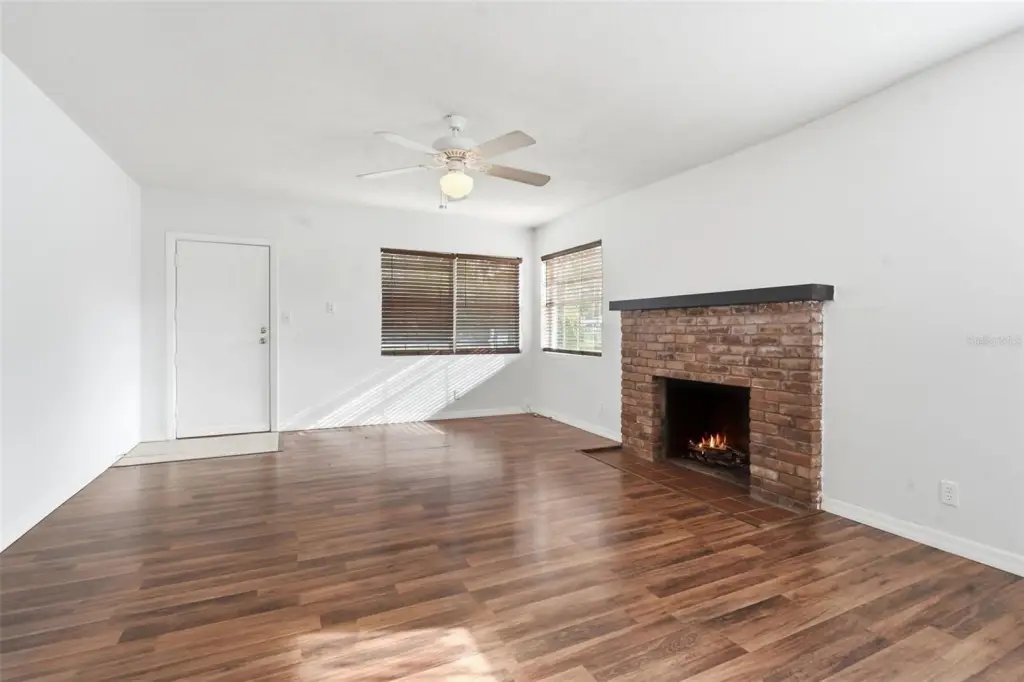
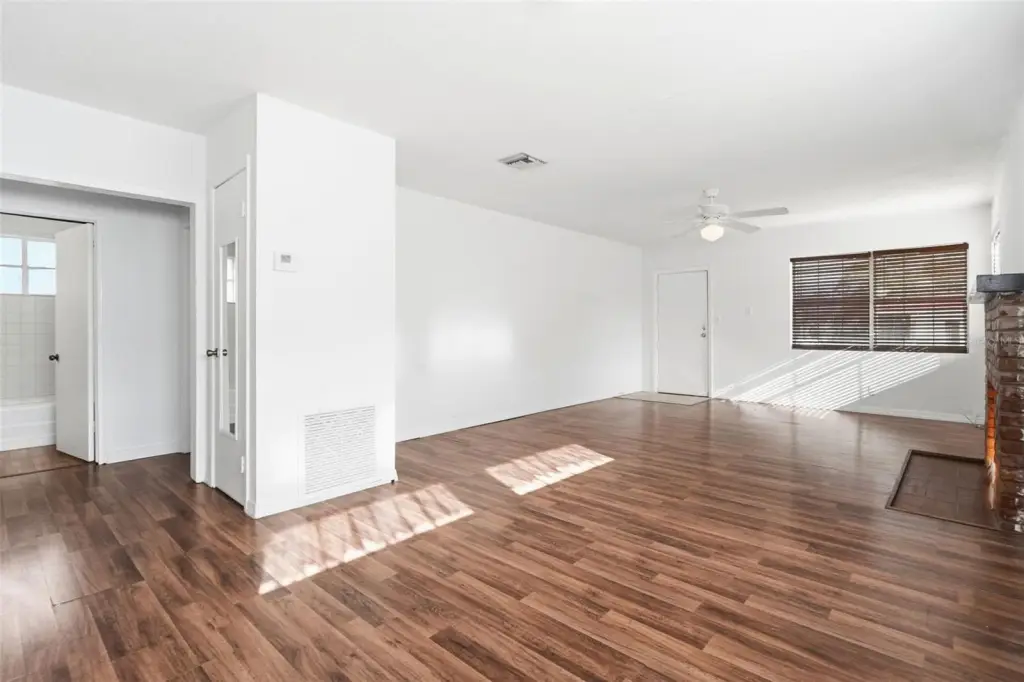
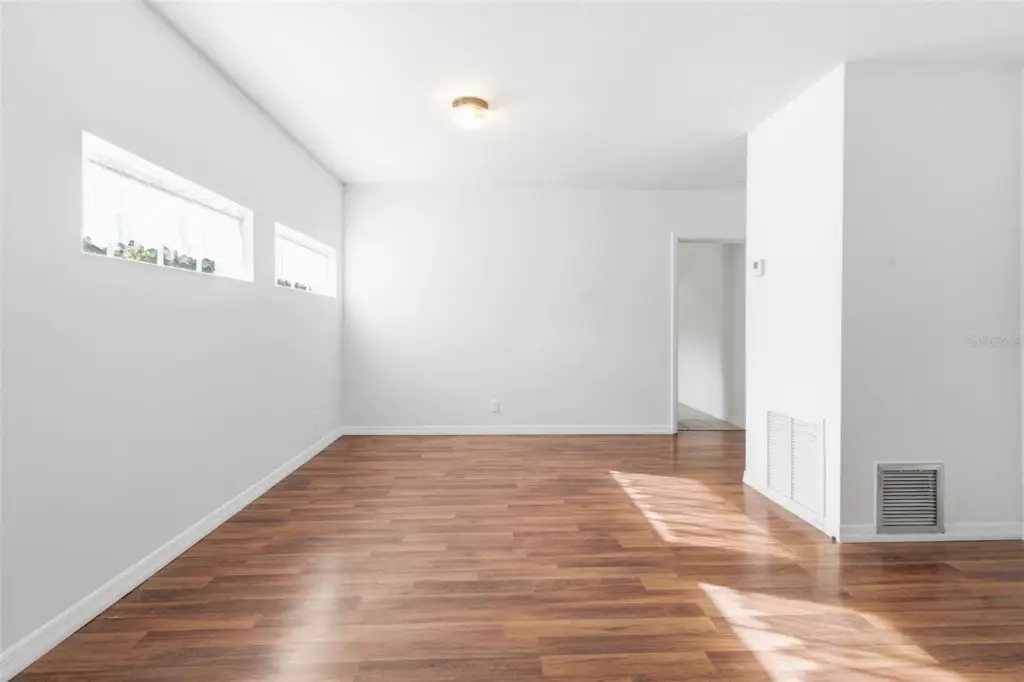
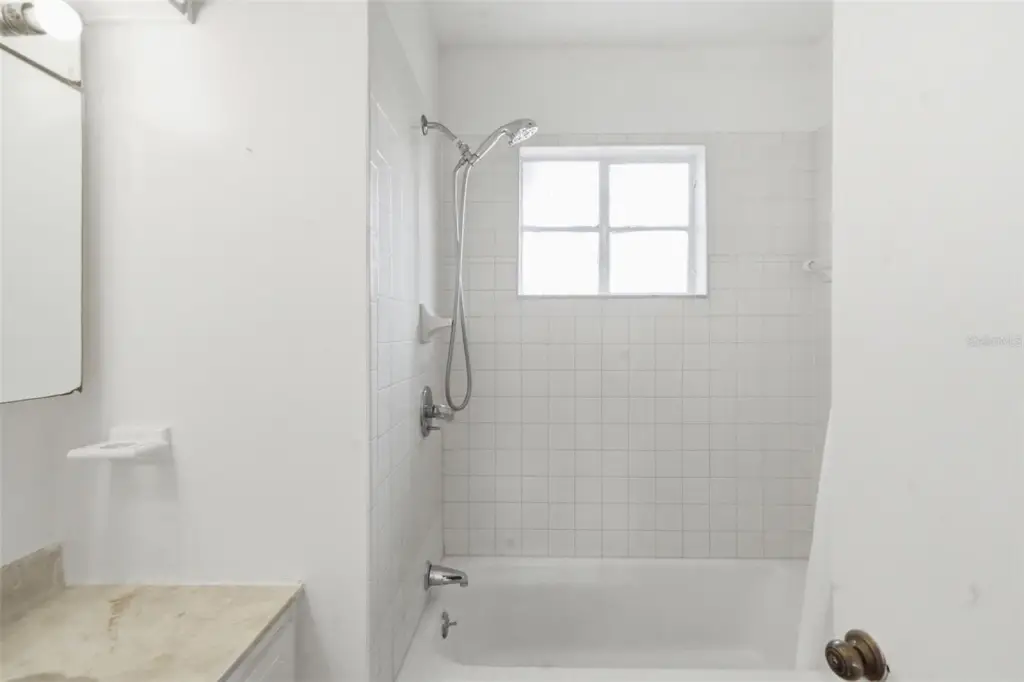
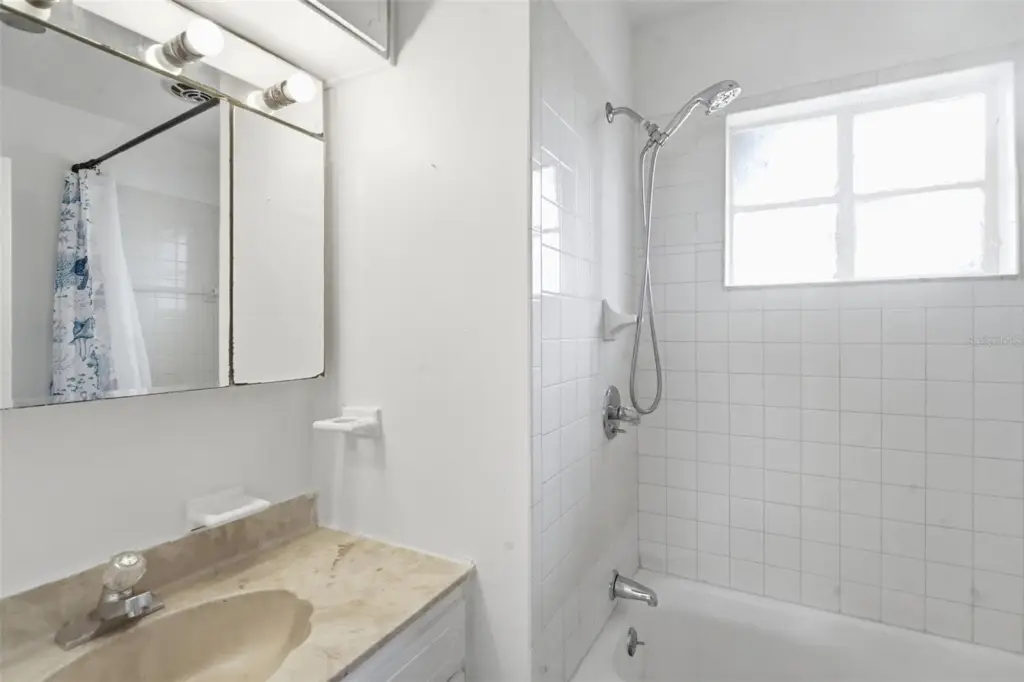
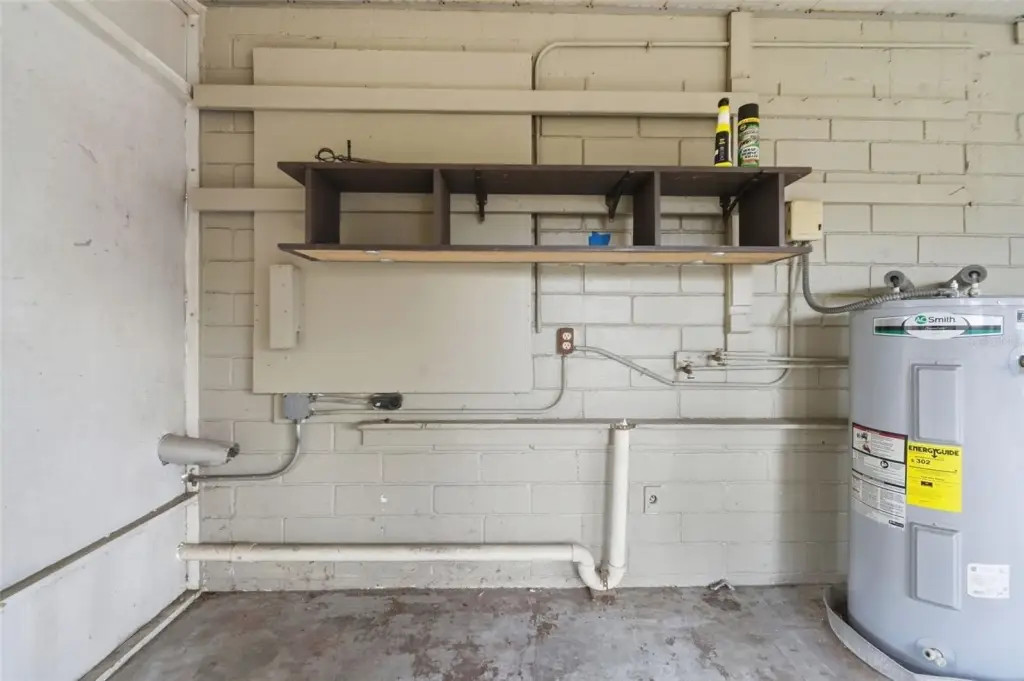
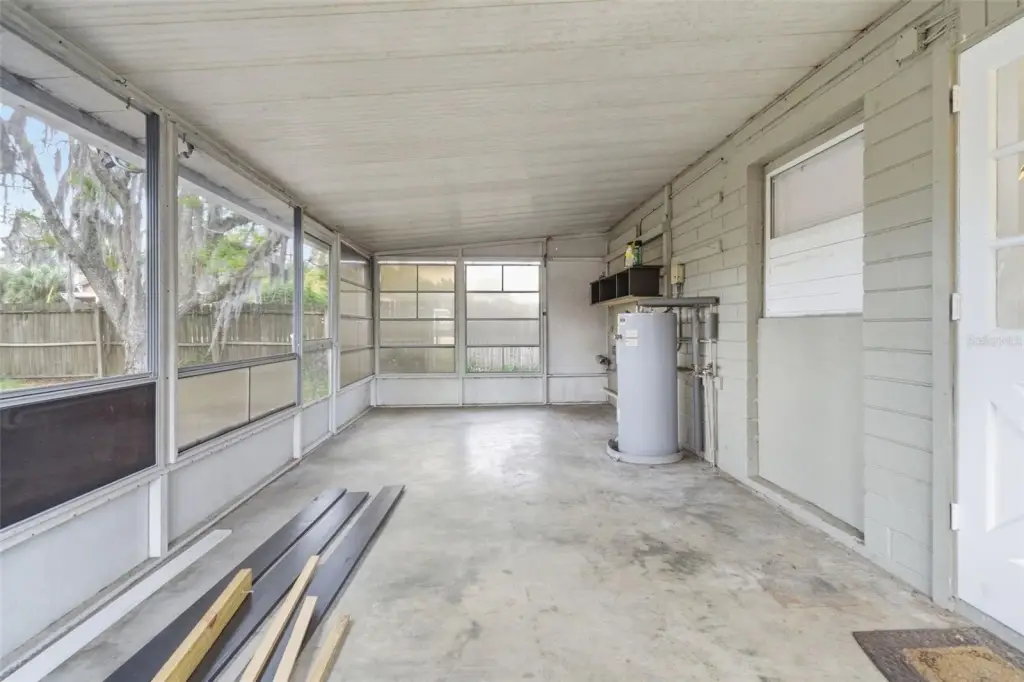
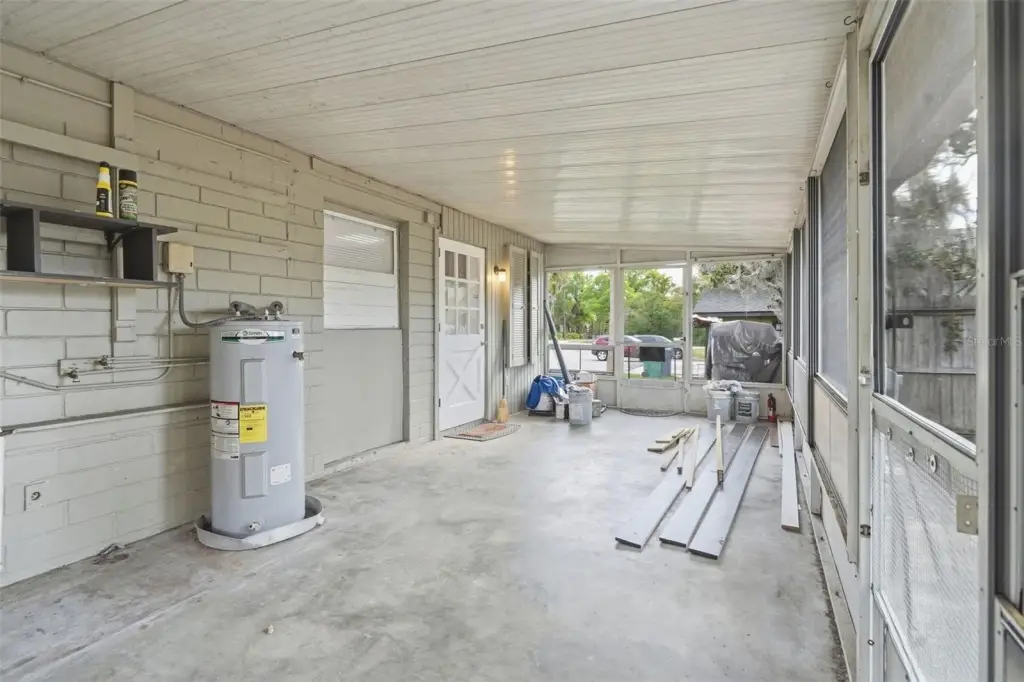
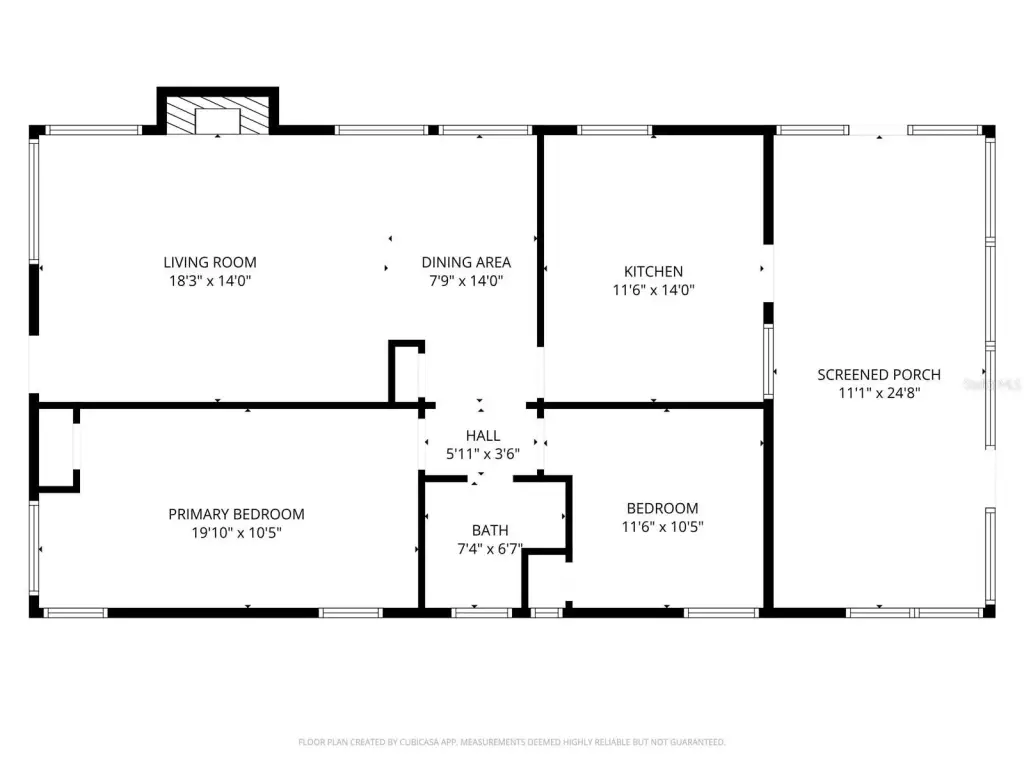
The second improvement is a block single-family residence with 2 bedrooms, 1 bath, and a screened porch. Recent work includes exterior wood-rot replacement, fresh exterior paint, new doors, awnings, exterior decking, and repainted parking lines. Interior features include ceramic tile, reclaimed wood, and carpet flooring, along with central heating and central air. The property has public water, a septic tank, electricity available, and a shingle roof. Zoning is 01B4.
The second improvement is a block single-family residence with 2 bedrooms, 1 bath, and a screened porch. Recent work includes exterior wood-rot replacement, fresh exterior paint, new doors, awnings, exterior decking, and repainted parking lines. Interior features include ceramic tile, reclaimed wood, and carpet flooring, along with central heating and central air. The property has public water, a septic tank, electricity available, and a shingle roof. Zoning is 01B4.
Key Highlights
- Two‑building mixed‑use property totaling 3,430 square feet on approximately 0.65 acre
- Main commercial building offers approximately 2,400 square feet of heated and cooled space
- Commercial layout includes 5 to 6 potential private offices, conference room, kitchen, and open operating area
Financial Insights
Estimated NOI and Cap Rate
NOI / Yr
$51,399
Cap Rate
7.40%
Suggested Prices Based on Cap Rates
Cap Rate 5%
$1,027,980
$1.0M
Cap Rate 7%
$734,271
$734.3K
Cap Rate 9%
$571,100
$571.1K
Market Conditions
NOI Build-Up for 3,430 SF
Gross rent
$74.1K $21.60/SF
− Vacancy
−$5.6K −$1.62/SF
EGI
$68.5K $19.98/SF
− OpEx
−$17.1K −$5.00/SF
NOI
$51.4K $14.99/SF
Area
Volusia County, FL
Vacancy
7.50%
Lease Rate
$21.60 /SF/Yr
Expense Ratio
25.00%
Simulate Cap Rate and NOI
Suggested Prices Based on Cap Rates
Cap Rate 5%
$1,027,980
Cap Rate 7%
$734,271
Cap Rate 9%
$571,100
Alternative Uses
Best Use
Office B
$734.3K
$642.5K – $856.7K
NOI $51,399 @ 7.0% cap · market cap 7.40%
Second Best
Mixed Use
$605.3K
$529.6K – $706.2K
NOI $42,369 @ 7.0% cap · market cap 6.10%
Theoretical Best
Office A
$1.01M
$884.9K – $1.18M
NOI $70,795 @ 7.0% cap · market cap 10.19%
Zoning and permitted uses should be independently verified with authorities.
Property Analytics
Unlock full access to Insights
Subscribe to Realmo Intelligence
Open Analytics
Current Use
Lease Details
Single-tenant
Tenancy
Location Intelligence
Trade Area within ½ mile
442
Businesses Nearby
Explore this area
Business Placement
Demographics for 32720, FL
33,568
Population
13,962
Households
2.4
Avg Household Size
45
Median Age
24%
College-Educated
88%
High-School Grad
66.3 sq mi
ZIP Area
506
Density / Sq Mi
$67,512
Median Household Income
$39,159
Median Earnings
$1,177
Median Rent
$280,600
Median Home Value
Check the figures for this property
Cap Rate, Value Estimation, Potential NOI and more
View Realmo Analytics
Market
Vacancy Rate% for Office in South region

Questions? Ask Rey
Realmo’s AI knows this listing — price, zoning, demand, history. Ask anything.




Frequently Asked Questions
What type of property is this?
Mixed-use property - Two-building commercial property combines adaptable business space with a separate two-bedroom residence on a corner parcel.
Where is this mixed-use property located?
The property is located at 1030 CAMPHOR Lane Deland, FL.
What is the asking price?
The asking price for this property is $695,000.
What are key features of this property?
This property features: Two‑building mixed‑use property totaling 3,430 square feet on approximately 0.65 acre; Main commercial building offers approximately 2,400 square feet of heated and cooled space; Commercial layout includes 5 to 6 potential private offices, conference room, kitchen, and open operating area


