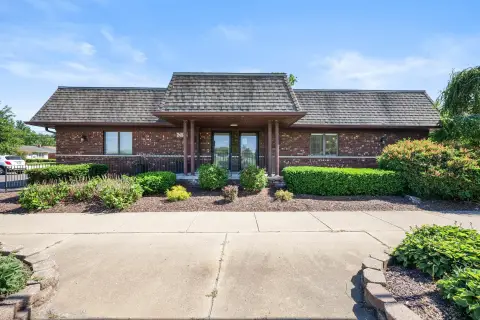
Mixed-Use Property with
For Sale
$650,000
23589 Van Born Road, Taylor, MI 48180
Multifamily, 2 Story, Taylor, MI
Property Size6,642 SF
Lot Size0.10 Acres
Price / SF$97.86
Days on Market47
Property Features for 23589 Van Born Road
General Information
Property type
Residential Multi Family
Property subtype
Other
Zoning
Commercial,Office,Residen
Bedrooms
6
Bathrooms
4
Full bathrooms
4
Rooms
Bedroom 3, Bedroom 6, Bathroom 1, Bathroom 2, Bedroom 1, Bathroom 3, Bedroom 2, Bedroom 5, Bedroom 4, Bathroom 4
Pets allowed
Yes
Subdivision
Dearborn-Telegraph-Twnlne Sub 2-Taylor
Elementary school district
Taylor
Middle school district
Taylor
High school district
Taylor
Directions
Van Born and Telegraph
Standard status
Active
APN
60006020956000
Size
6,642 SF
Lot size
0.10 Acres
Taxes and HOA fees
Tax Description
04D956 957 LOTS 956 AND 957 DEARBORN-TELEGRAPH-TOWNLINE SUB NO. 2 T3S R10E L54 P47 WCR
Tax Annual Amount
7522
Legal Description
04D956 957 LOTS 956 AND 957 DEARBORN-TELEGRAPH-TOWNLINE SUB NO. 2 T3S R10E L54 P47 WCR
Utilities
Heating system
Forced Air
Water source
Public
Building Details
Year built
1953
Floors in Building
2
Number of units
4
Building materials
Block, Brick
Roof type
Asphalt
Architectural style
Other
Listing Agency:
Keller Williams Advantage · Keller Williams Realty
(248) 380-8800
Listed By:
Linda L Leporowski · License #6501305996
(734) 502-0456
Added: Aug 20
Changed: Sep 16
Last Checked: Oct 5 at 10:06PM
MLS# 20261066576
Copyright © 2026 Realcomp Limited II. All rights reserved. All information provided by the listing agent/broker is deemed reliable but is not guaranteed and should be independently verified.
Investment Insights
Based on property information with market context.
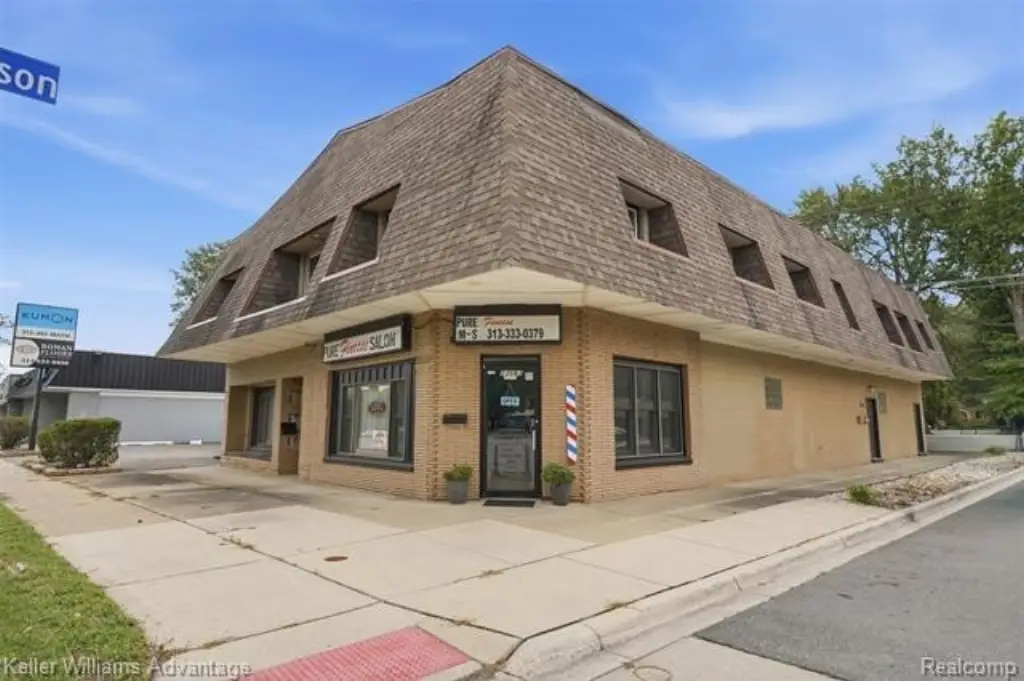
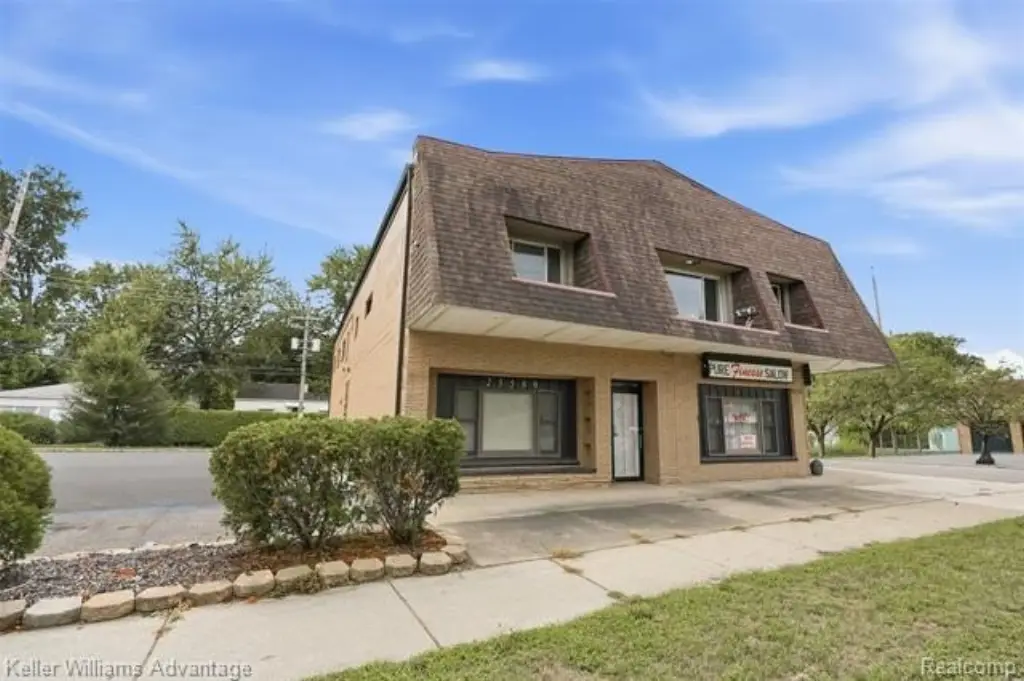
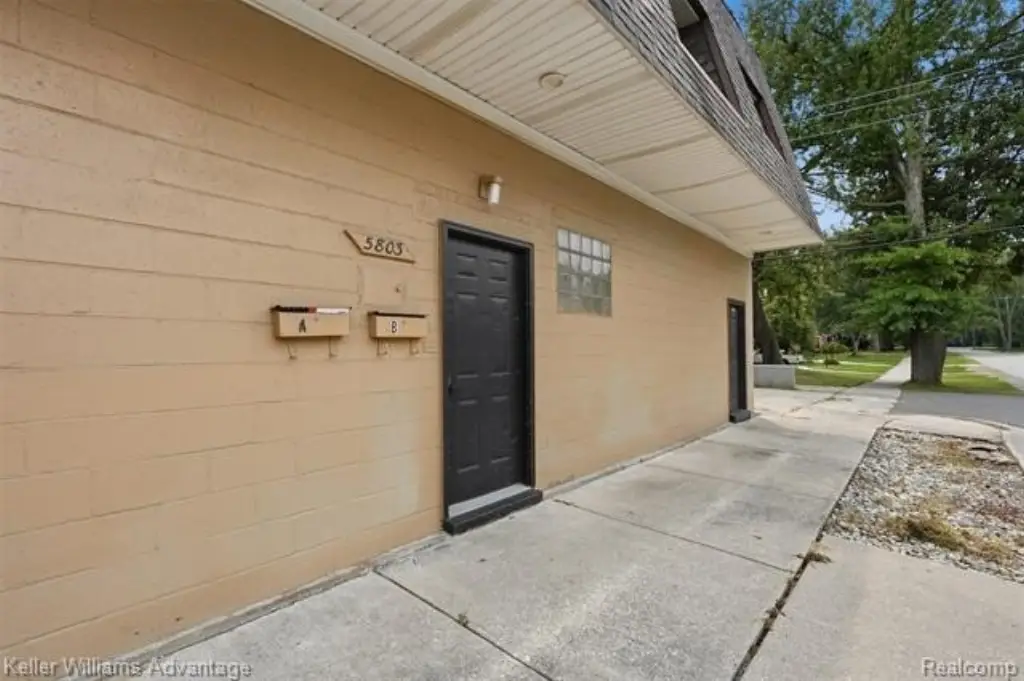
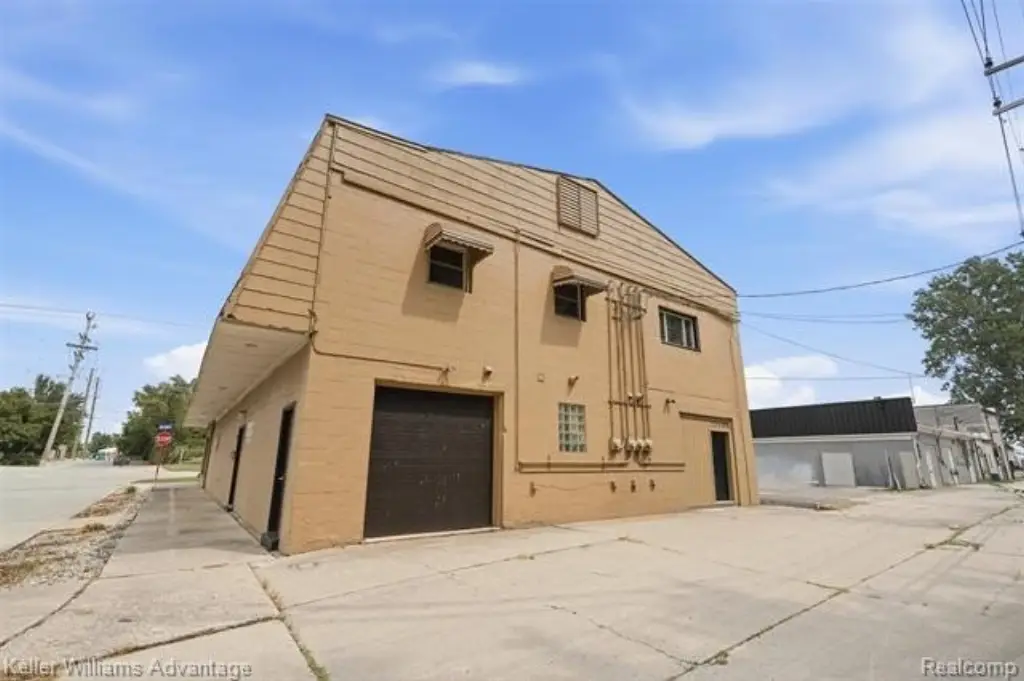
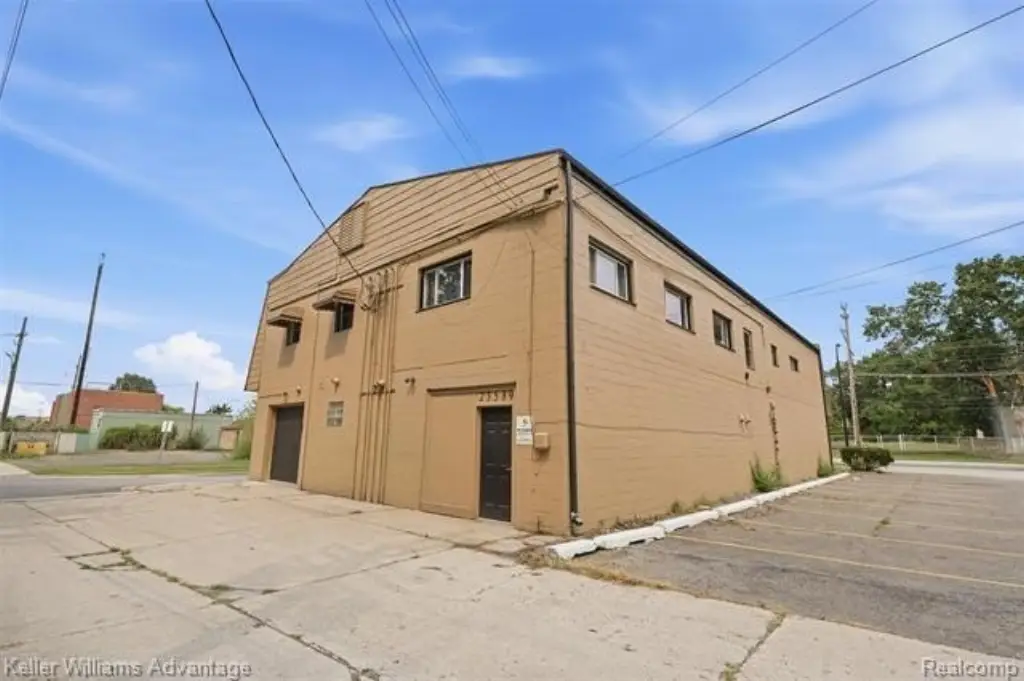
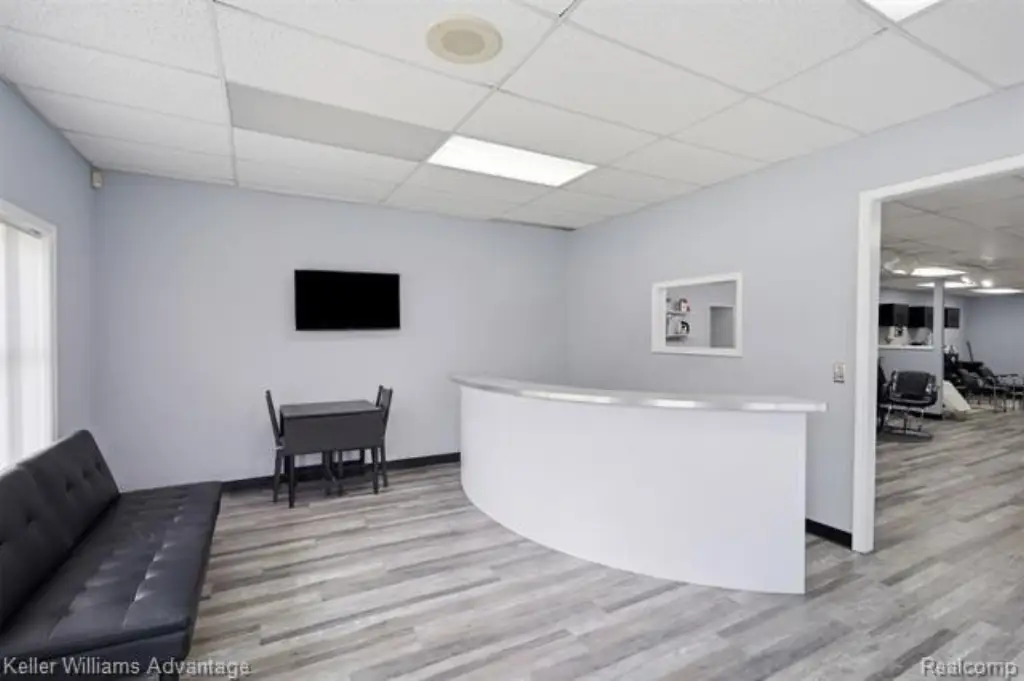
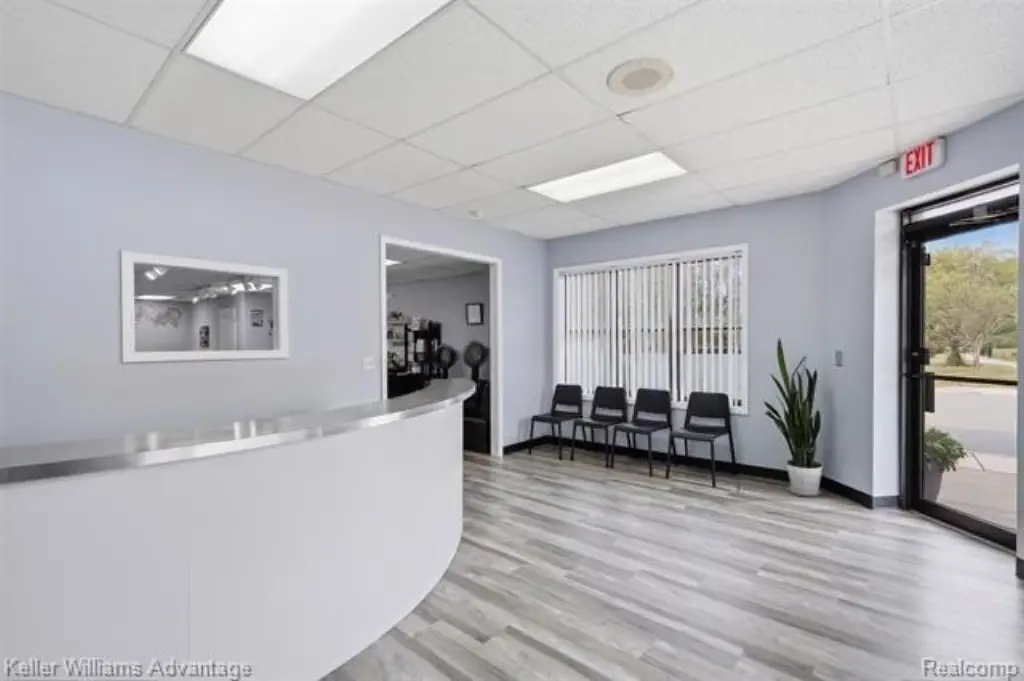
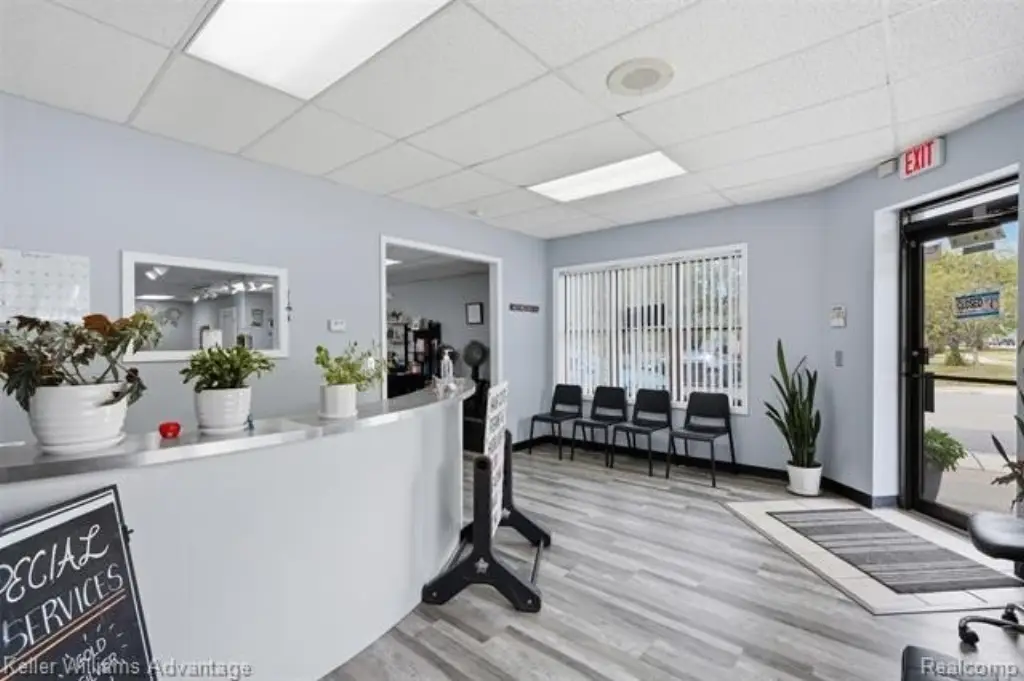
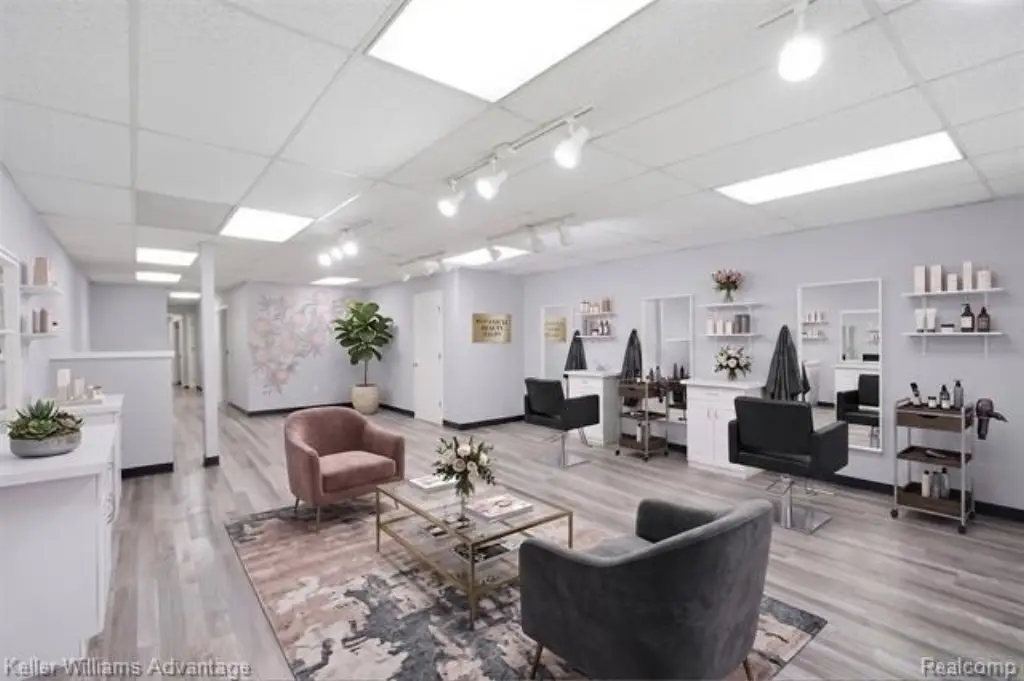
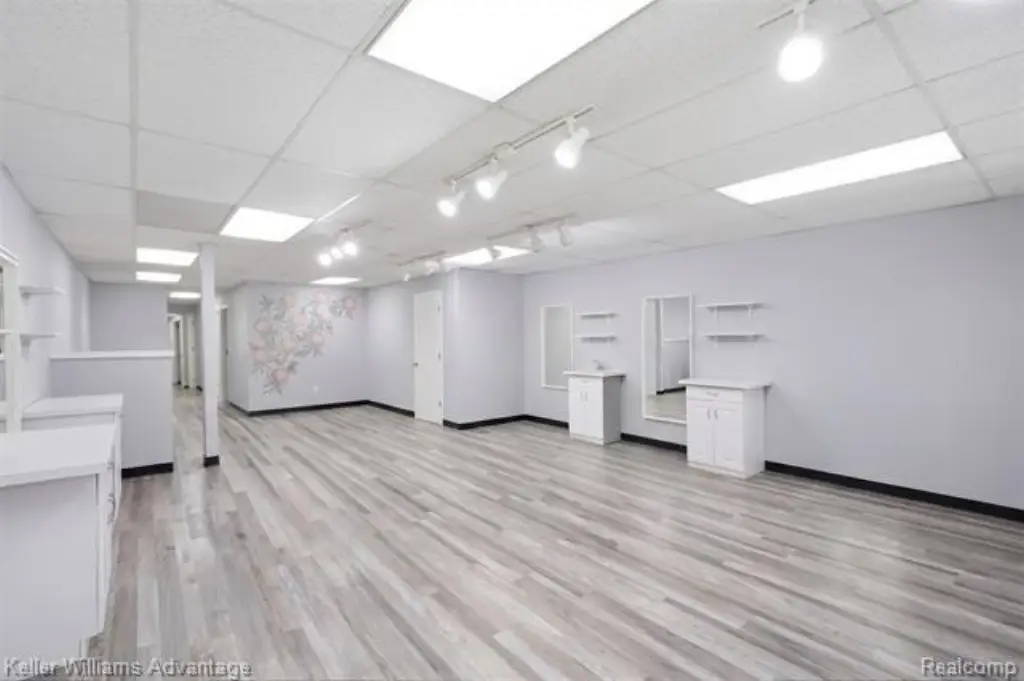
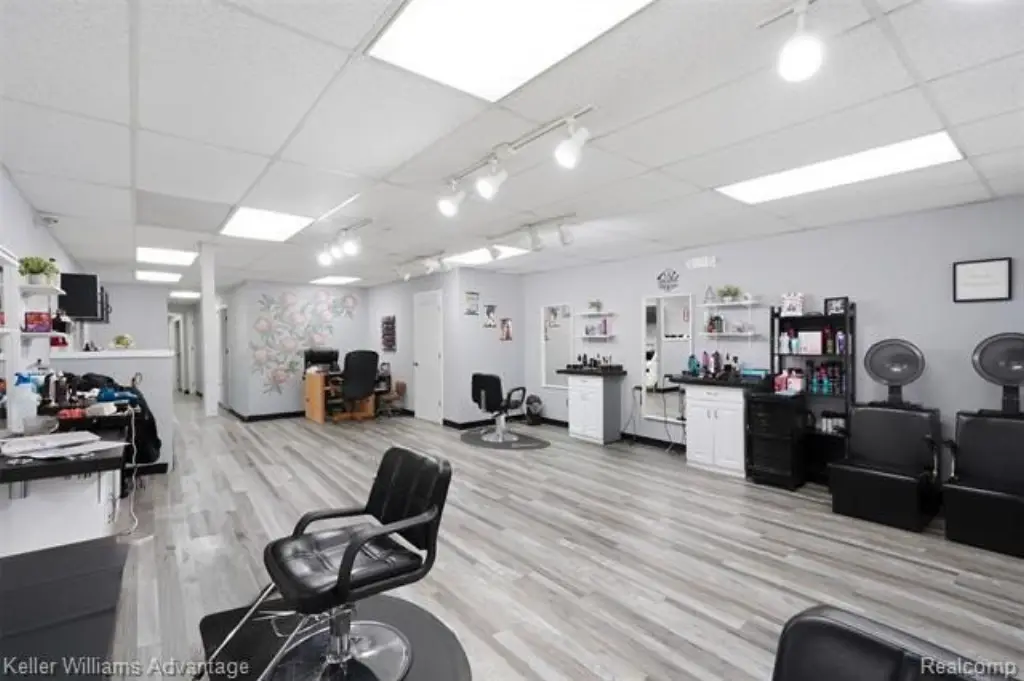
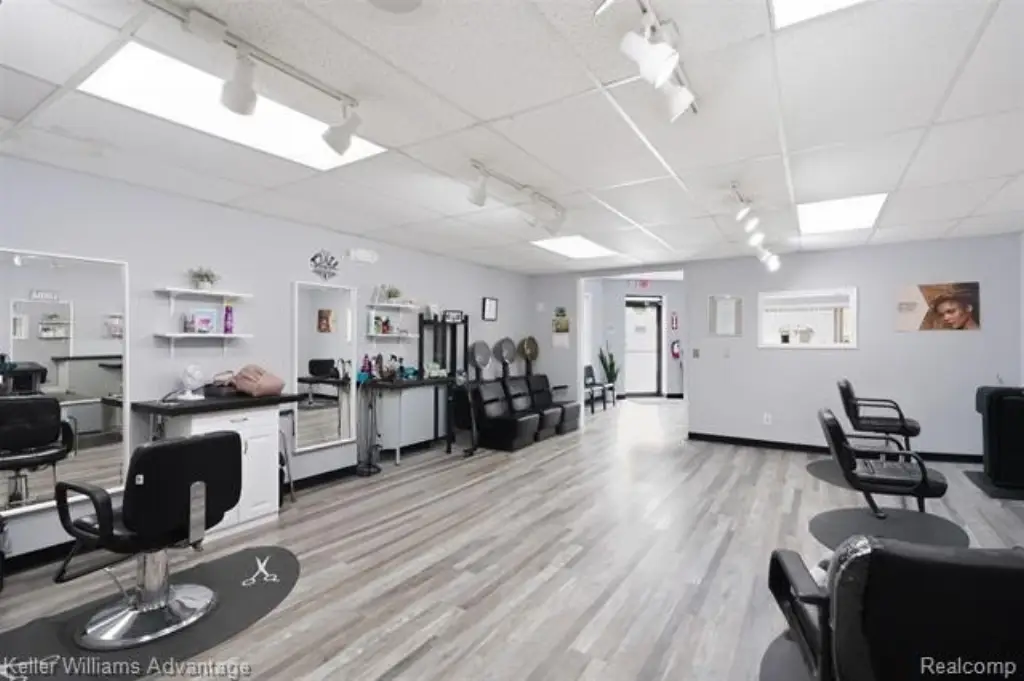
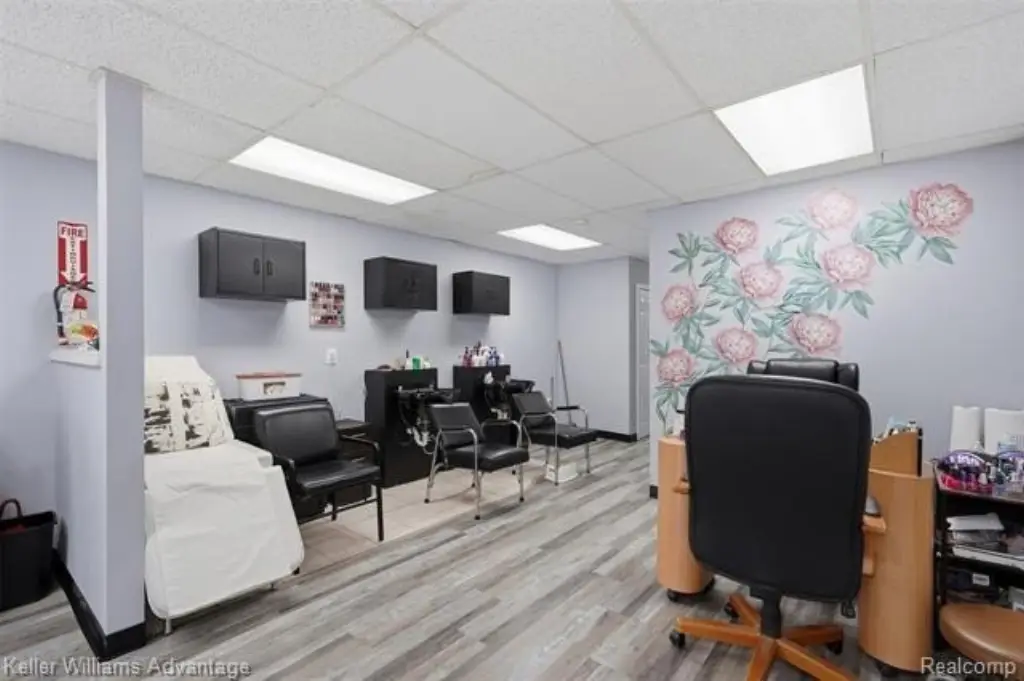
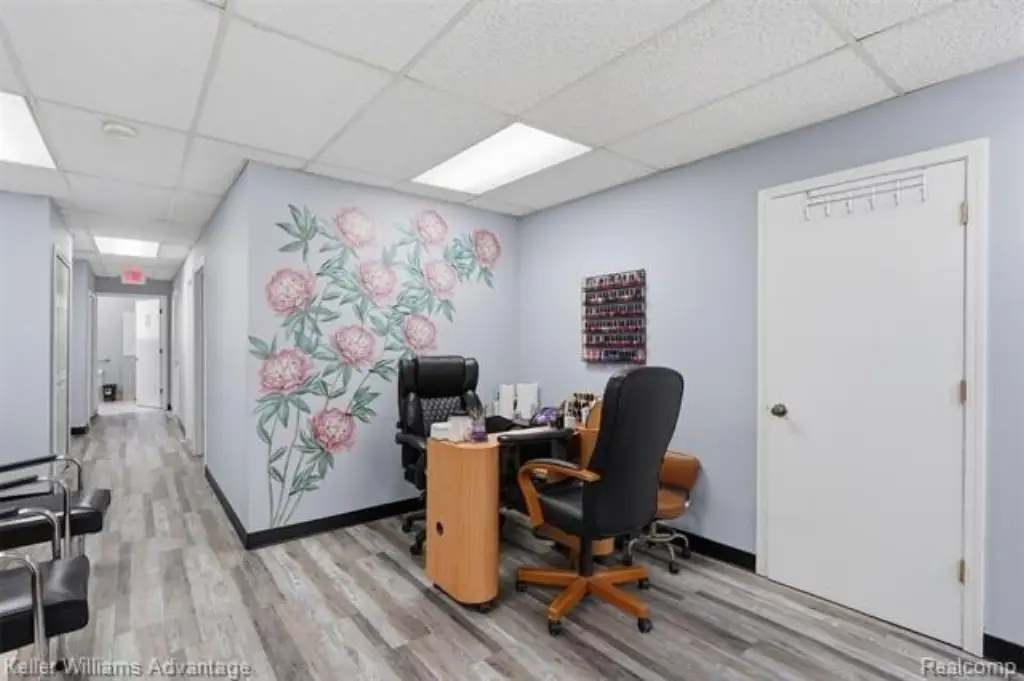
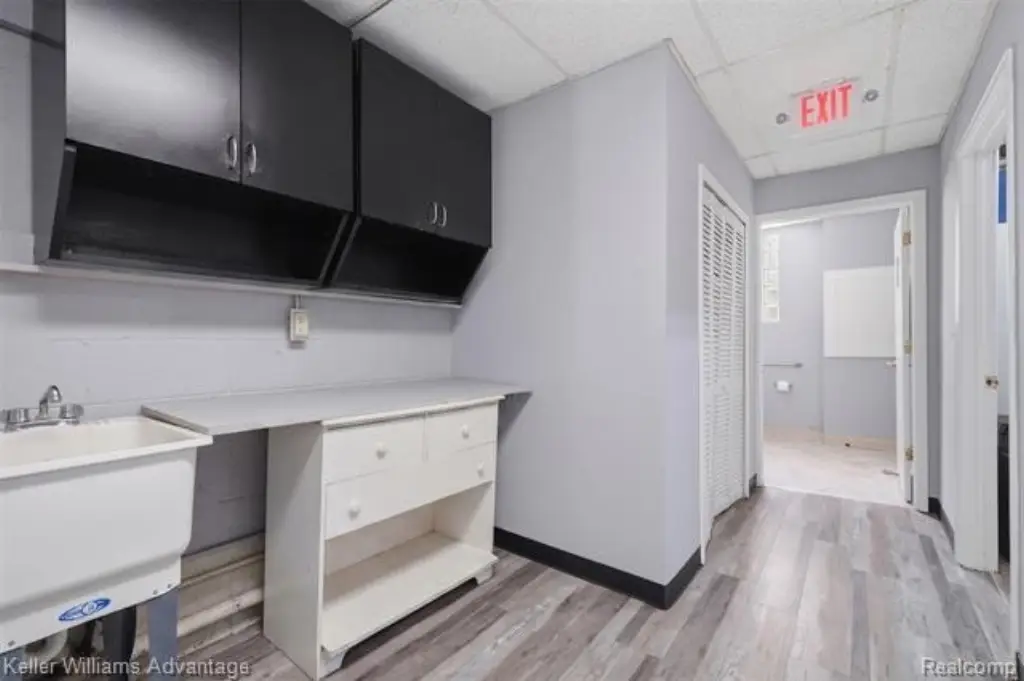
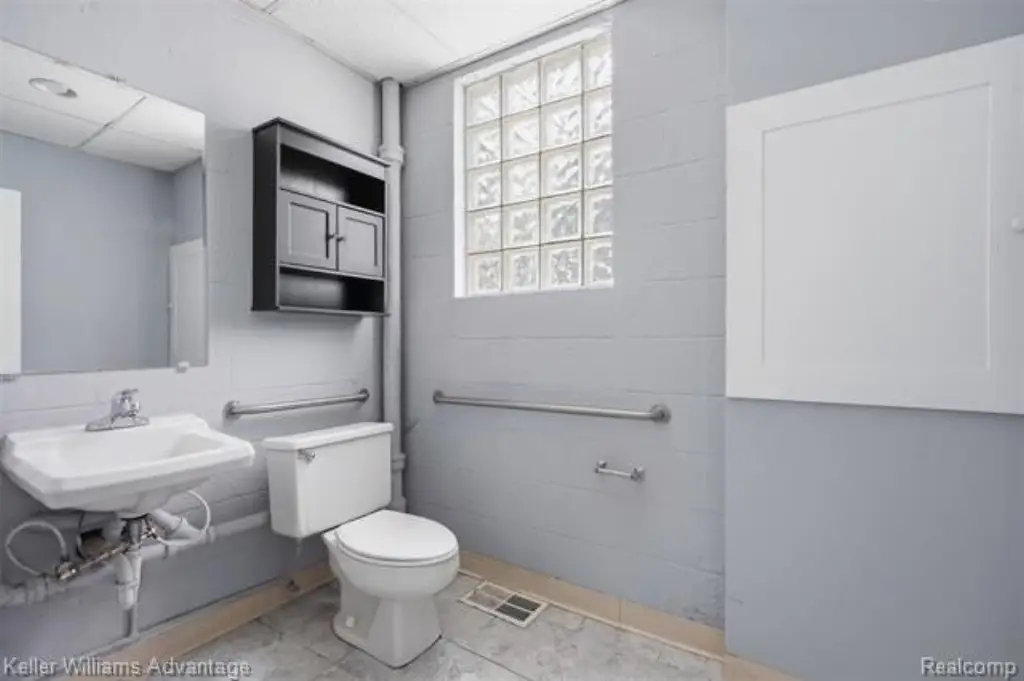
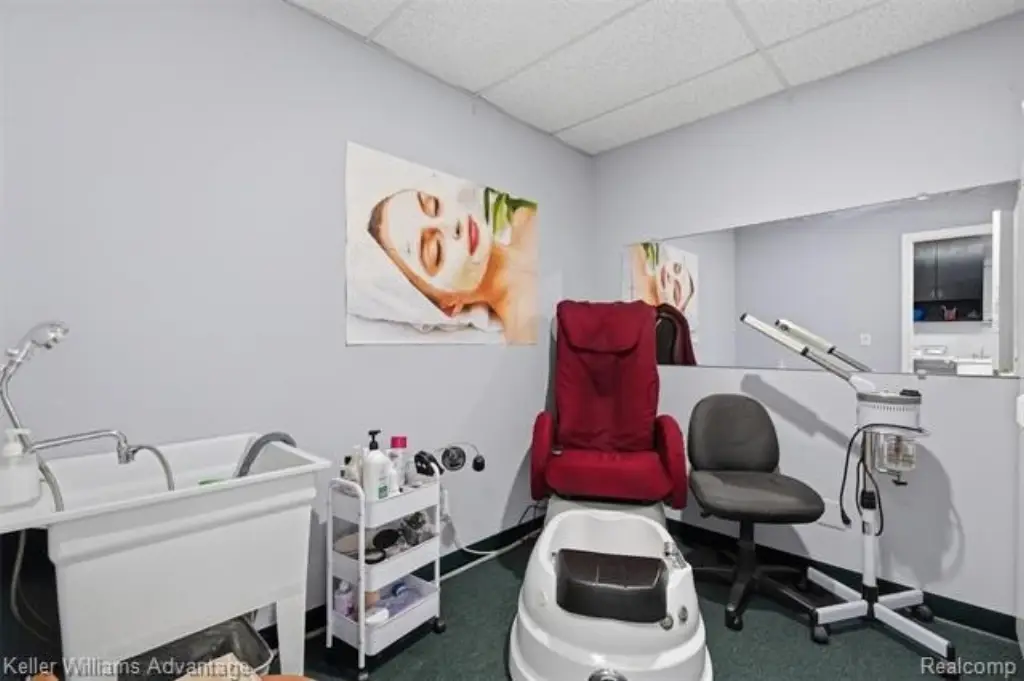
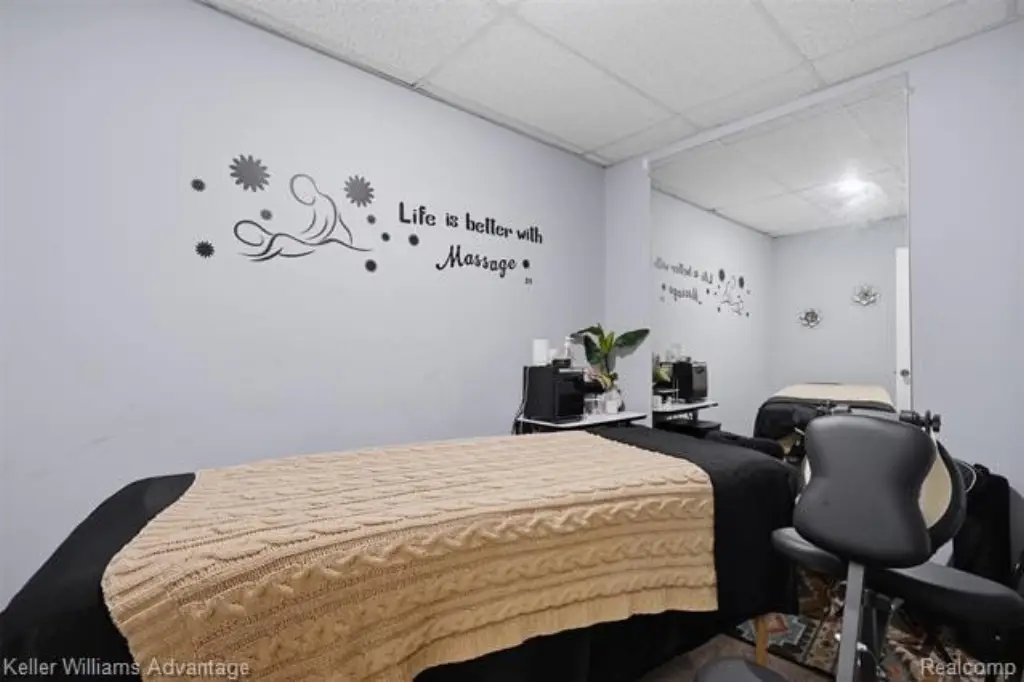
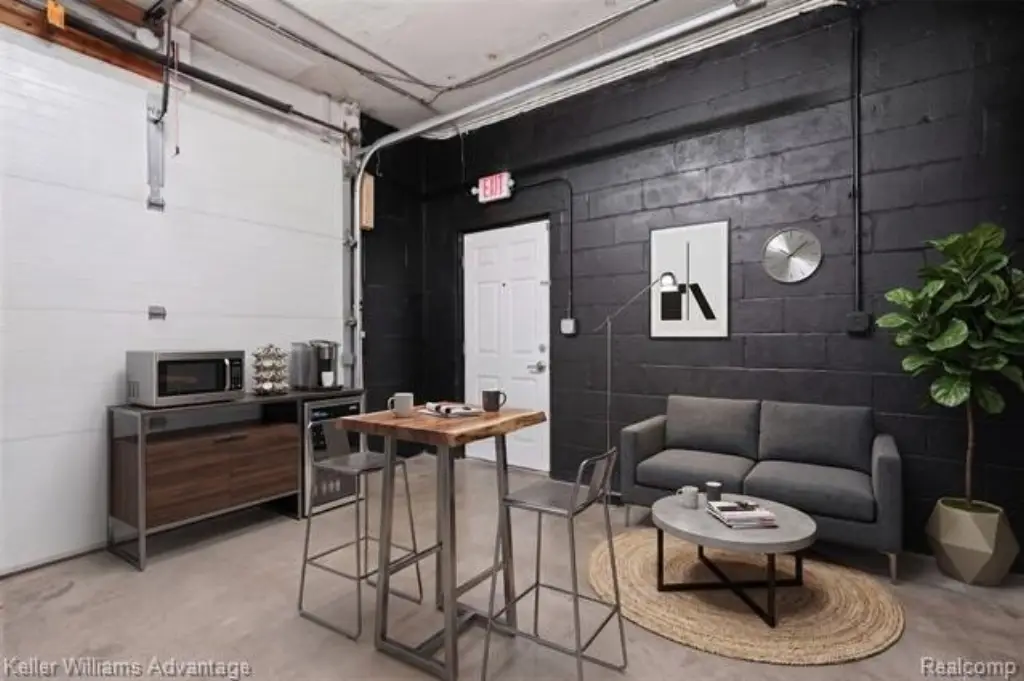
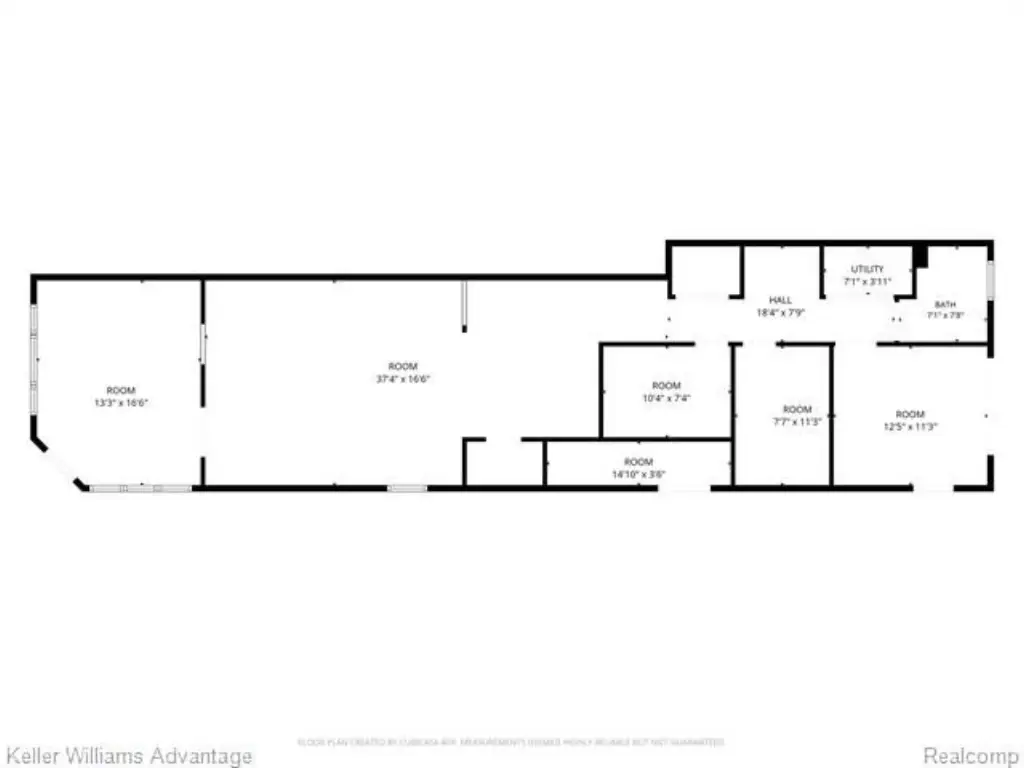
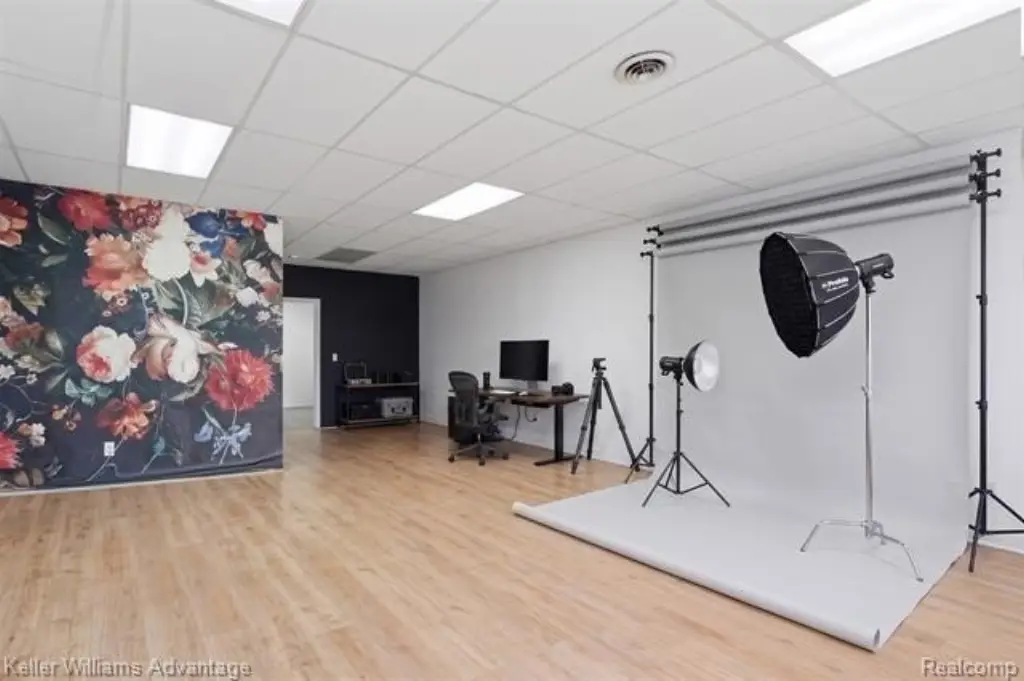
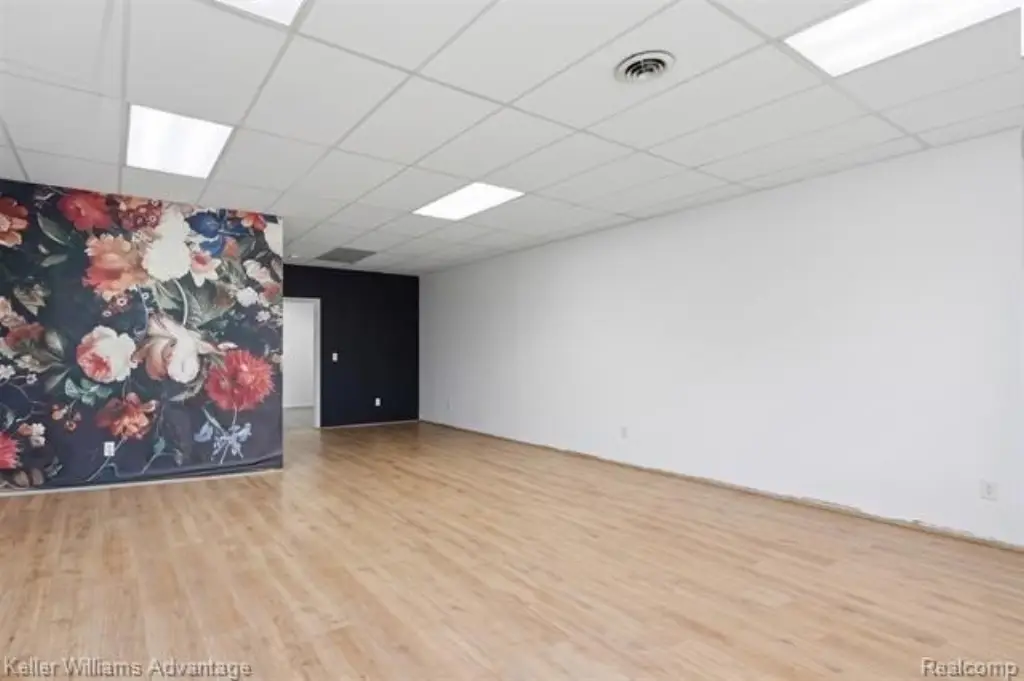
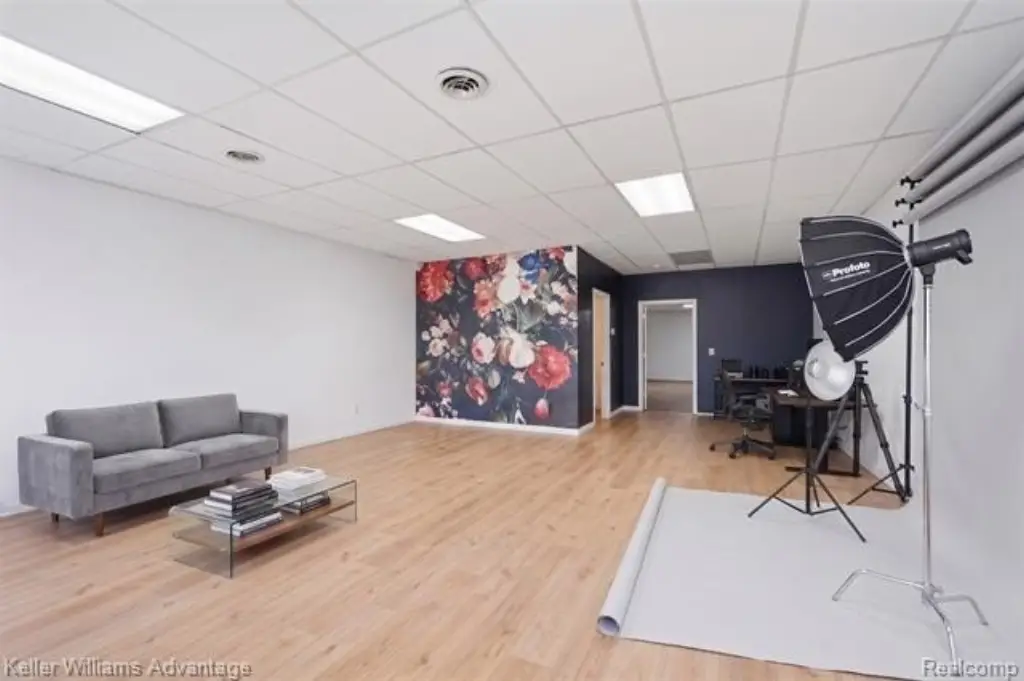
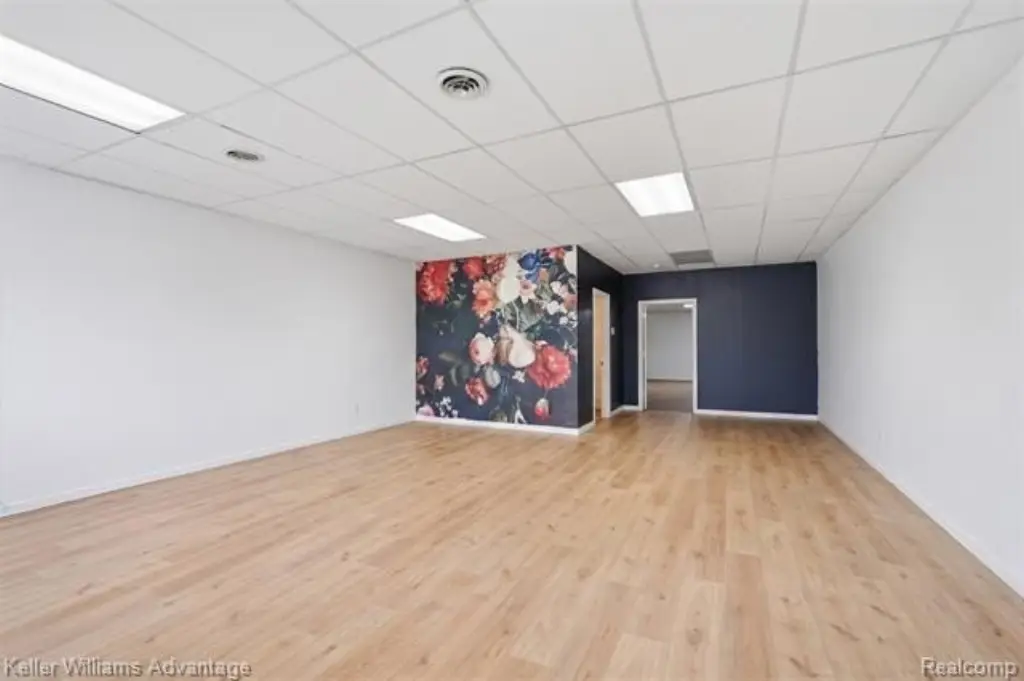
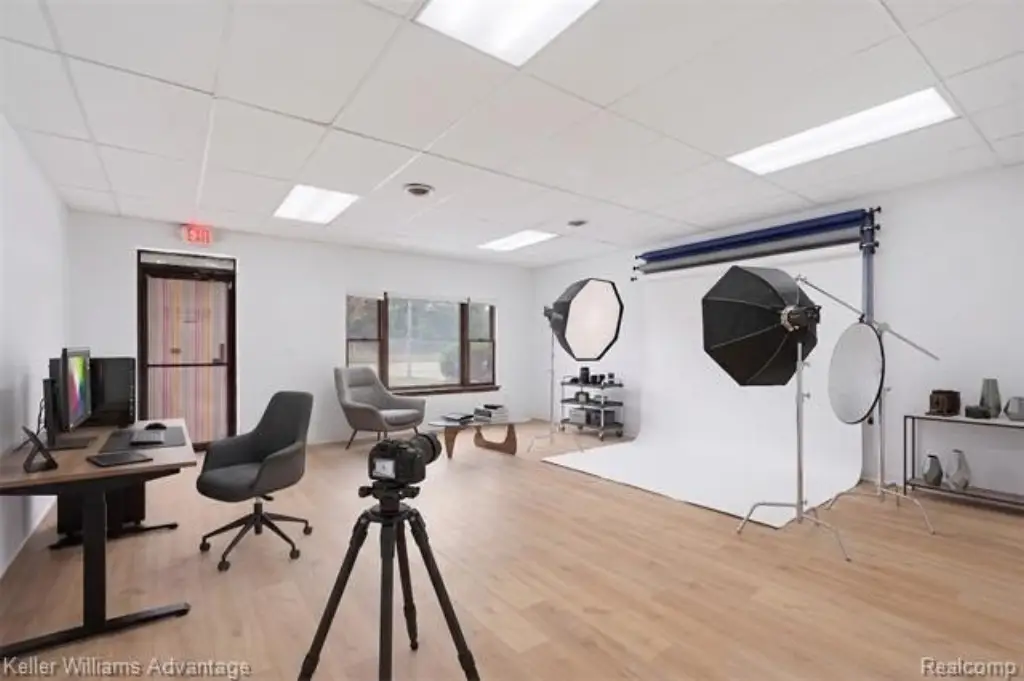
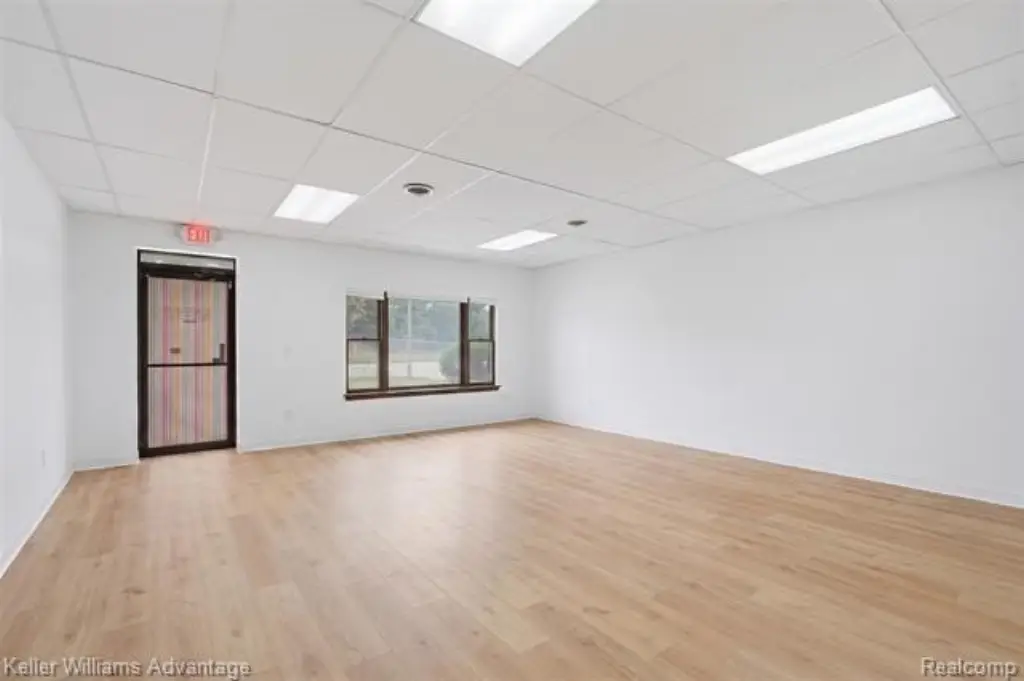
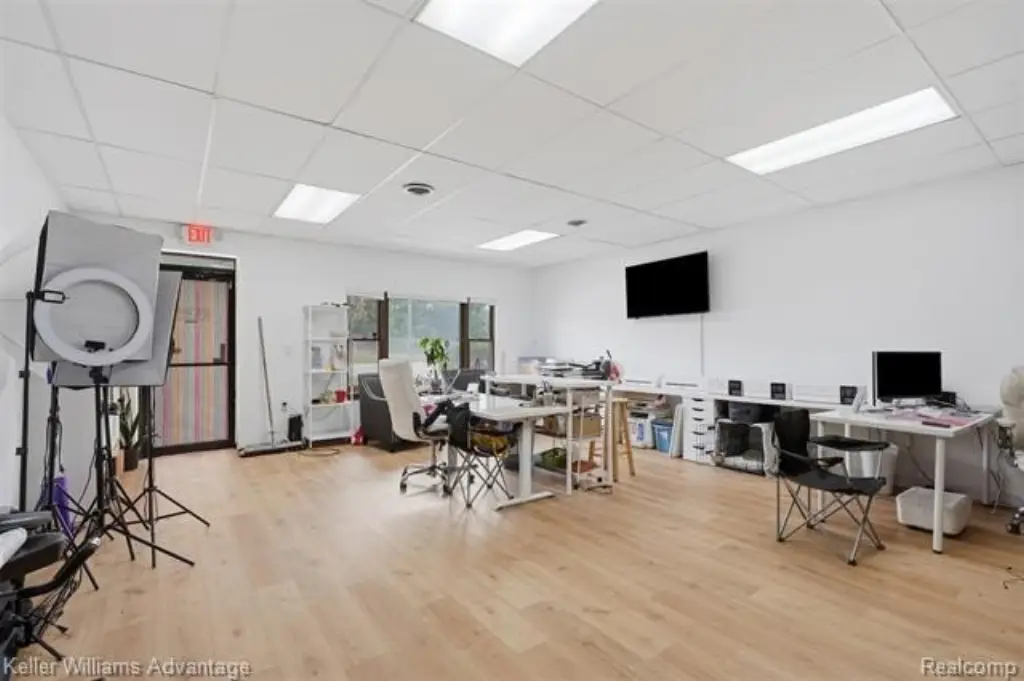
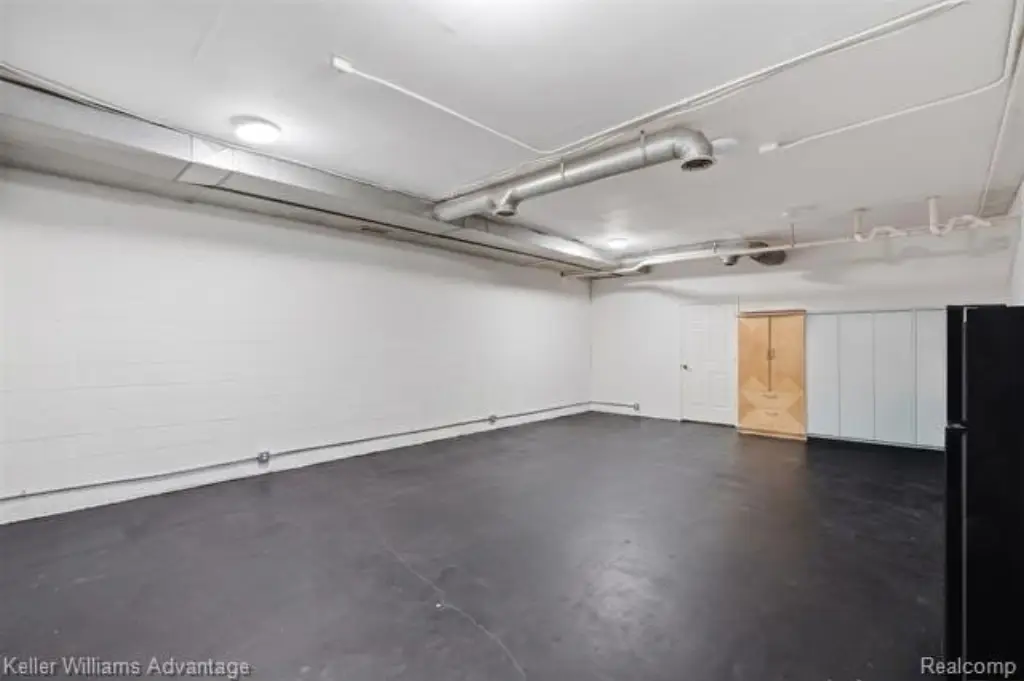
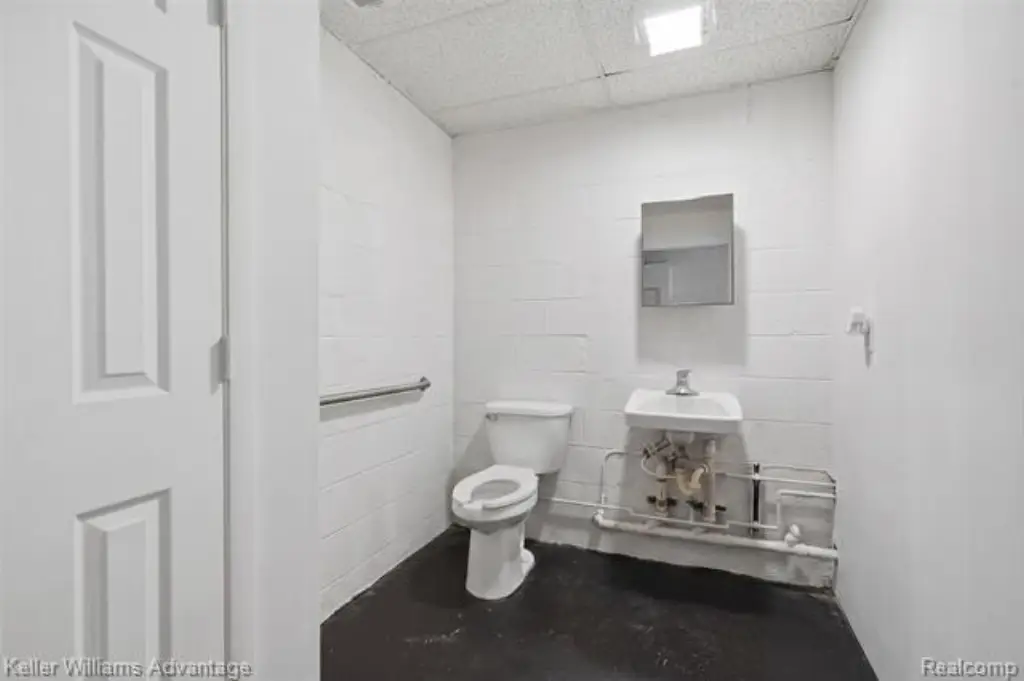
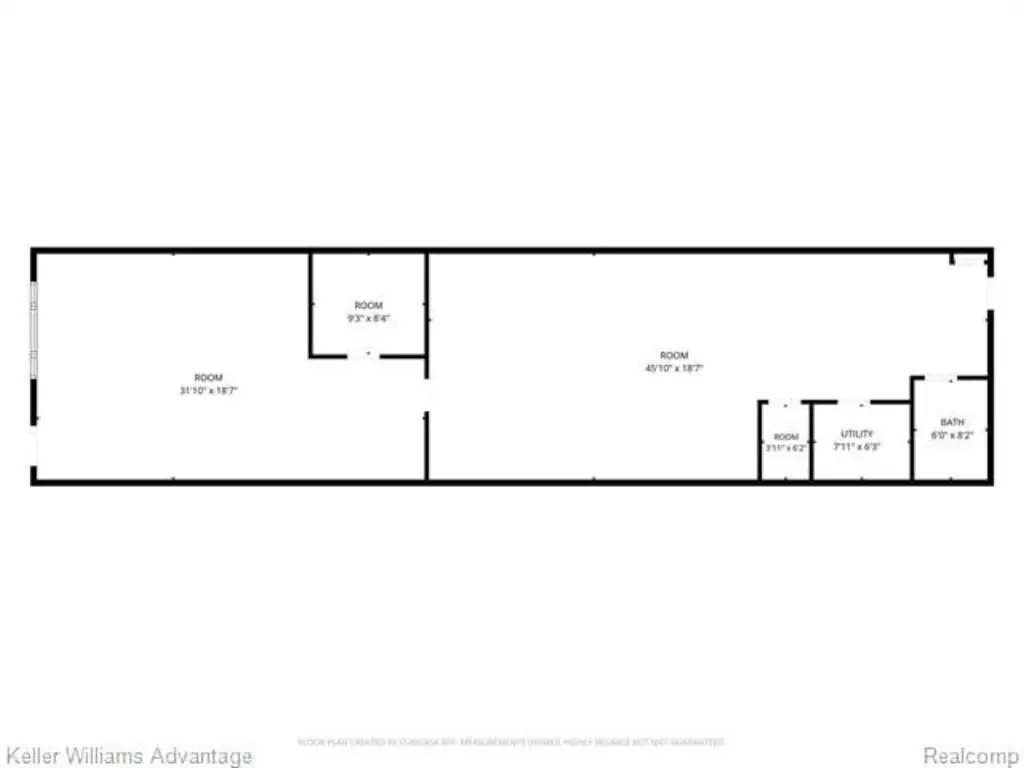
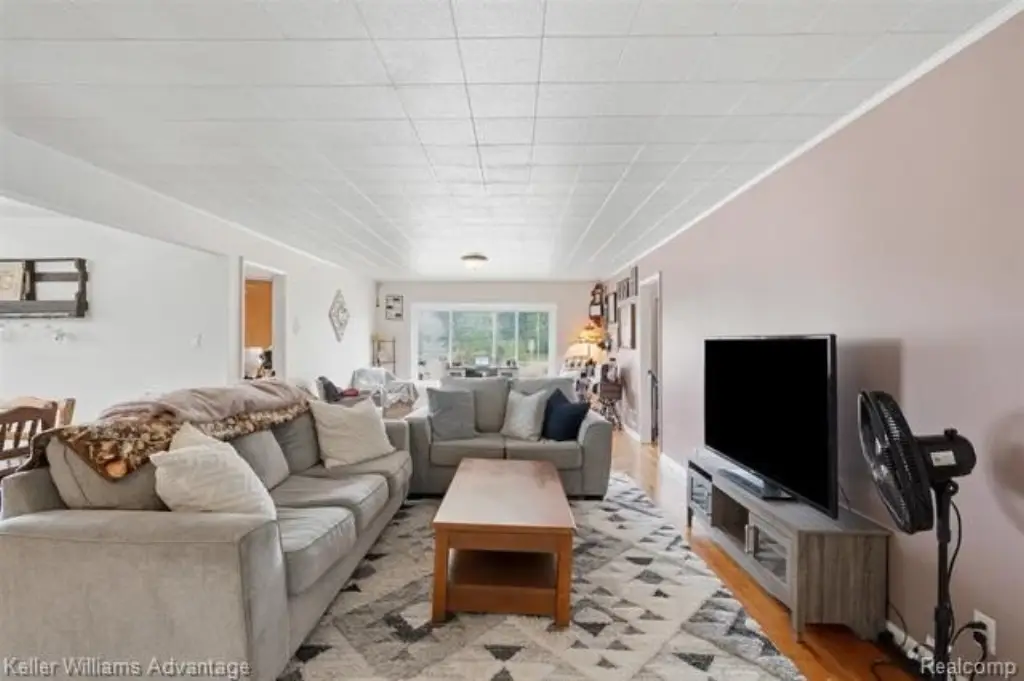
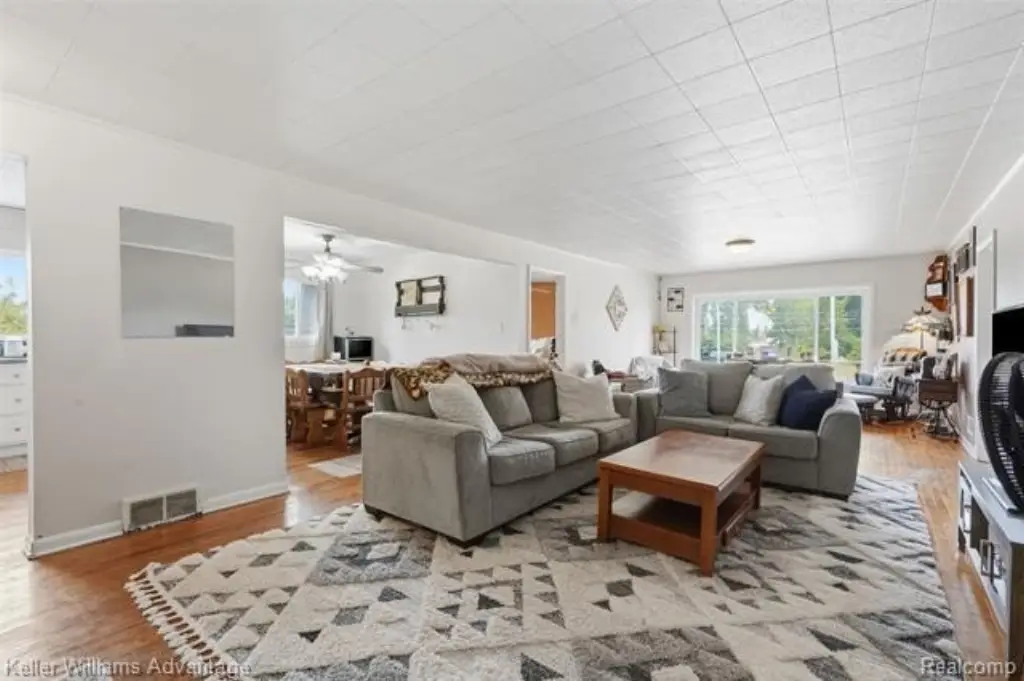
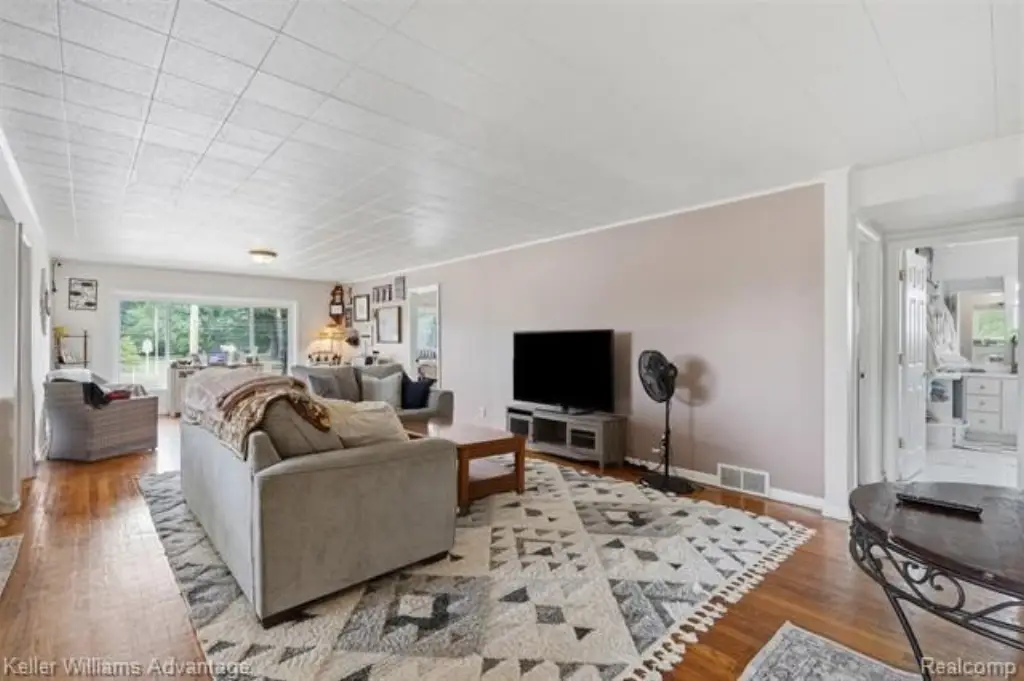
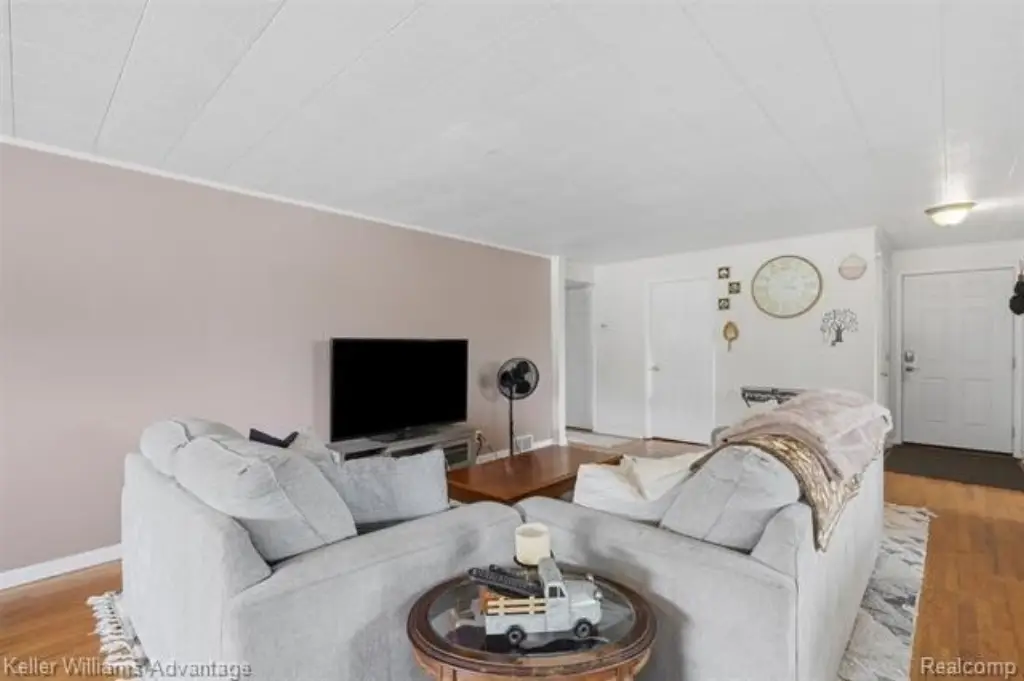
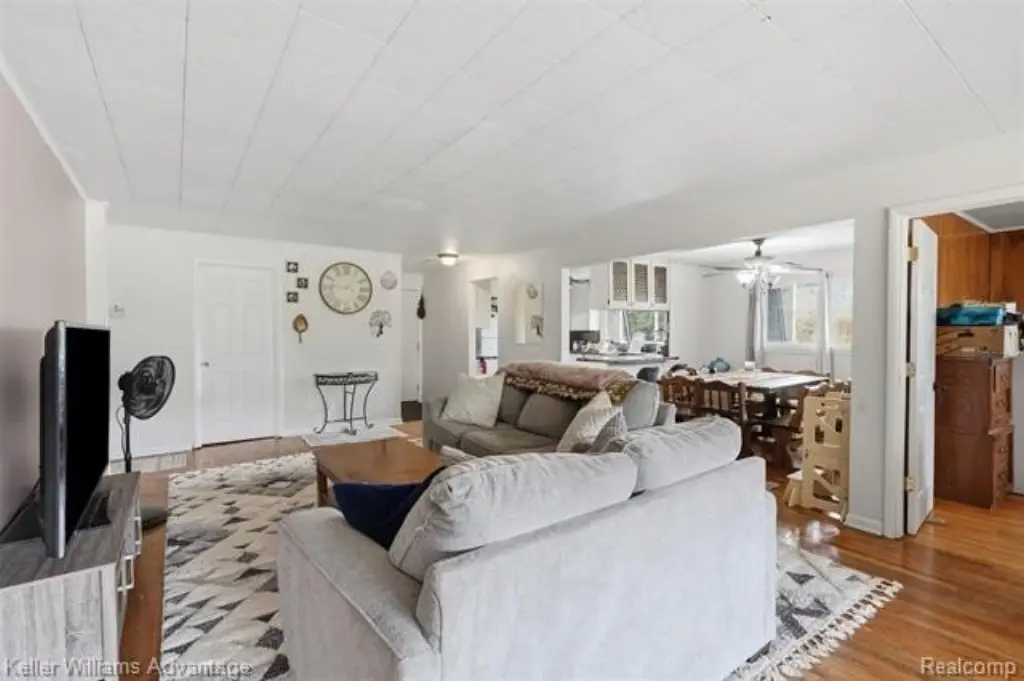
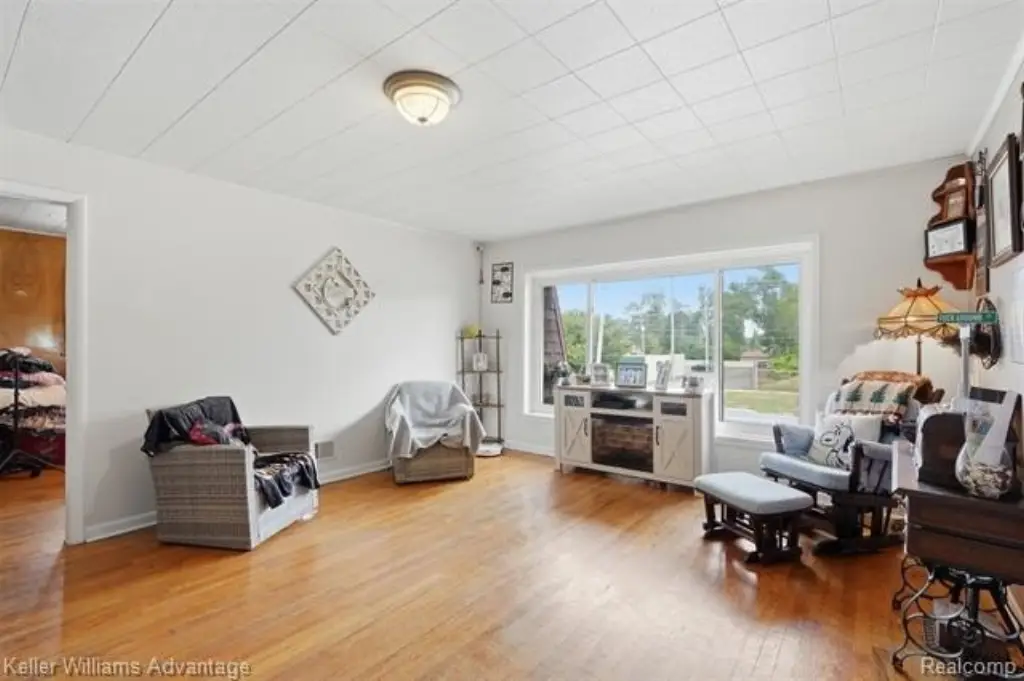
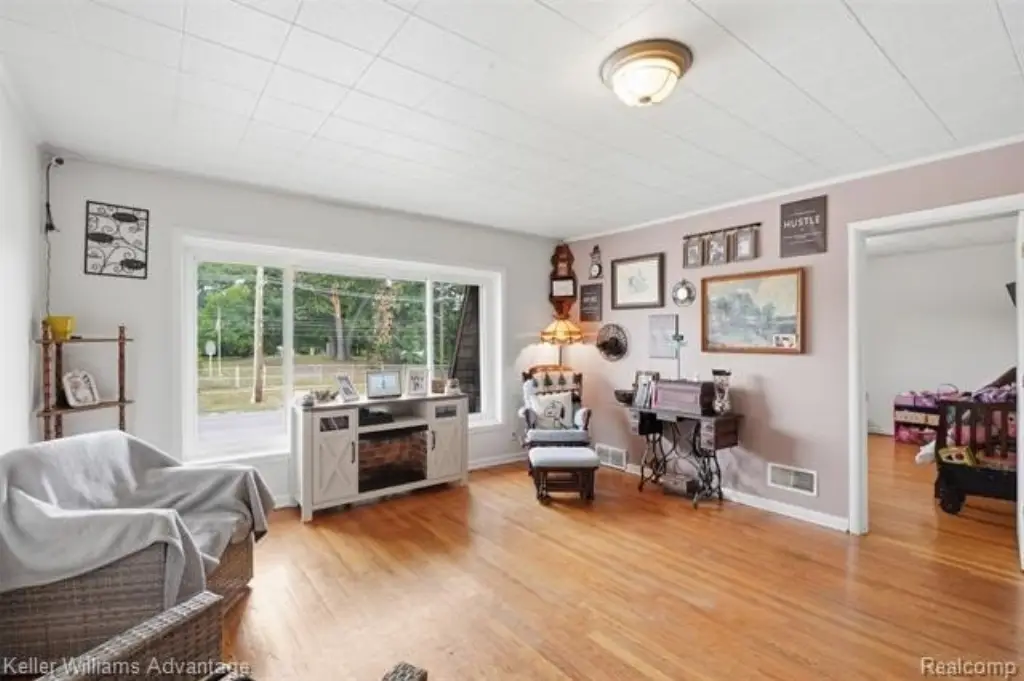
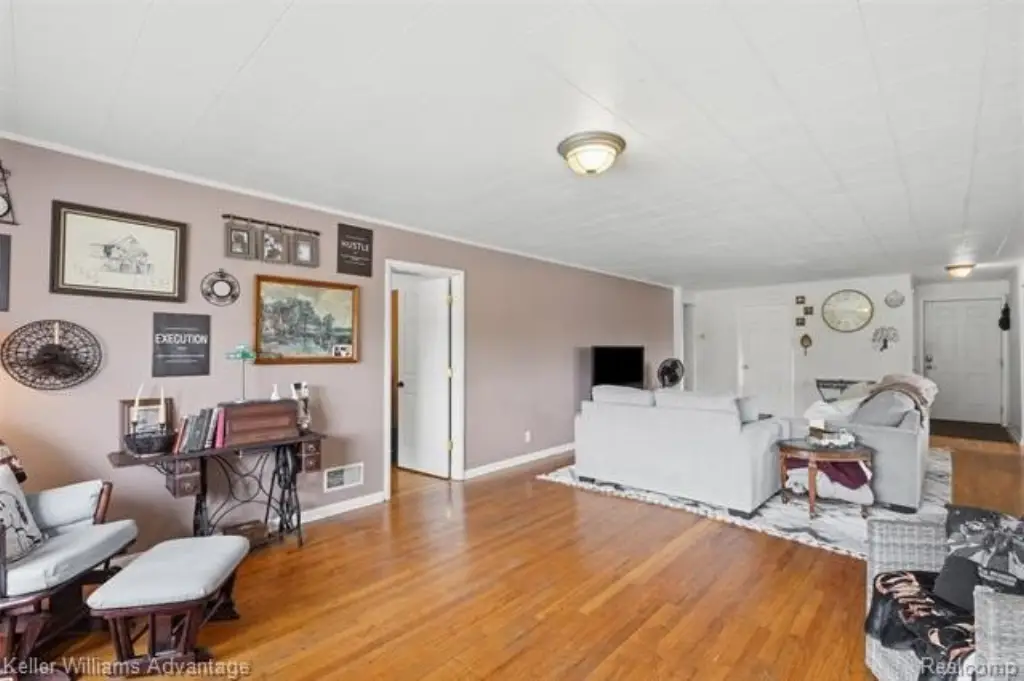
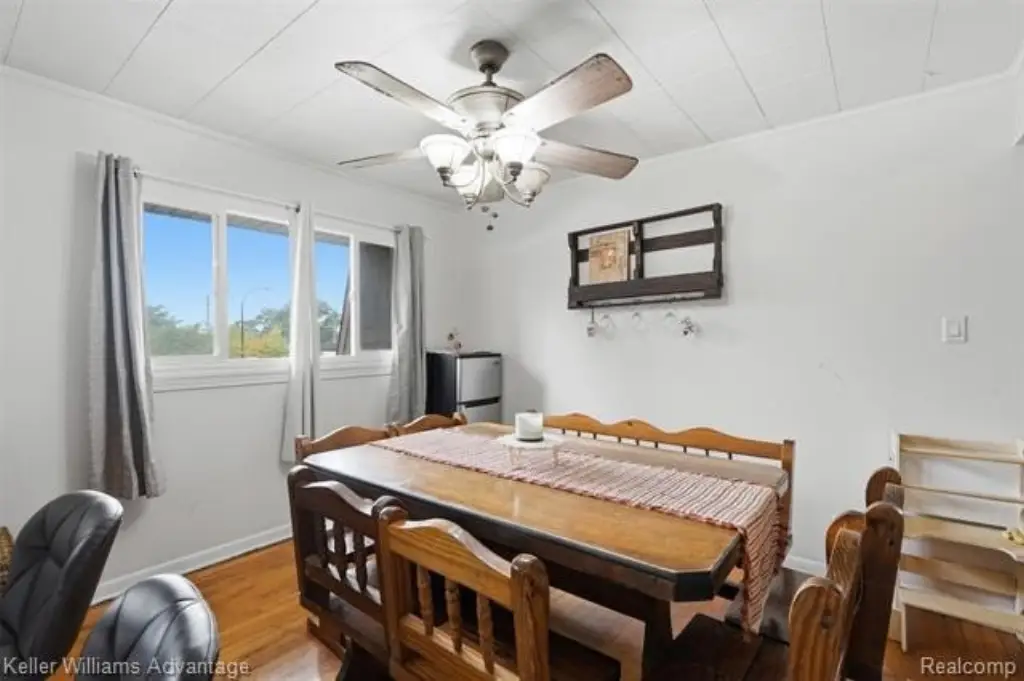
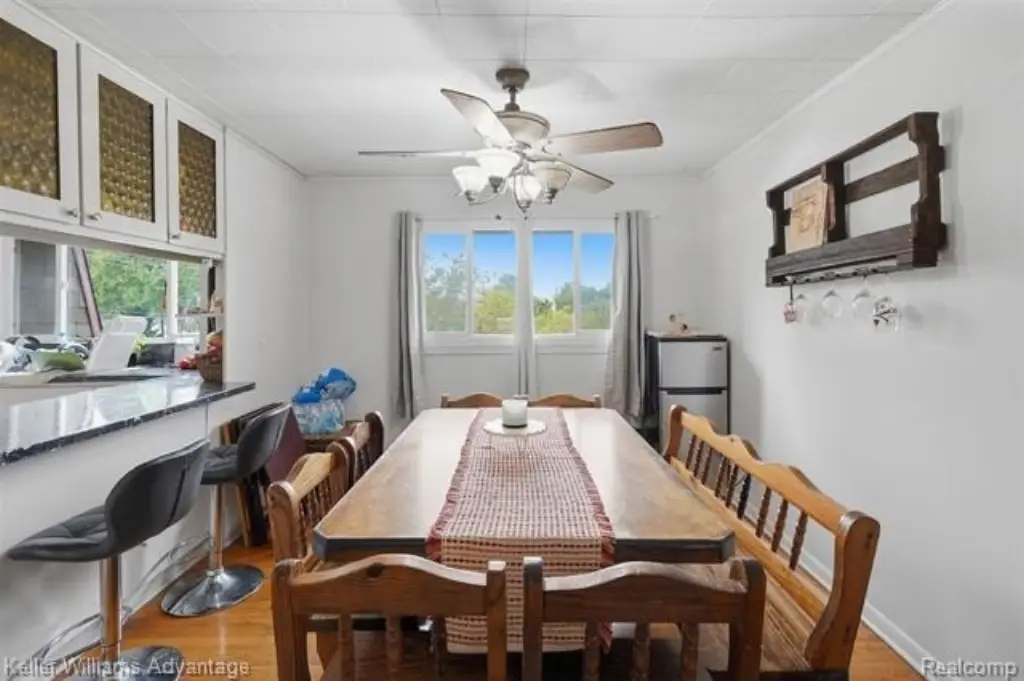
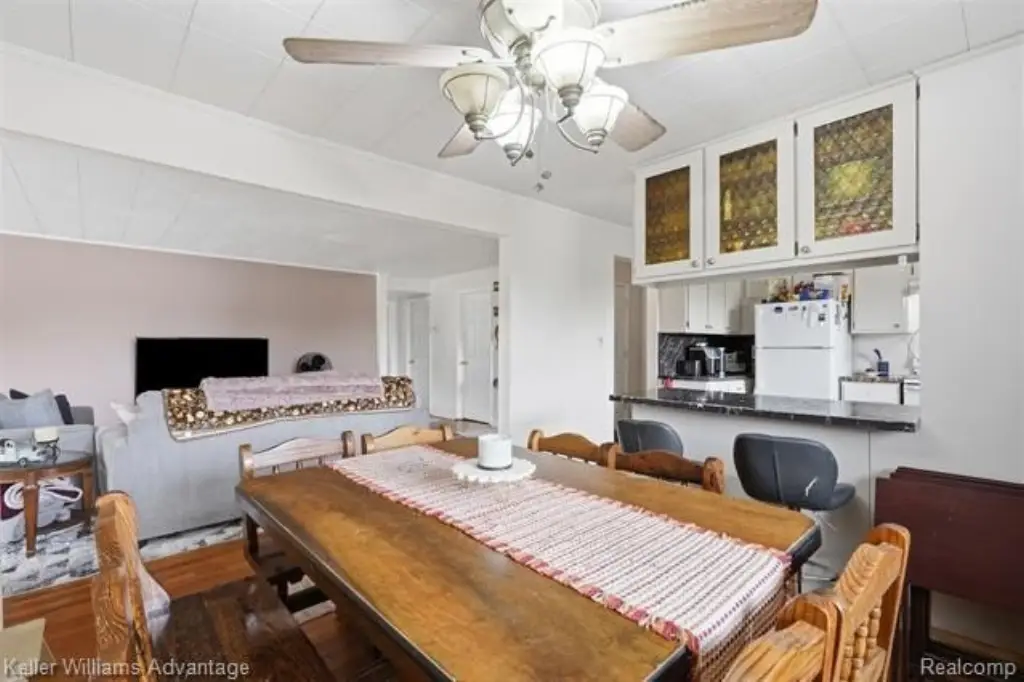
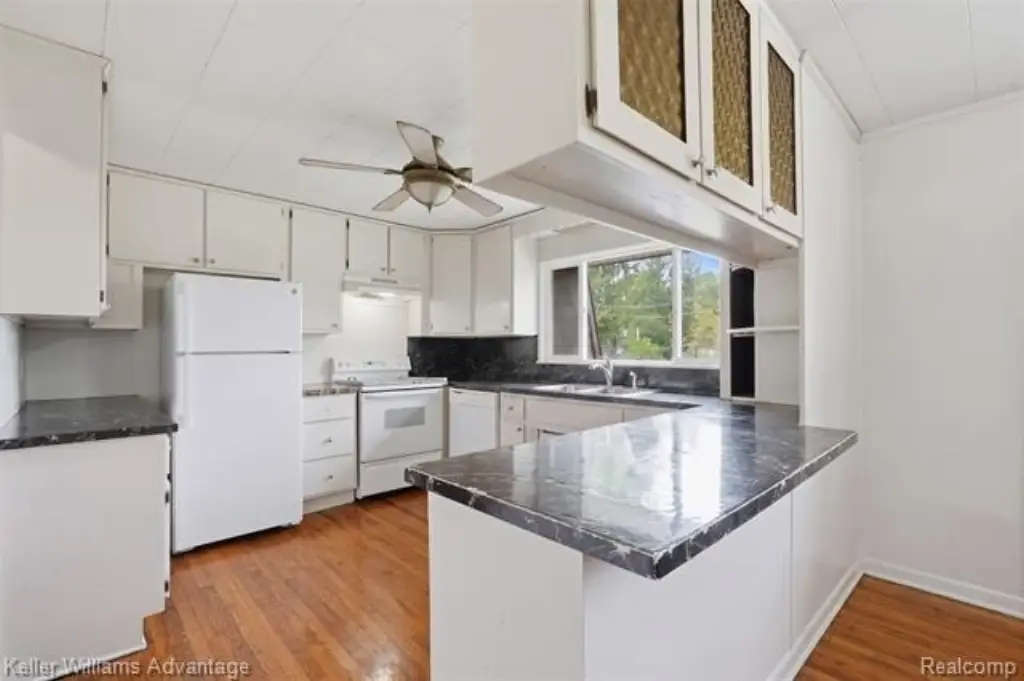
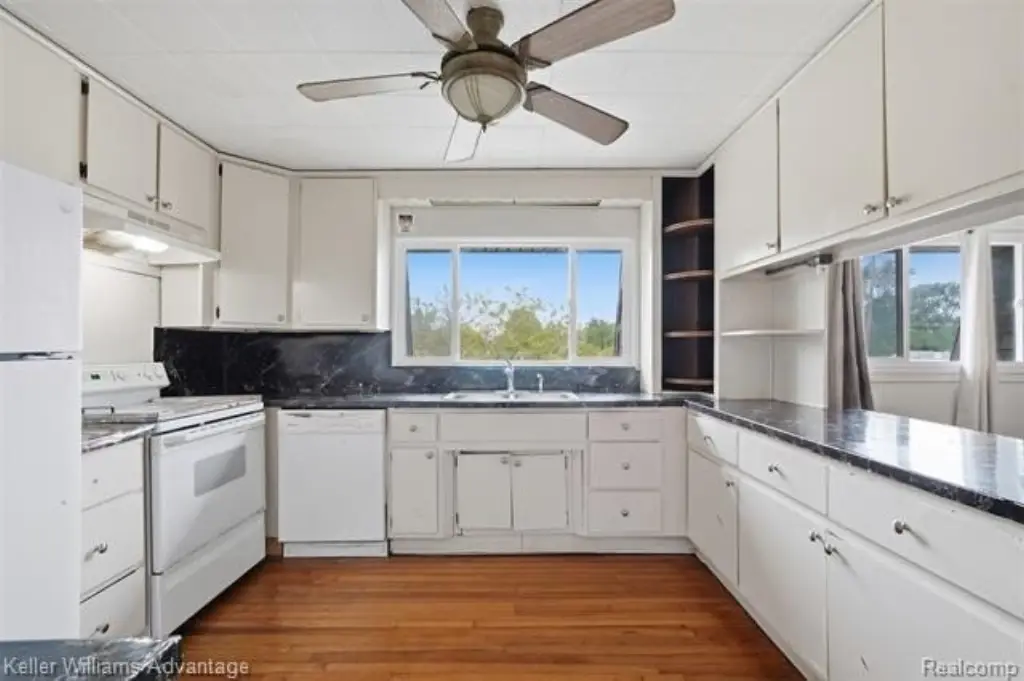
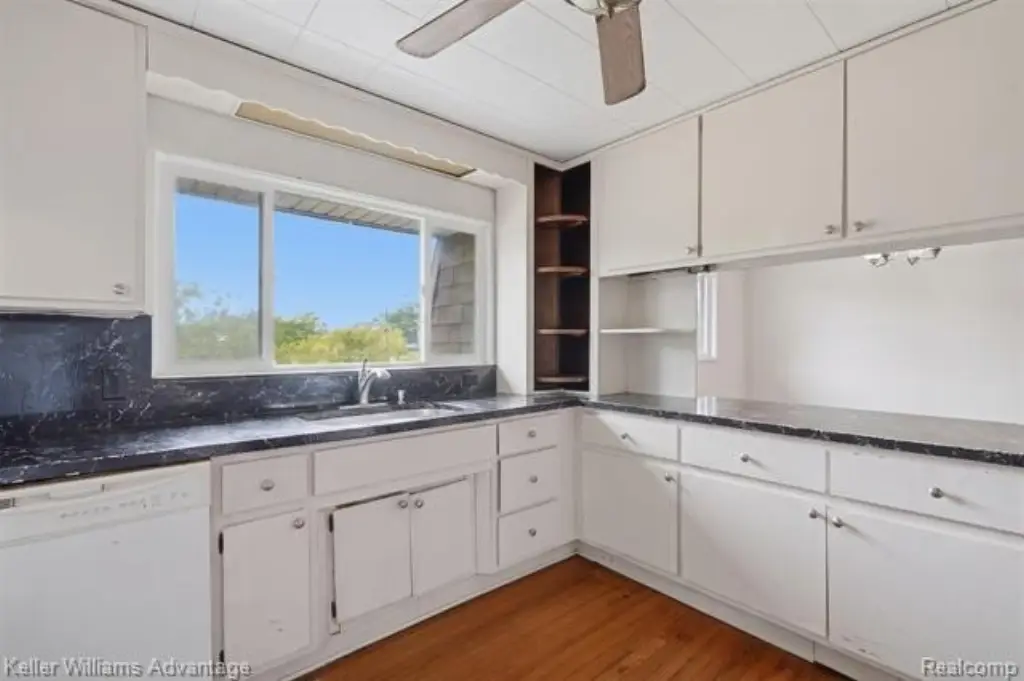
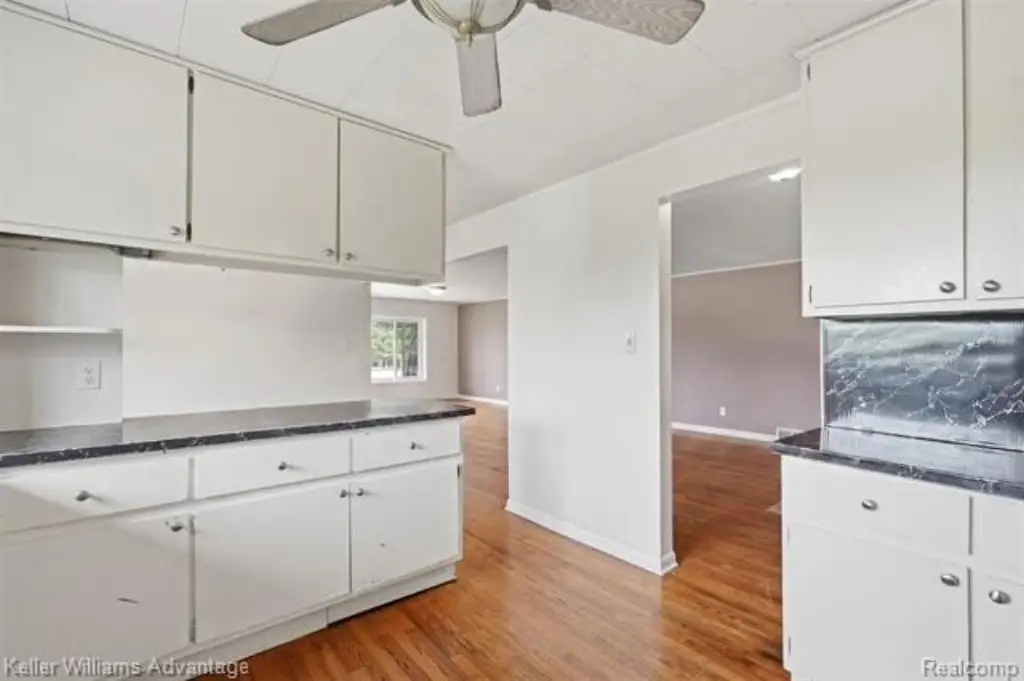
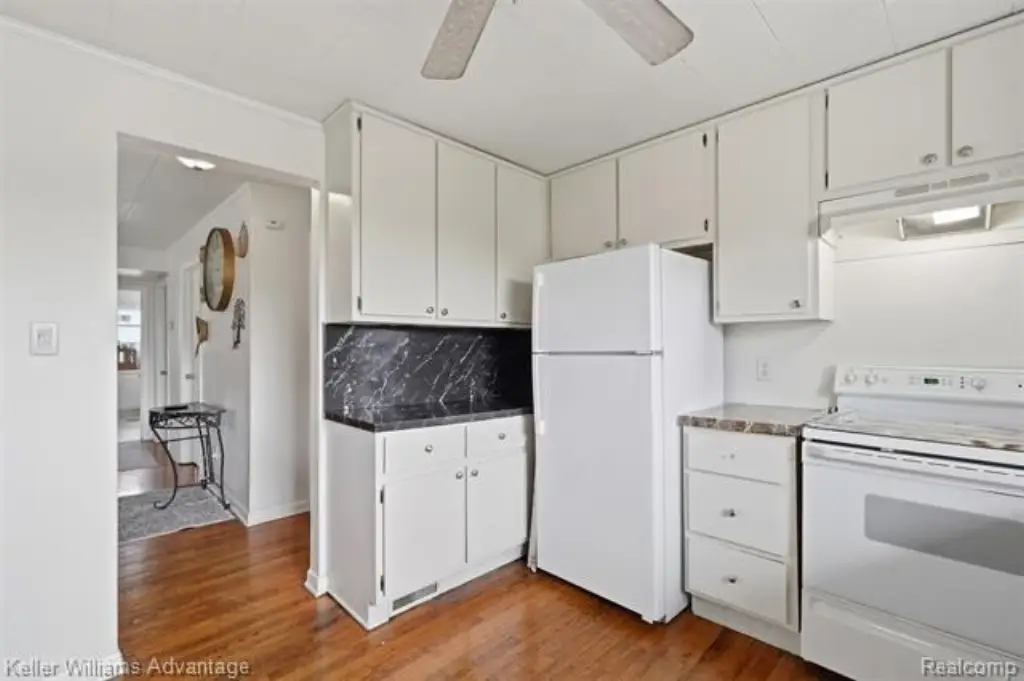
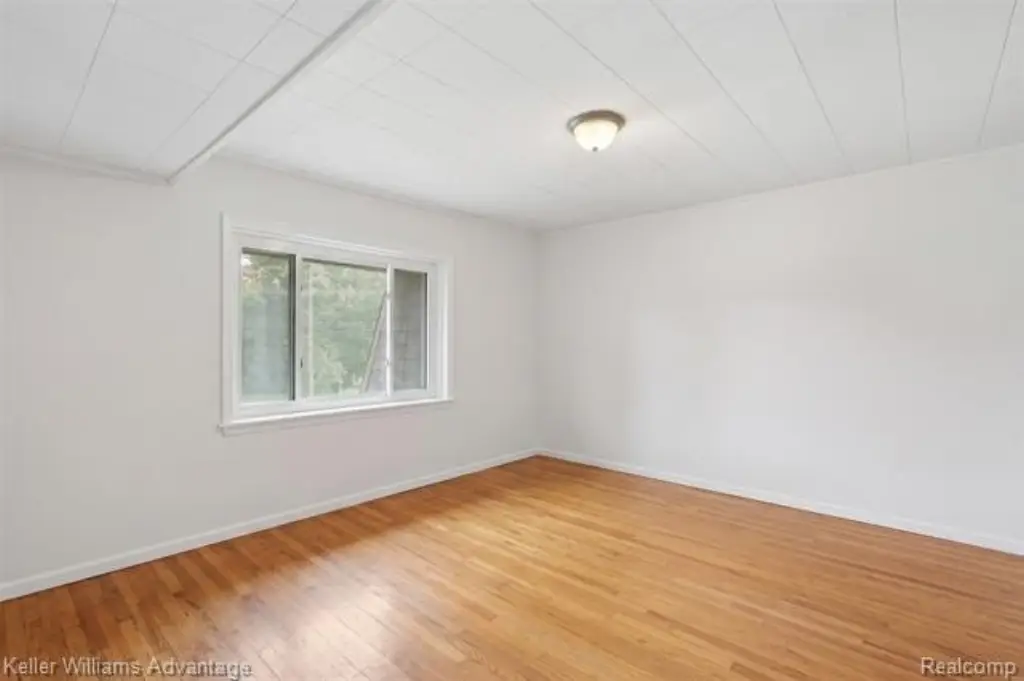
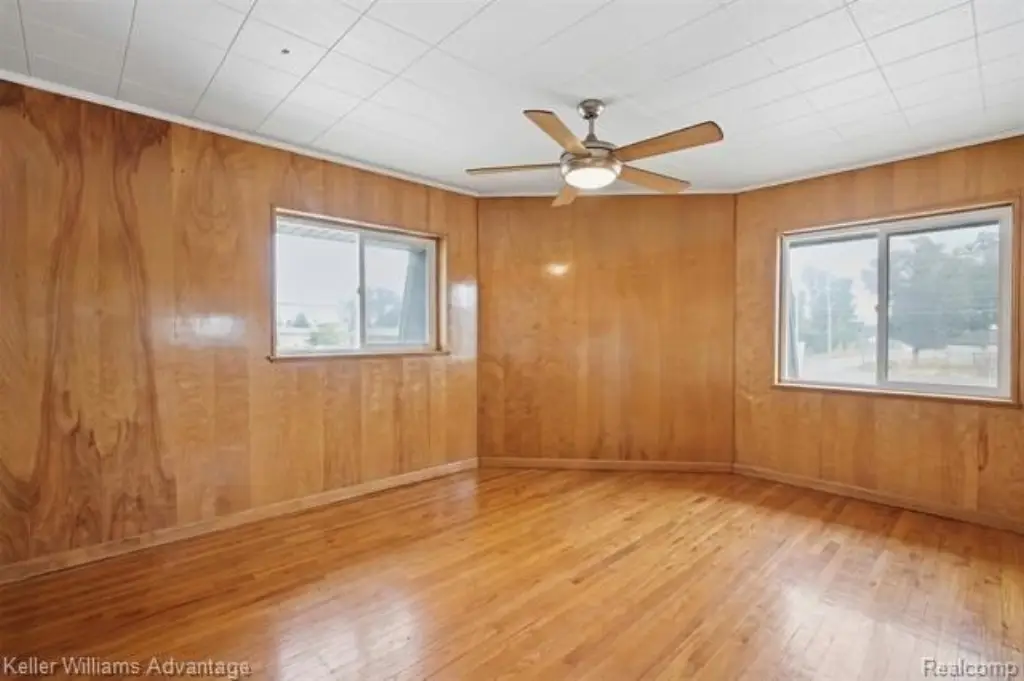
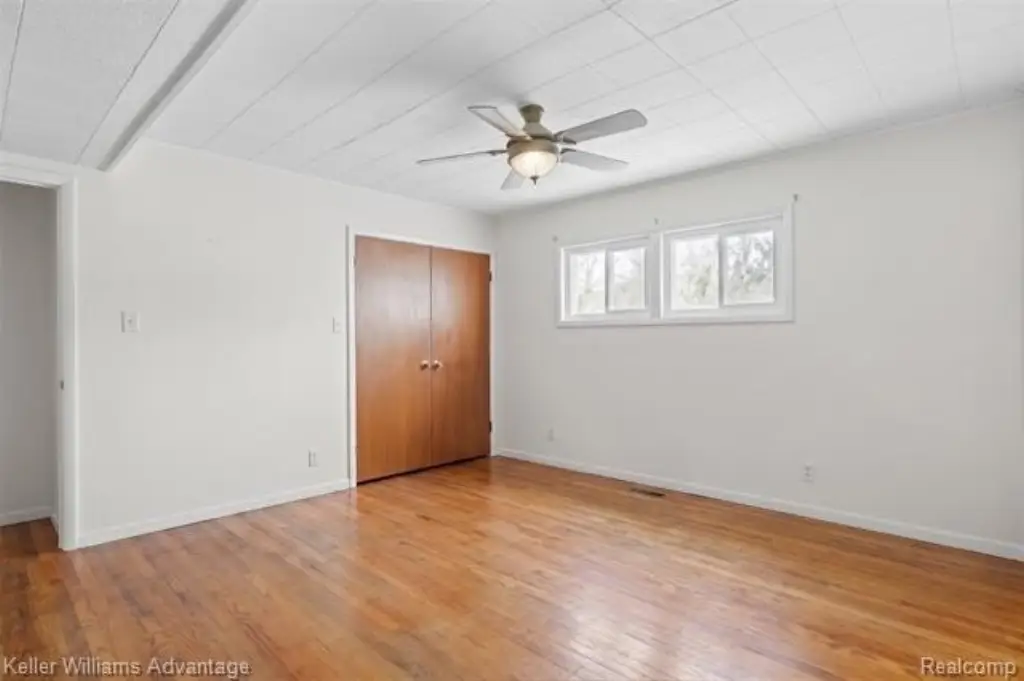
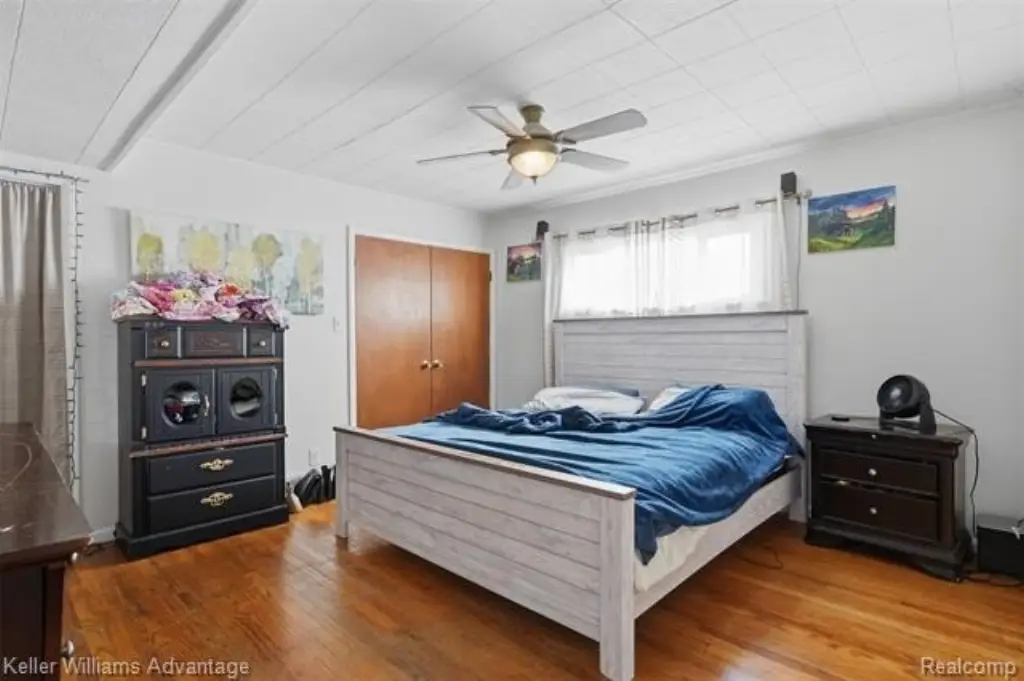
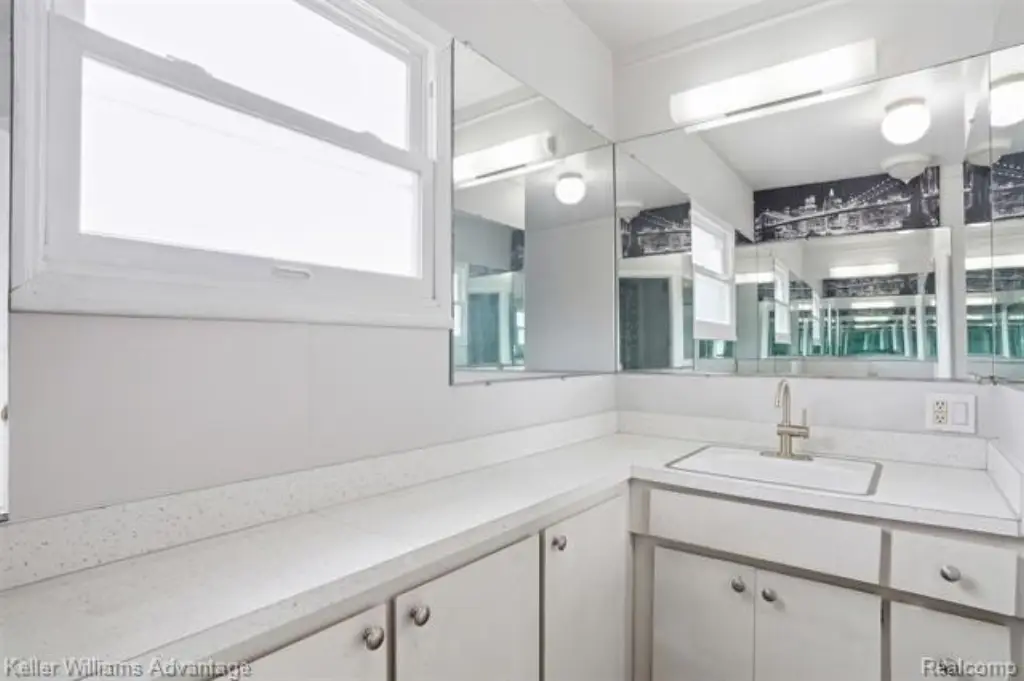
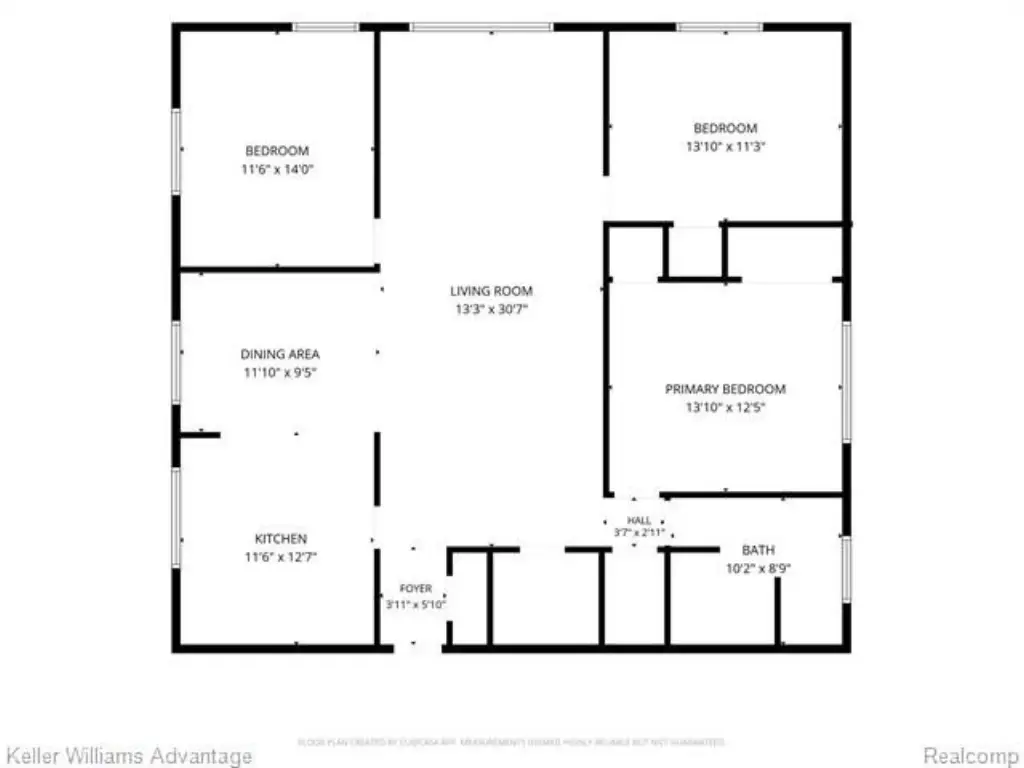
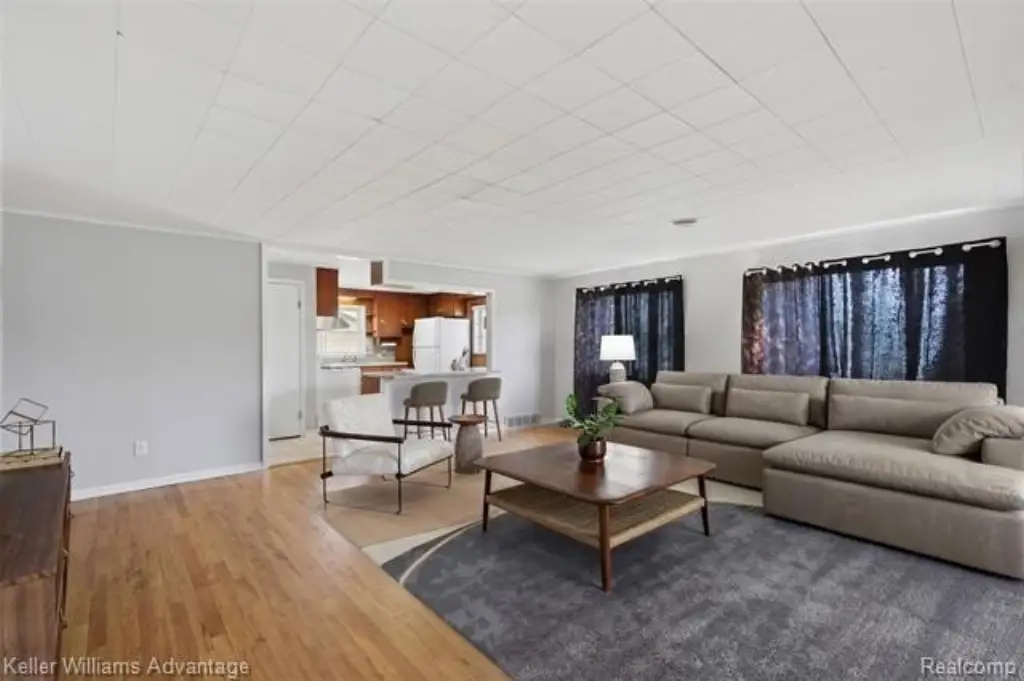
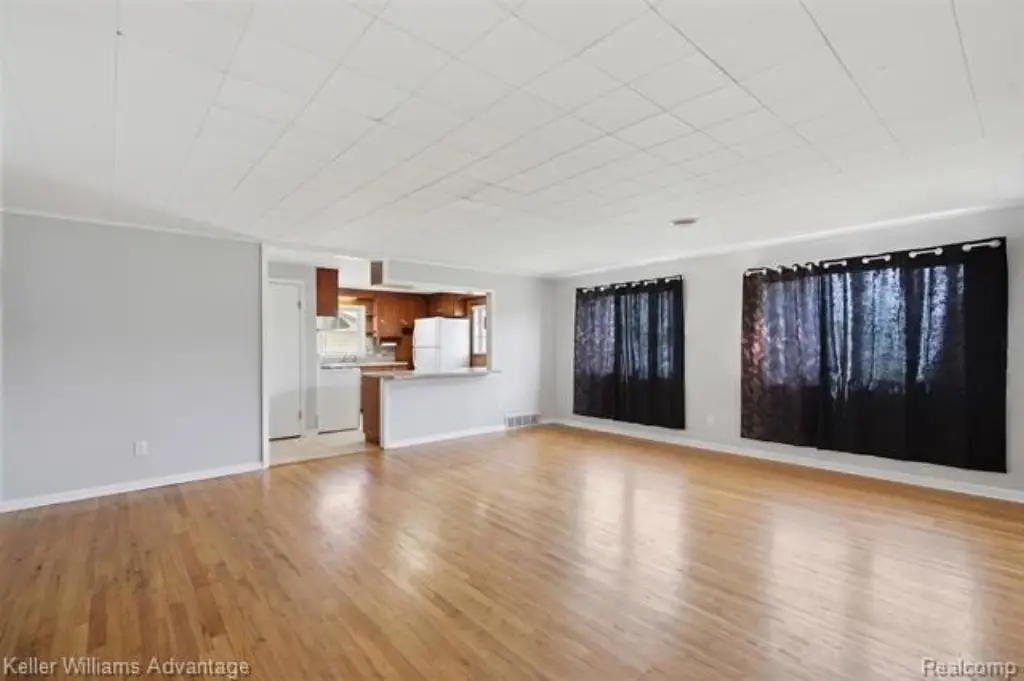
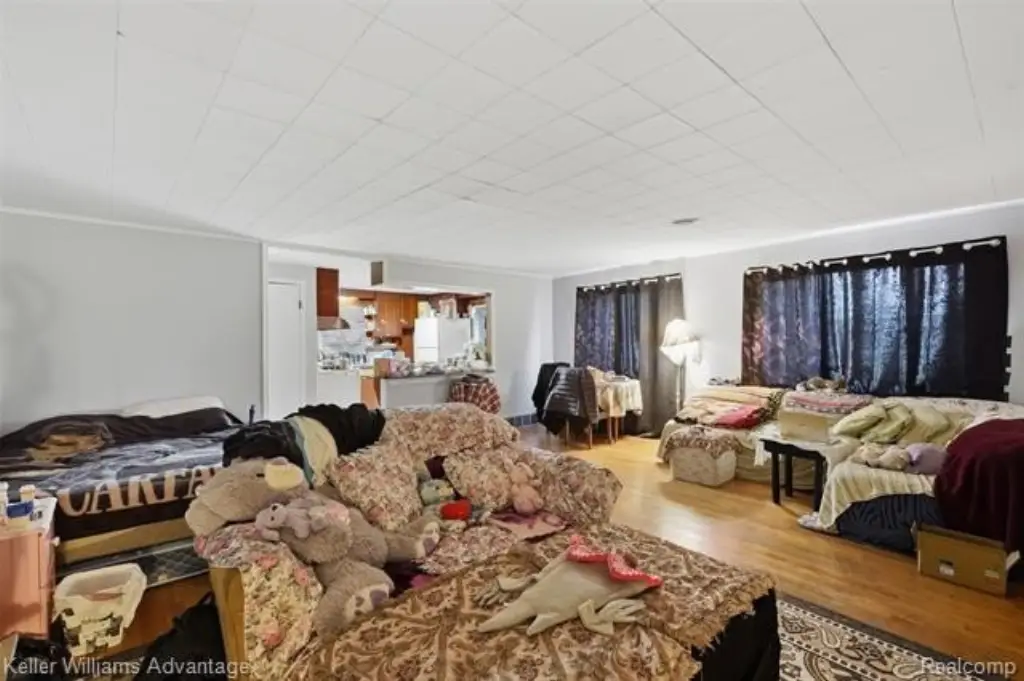
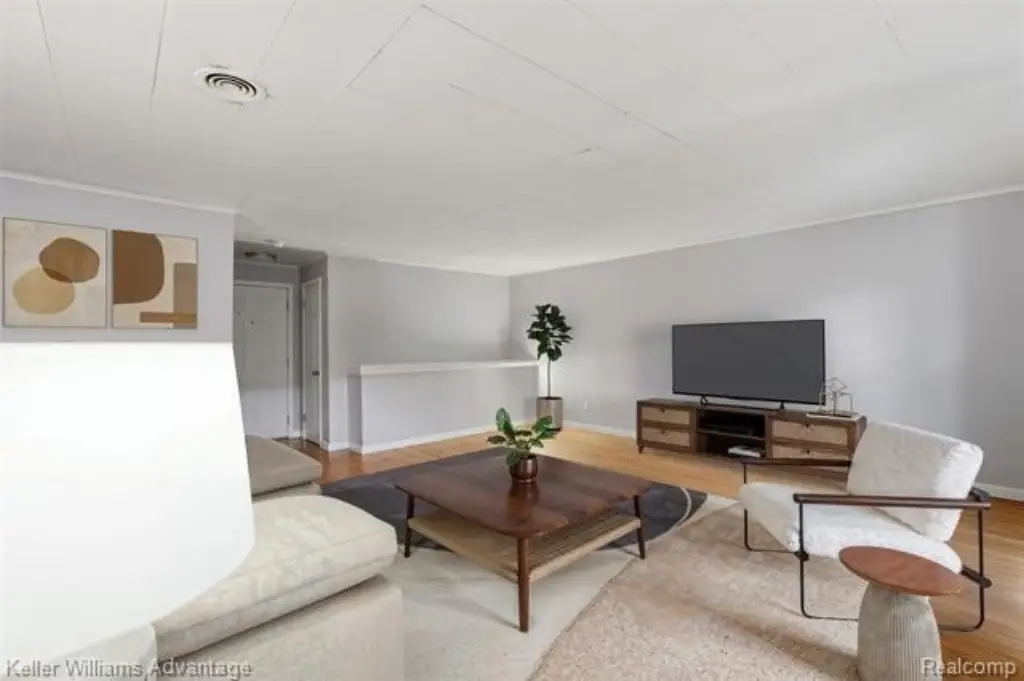
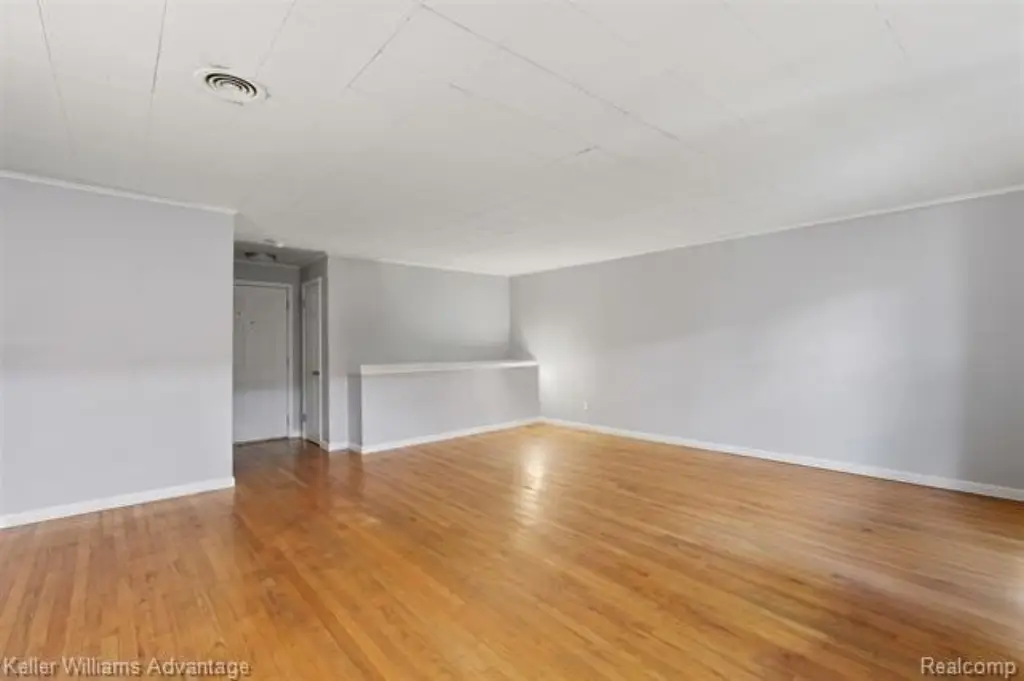
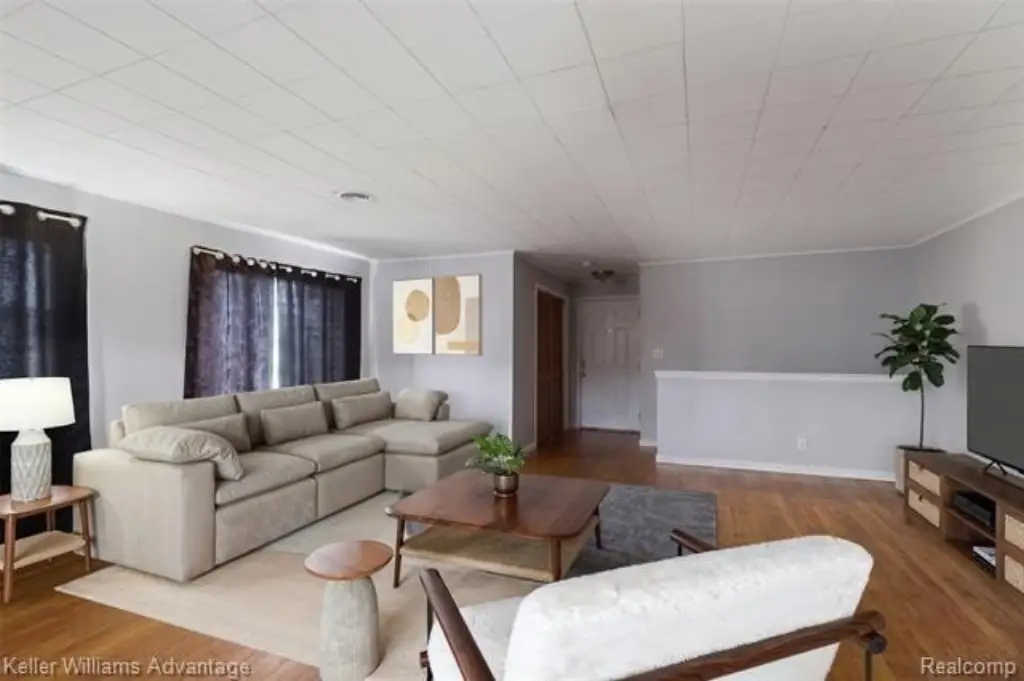
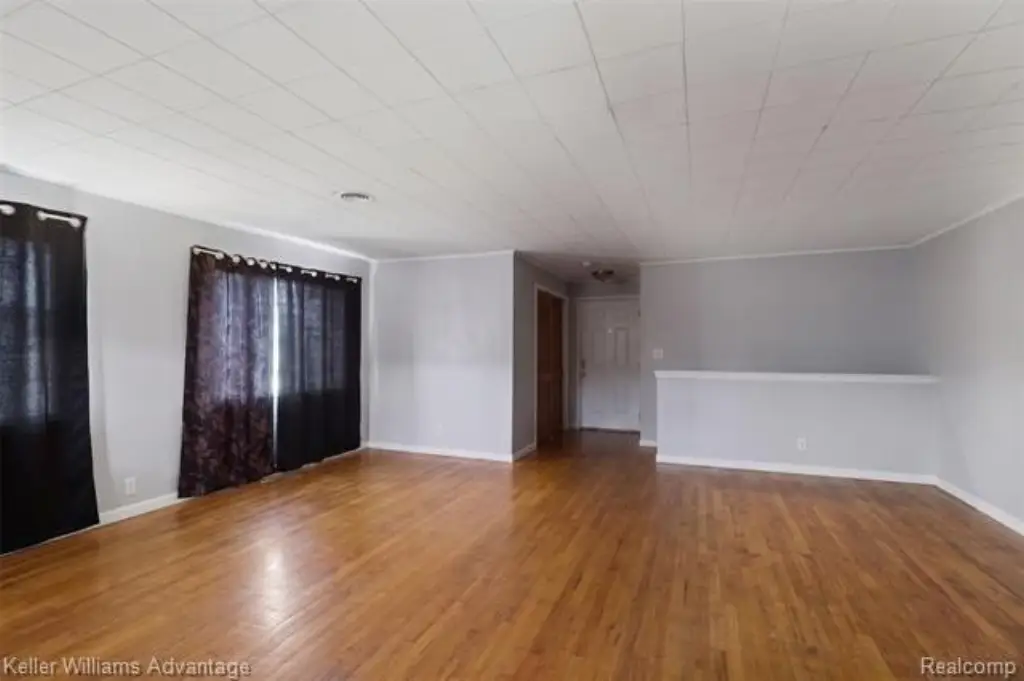
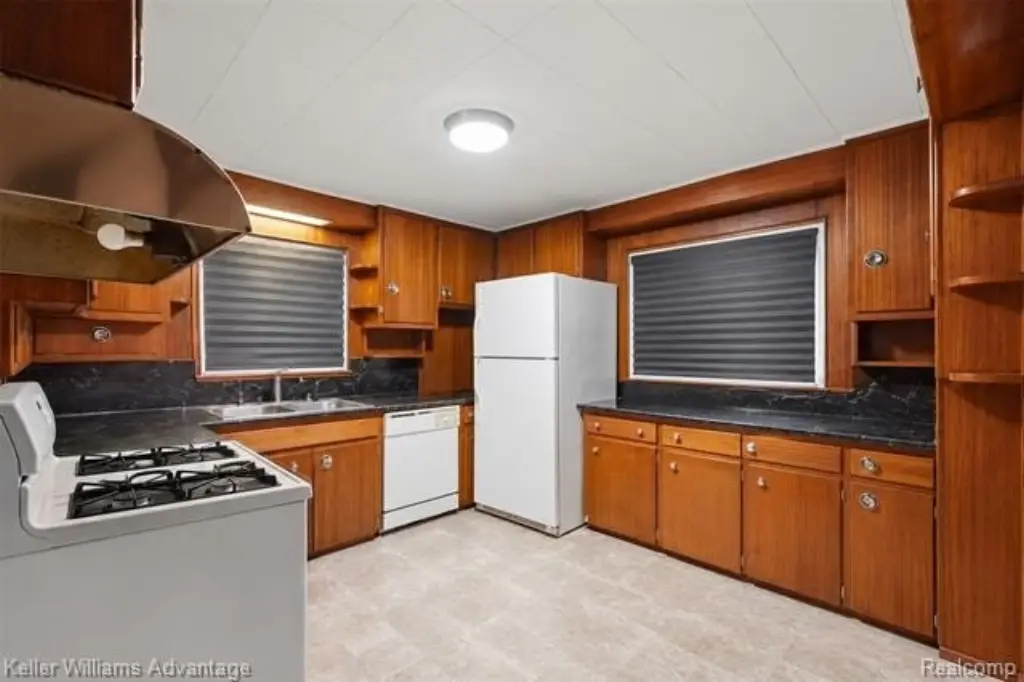
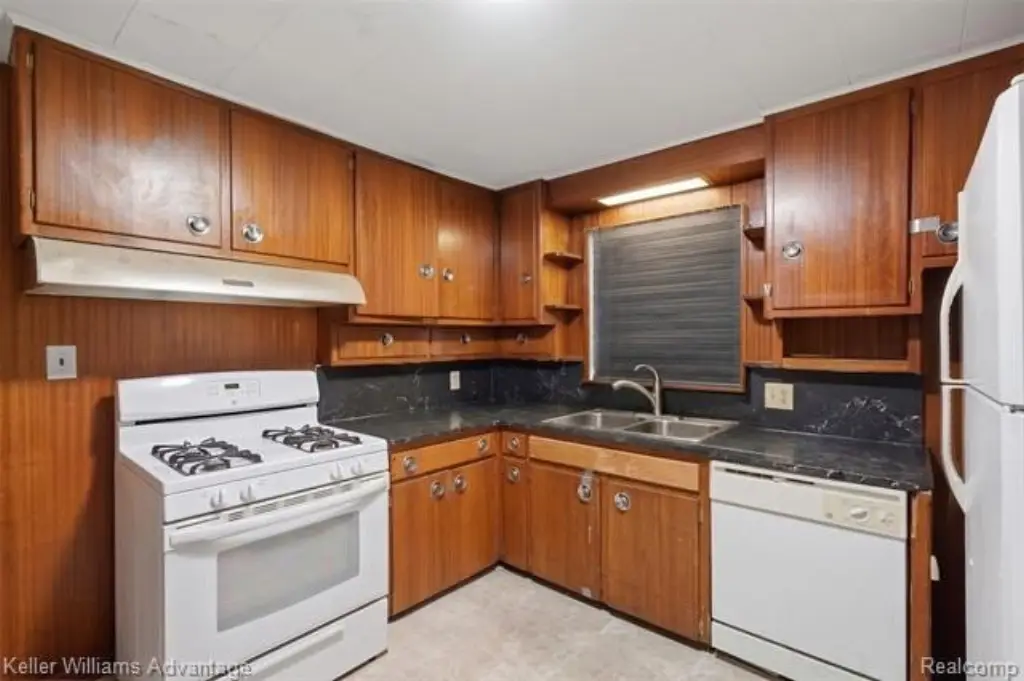
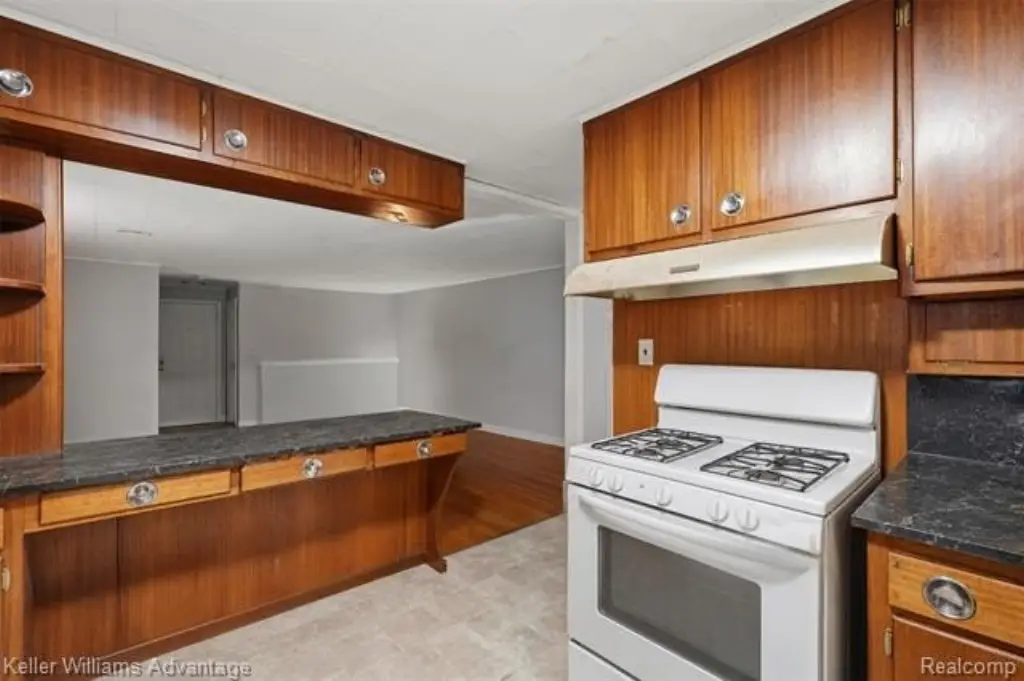
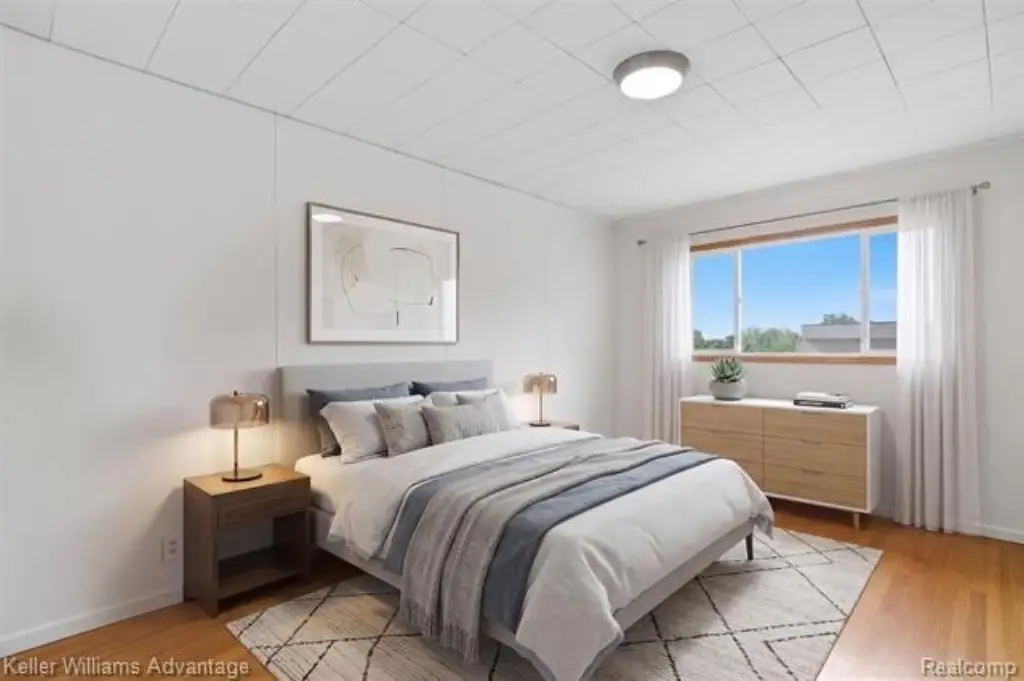
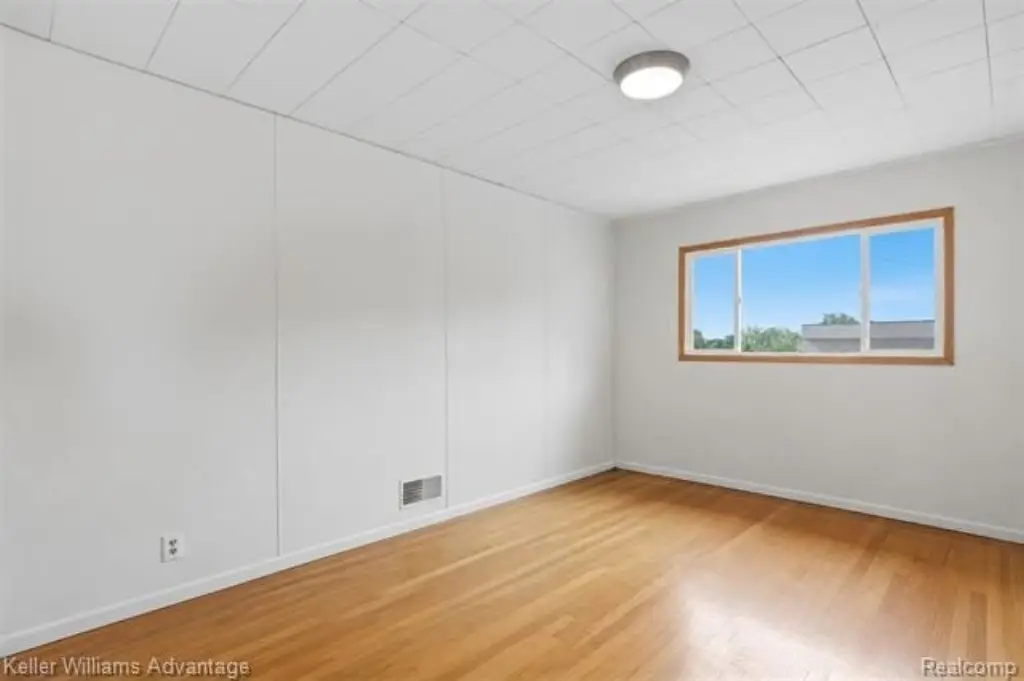
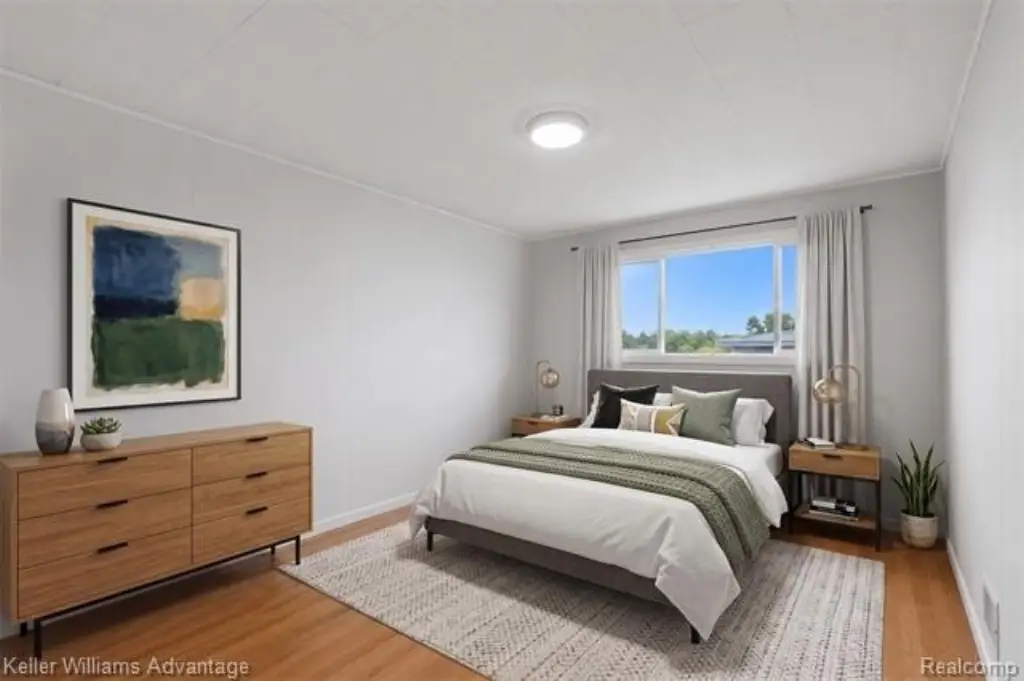
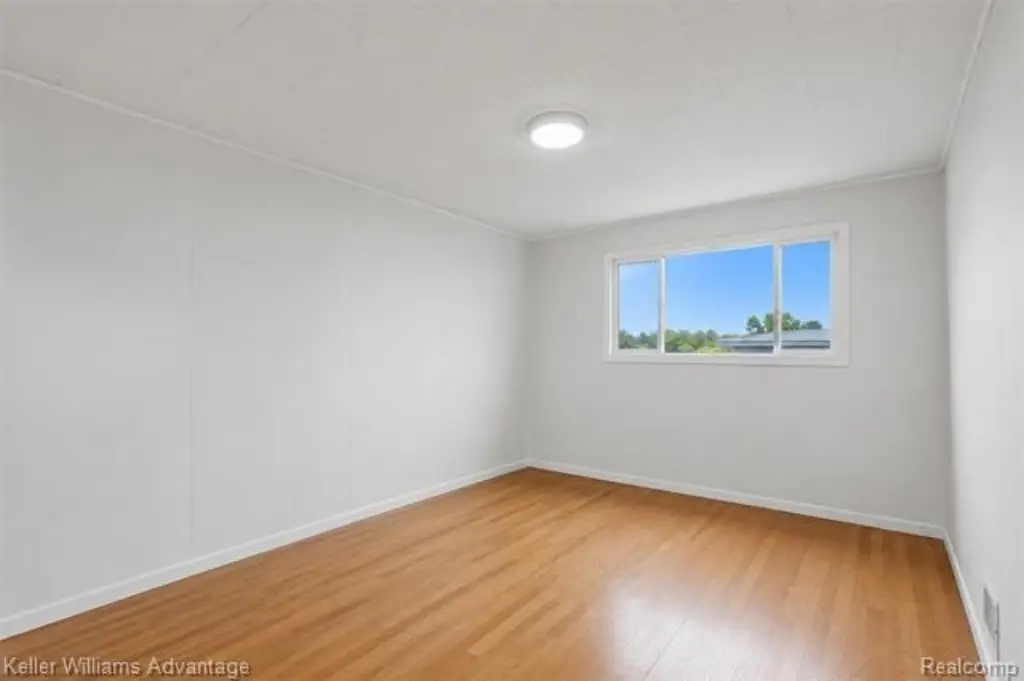
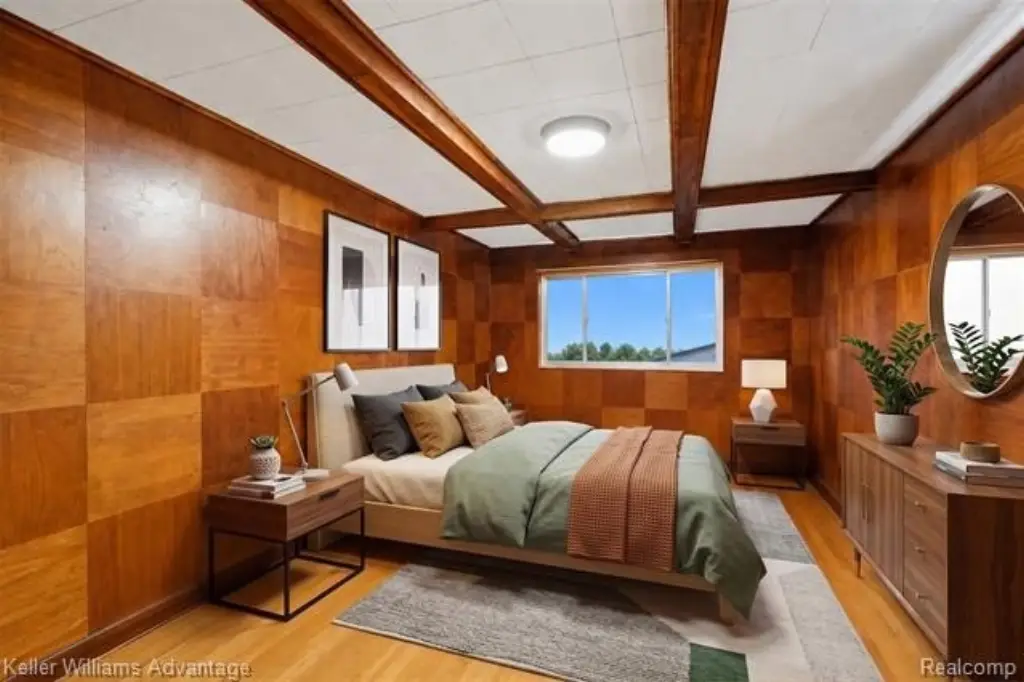
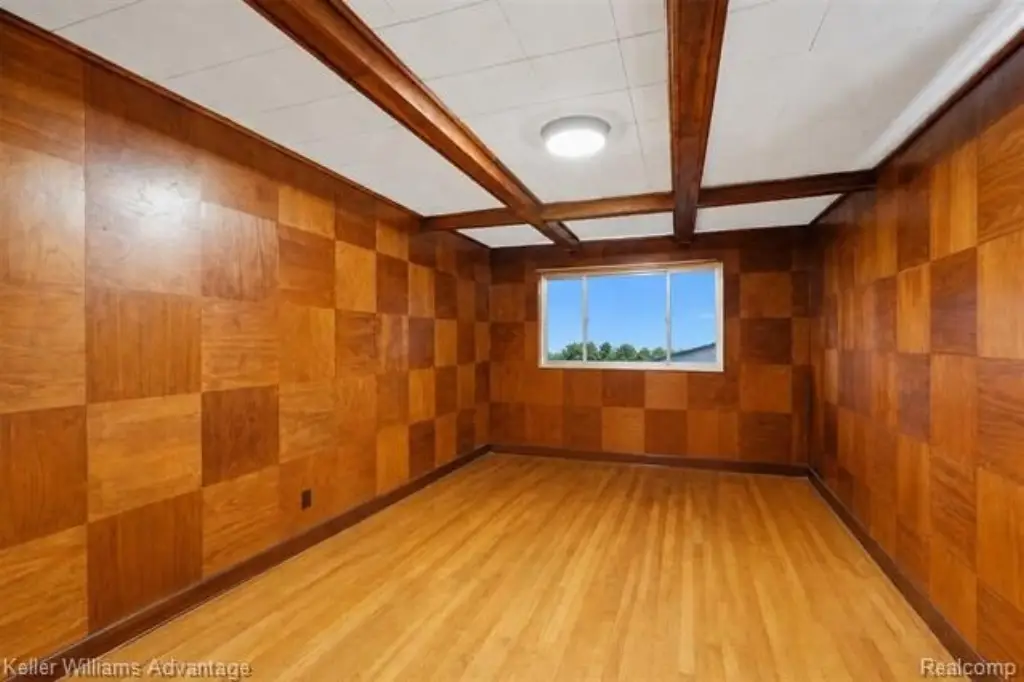
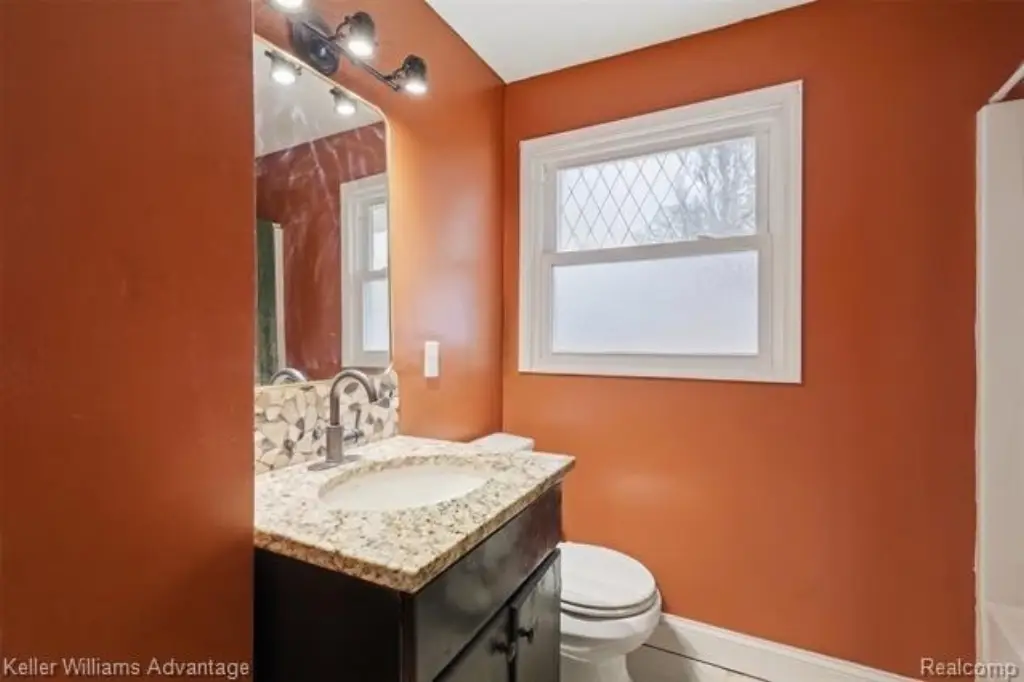
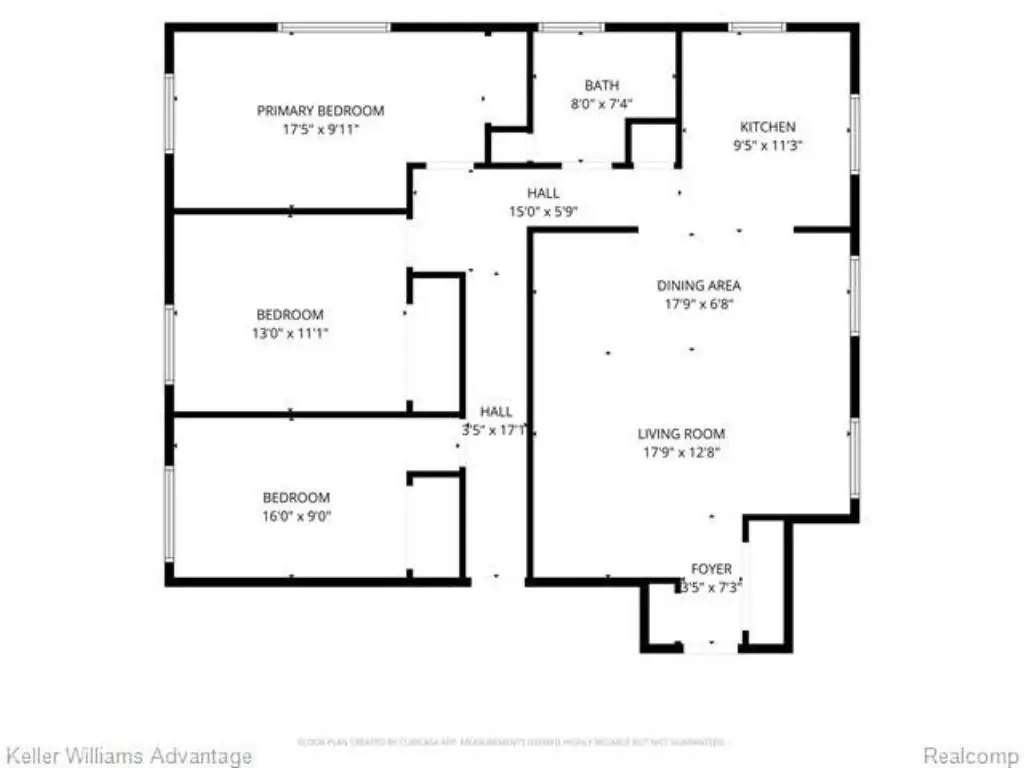
This 6,642-square-foot mixed-use property, built in 1953, contains two commercial storefronts and two residential apartments. One commercial suite is configured for a hair salon with a lobby, private restroom, and multiple individual suites. The second offers an open photography-studio layout with a private bathroom. Each apartment provides almost 1,500 square feet with three bedrooms, one bathroom, and an open floor plan; both are currently leased.
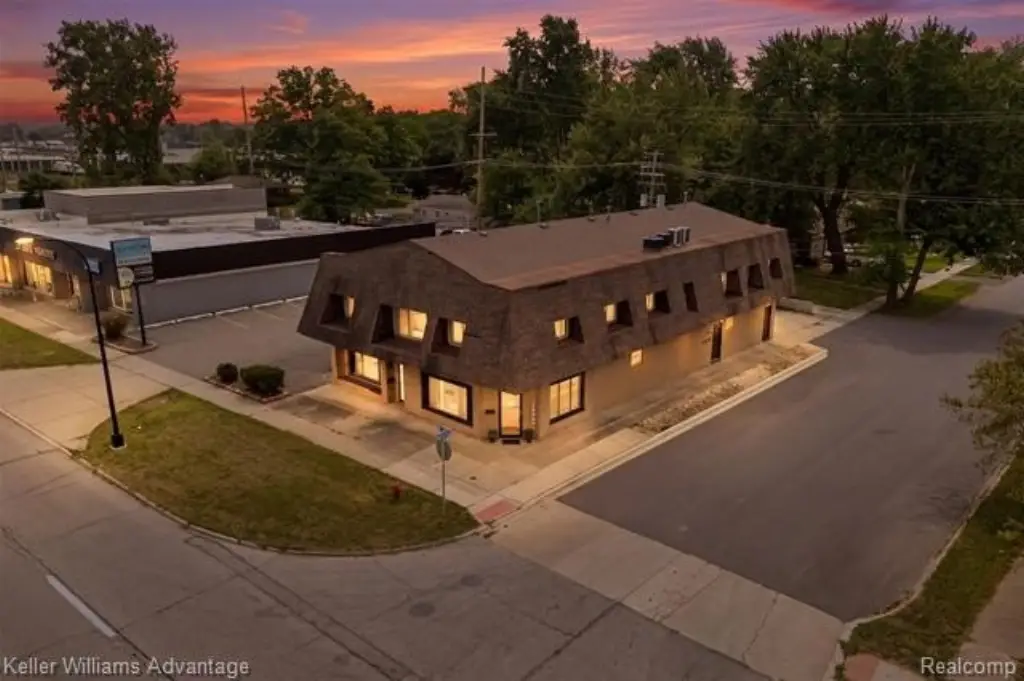
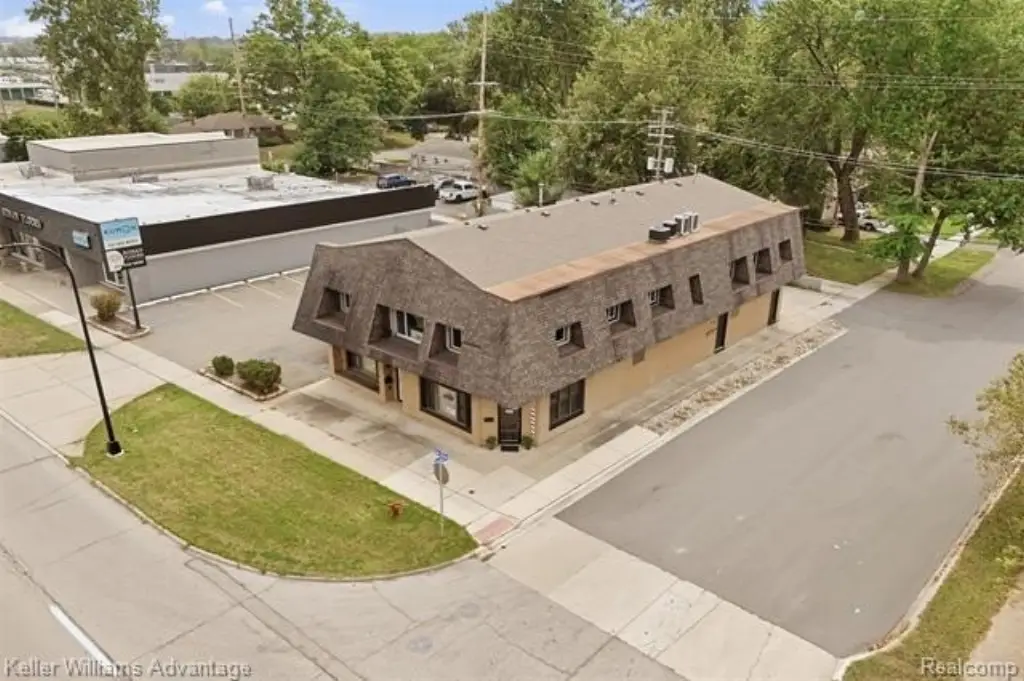
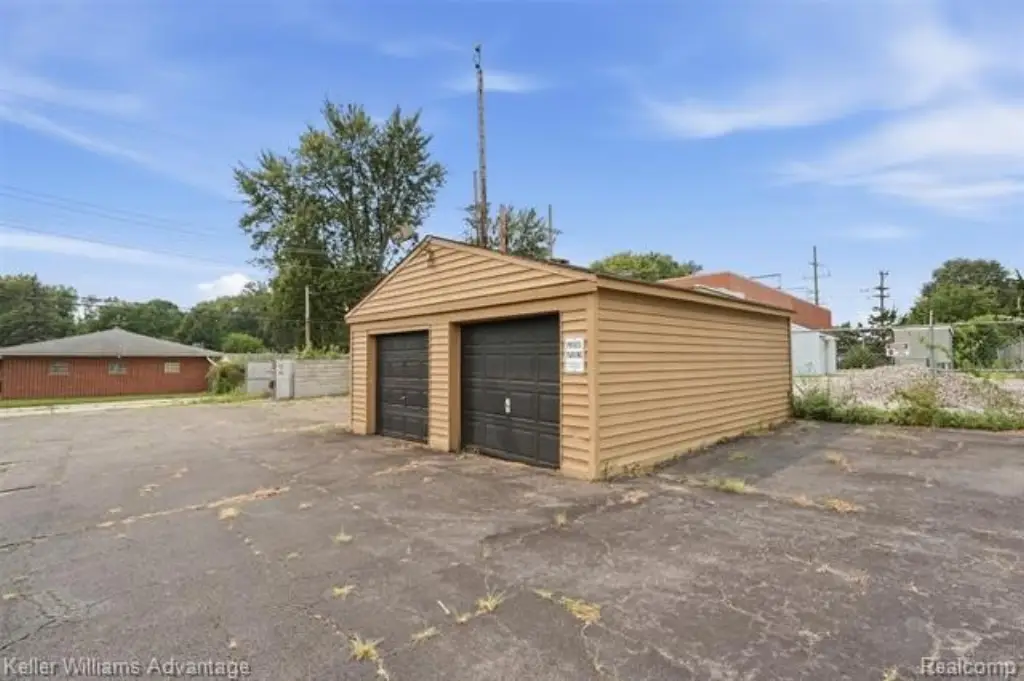
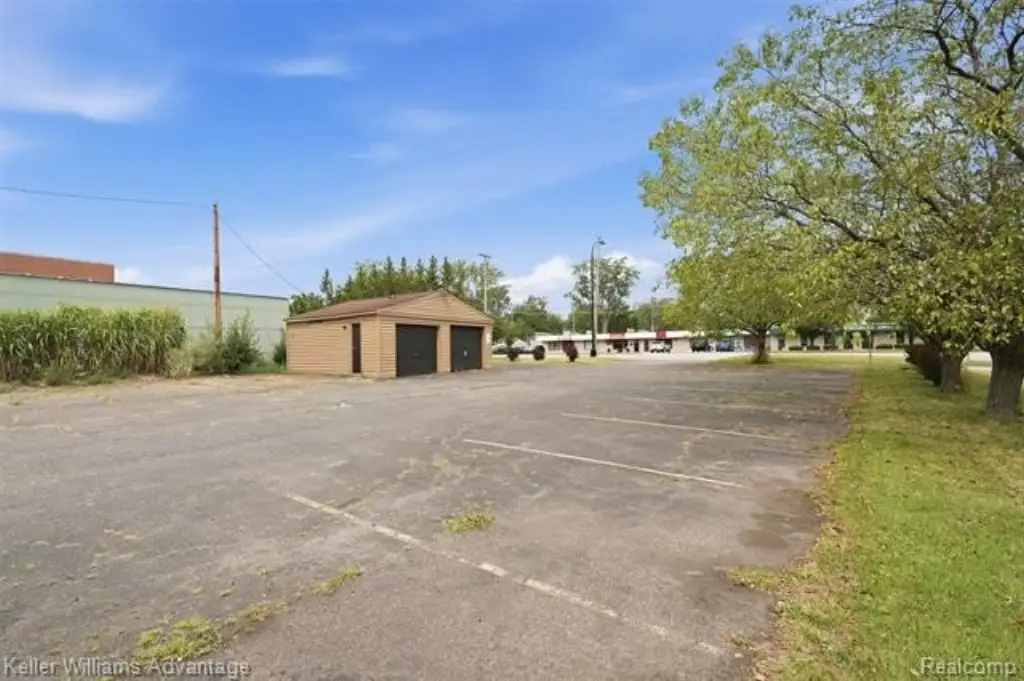
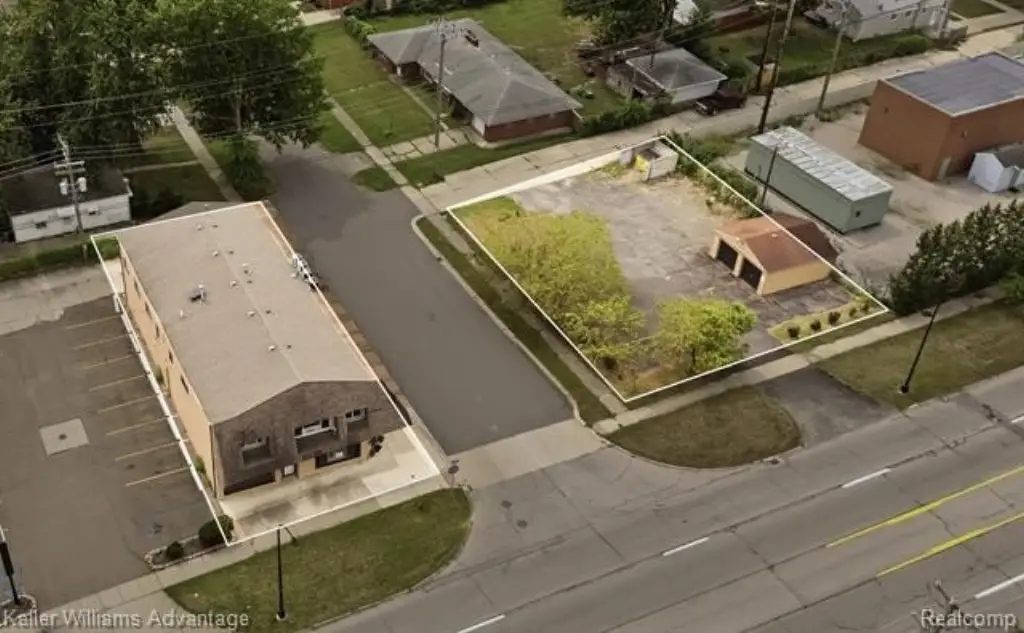
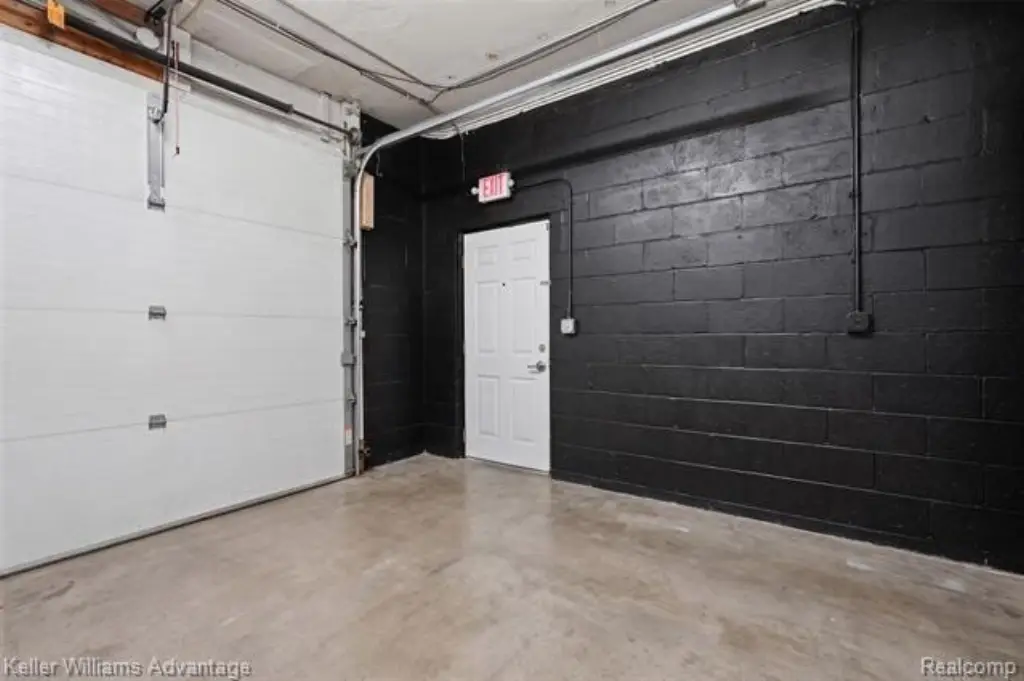
The property is located at the corner of Van Born Road and Telegraph in Taylor, Michigan. The sale includes a neighboring garage, parking lot, and vacant lot identified as parcel number 60006020880300. Additional physical features include block and brick construction, asphalt roofing, forced-air heating, and public water service.
The property is located at the corner of Van Born Road and Telegraph in Taylor, Michigan. The sale includes a neighboring garage, parking lot, and vacant lot identified as parcel number 60006020880300. Additional physical features include block and brick construction, asphalt roofing, forced-air heating, and public water service.
Key Highlights
- 6,642‑square‑foot mixed‑use property at 23589 Van Born Road, Taylor, MI 48180
- Two commercial storefronts with distinct layouts and private restrooms
- Two leased apartments, each with almost 1500 square feet, 3 bedrooms, and 1 bathroom
Property Analytics
Unlock full access to Insights
Subscribe to Realmo Intelligence
Open Analytics
Current Use
Lease Details
2
Residential units
Multi-tenant
Tenancy
Location Intelligence
Trade Area within ½ mile
319
Businesses Nearby
Explore this area
Business Placement
Demographics for 48180, MI
63,409
Population
26,741
Households
2.4
Avg Household Size
39
Median Age
16%
College-Educated
87%
High-School Grad
23.6 sq mi
ZIP Area
2,687
Density / Sq Mi
$59,537
Median Household Income
$40,090
Median Earnings
$1,036
Median Rent
$141,200
Median Home Value
Check the figures for this property
Cap Rate, Value Estimation, Potential NOI and more
View Realmo Analytics
Market
Vacancy Rate% for Multifamily in Midwest region

Questions? Ask Rey
Realmo’s AI knows this listing — price, zoning, demand, history. Ask anything.





Frequently Asked Questions
What type of property is this?
Mixed-use property - Corner property combines two commercial spaces with two leased residential apartments and a neighboring garage and parking lot.
Where is this mixed-use property located?
The property is located at 23589 Van Born Road Taylor, MI.
What is the asking price?
The asking price for this property is $650,000.
What are key features of this property?
This property features: 6,642‑square‑foot mixed‑use property at 23589 Van Born Road, Taylor, MI 48180; Two commercial storefronts with distinct layouts and private restrooms; Two leased apartments, each with almost 1500 square feet, 3 bedrooms, and 1 bathroom