Historic Mixed-Use
For Sale
$895,000
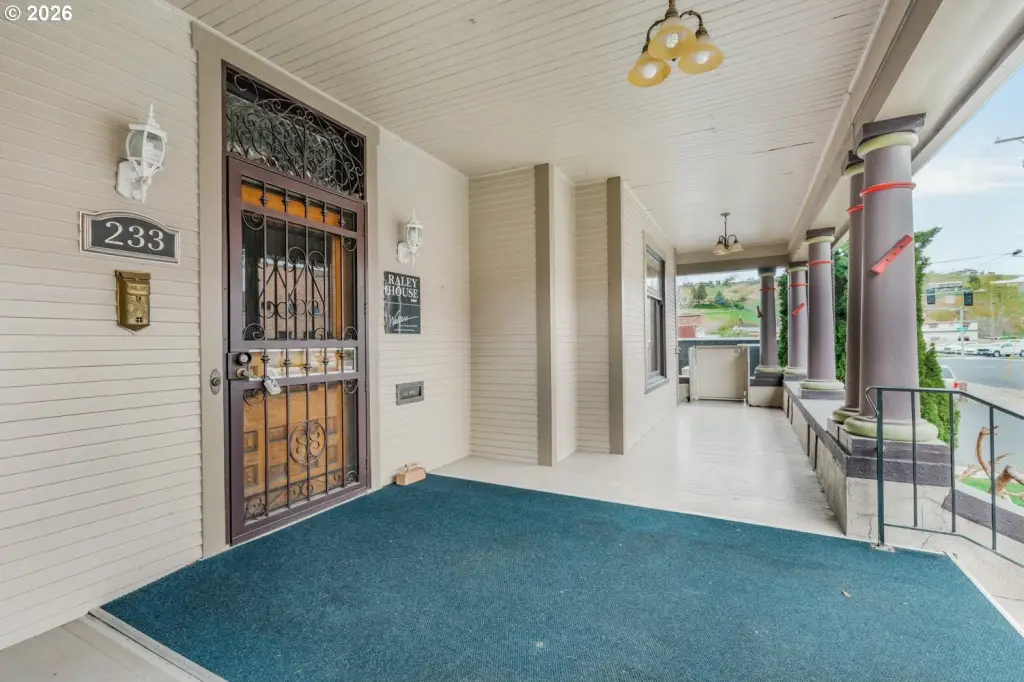
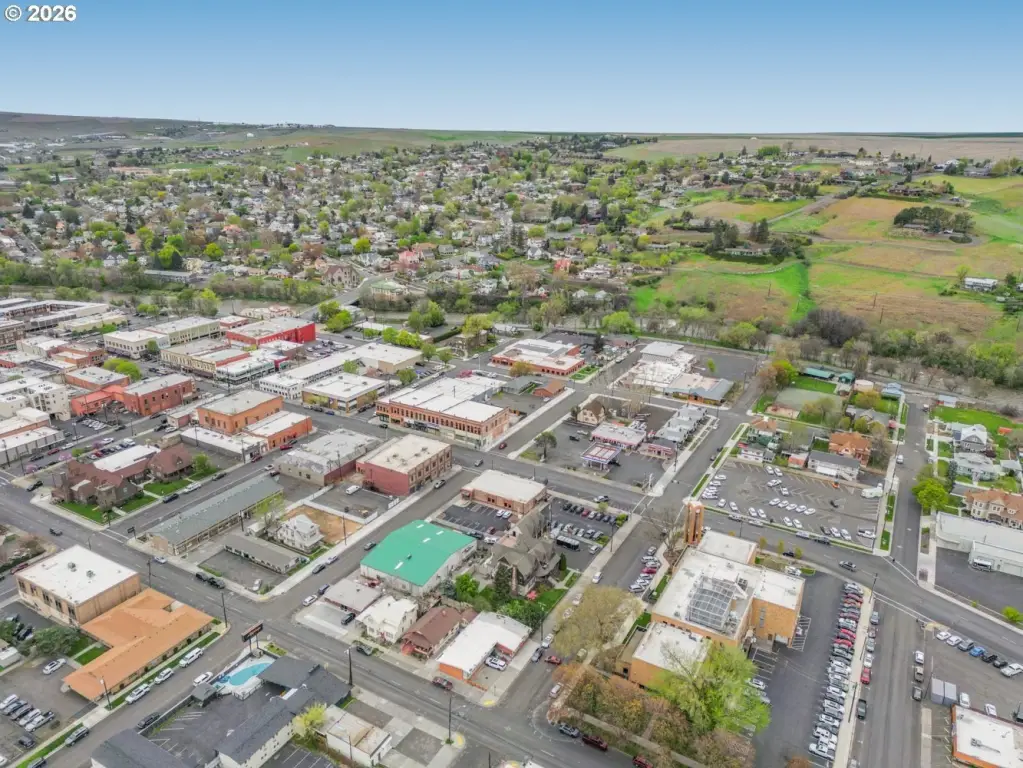
233 SE 4TH St, Pendleton, OR 97801
CommercialSale, Pendleton, OR
Property Size9,177 SF
Lot Size0.40 Acres
Price / SF$97.53
Days on Market174
Property Features for 233 SE 4TH St
General Information
Property type
Commercial Sale
Property subtype
Other
Zoning
C1
View
City, Territorial
Directions
Main St to Dorian, 4 blocks to 4th, turn right.
Subdivision
_435
Standard status
Active
APN
111616
Size
9,177 SF
Lot size
0.40 Acres
Taxes and HOA fees
Tax Description
MAP#2N3211BB06300
Tax Annual Amount
17372
Legal Description
MAP#2N3211BB06300
Utilities
Heating system
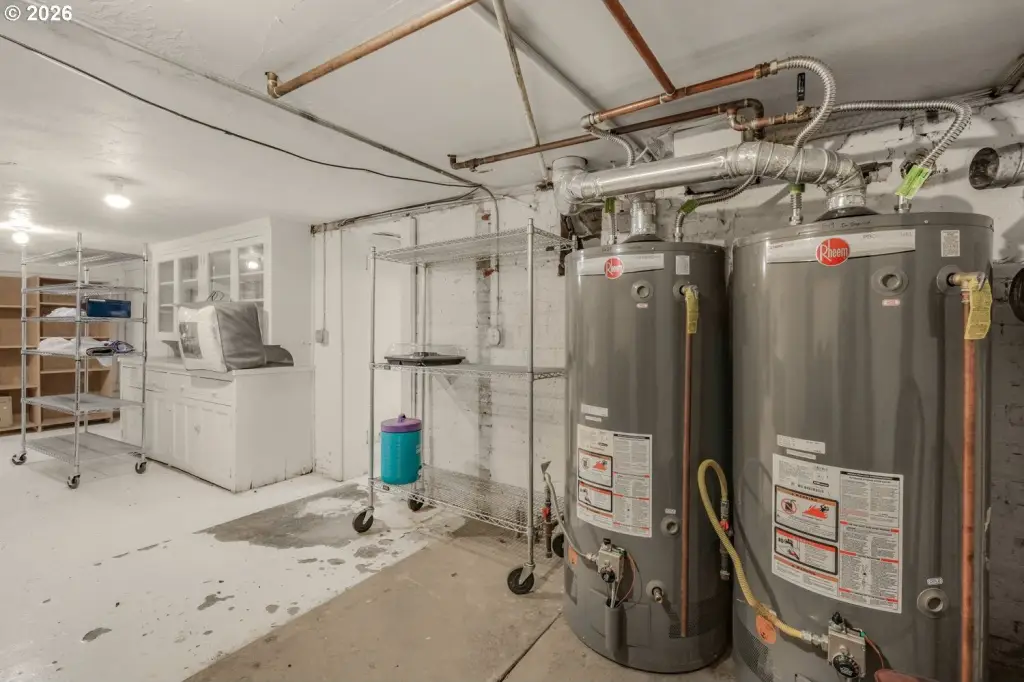
Forced Air
Cooling system
Central Air
Building Details
Year built
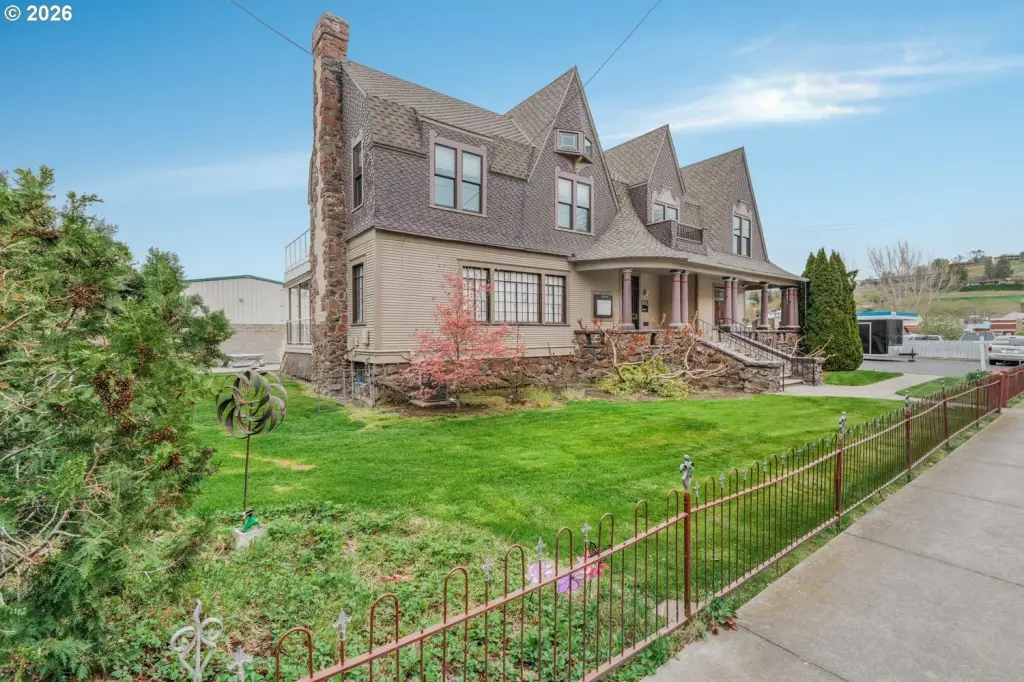
1904
Floors in Building
3
Building materials
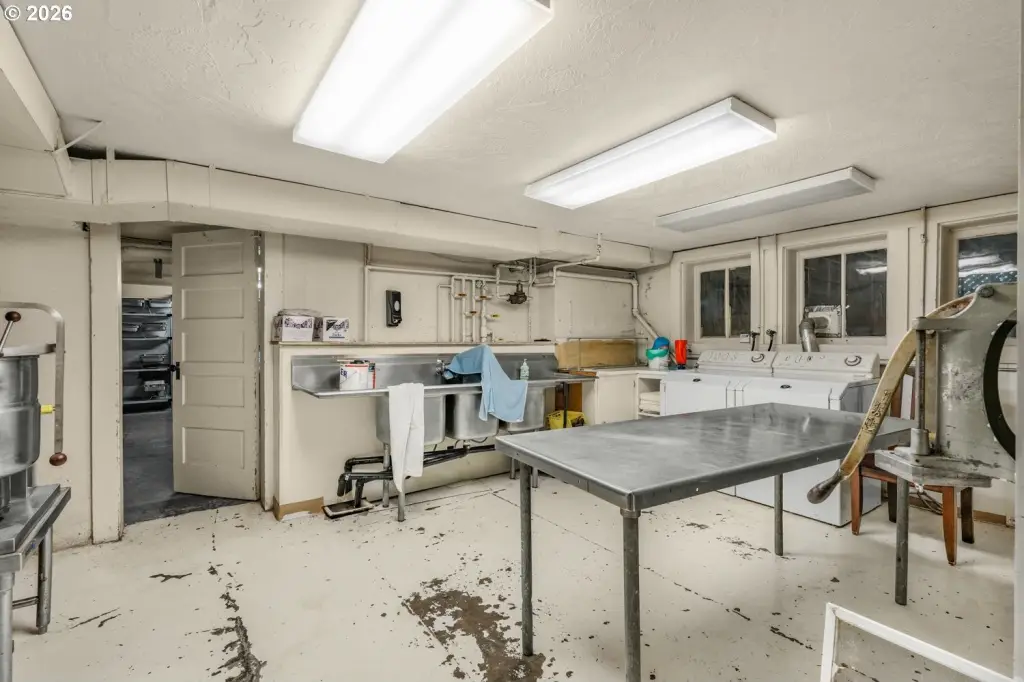
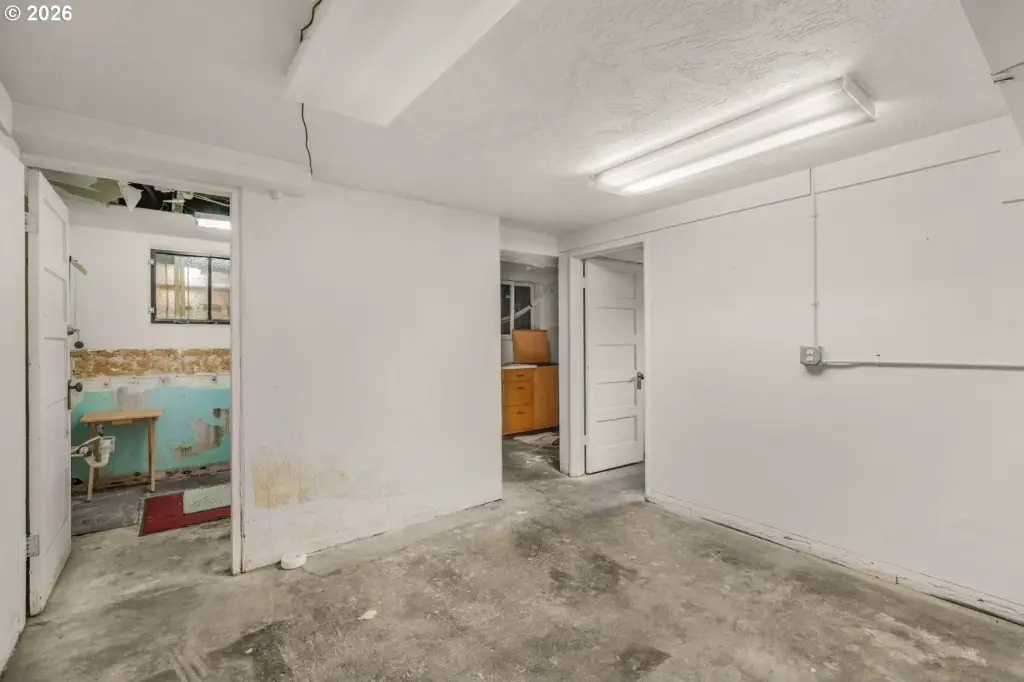
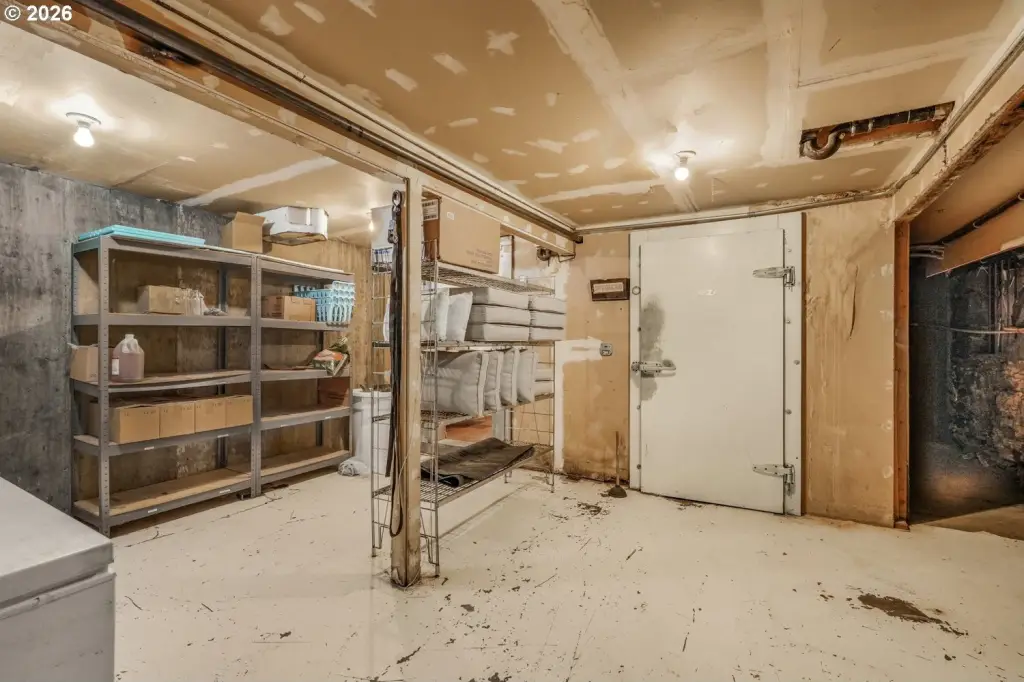
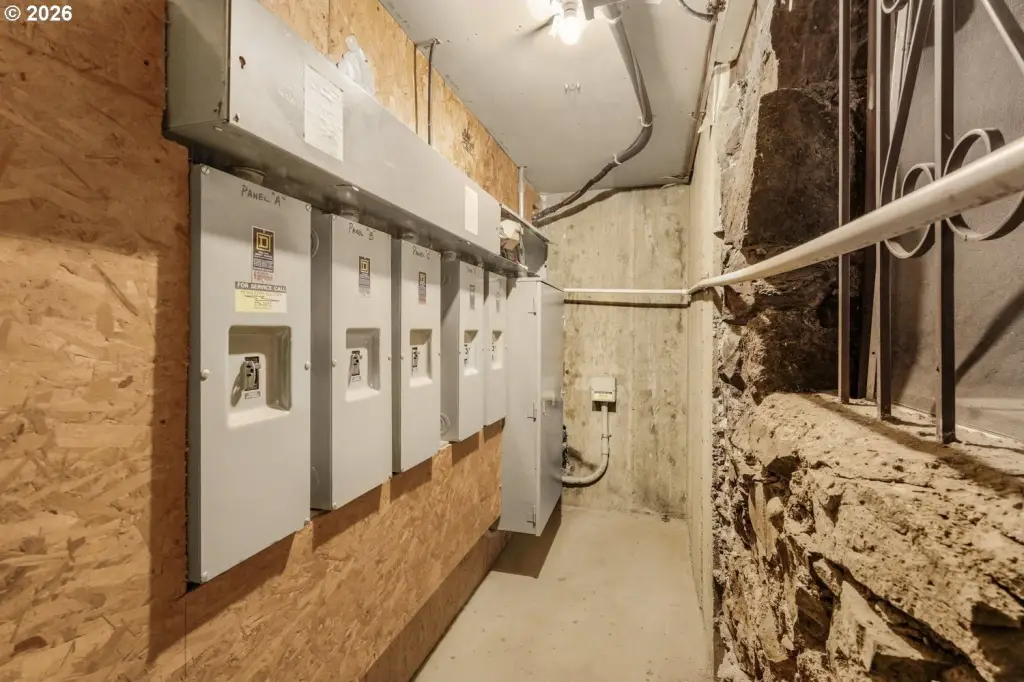
FullBasement, ShingleSiding, TongueandGroove
Roof type
Composition, Shingle
Listing Agency:
eXp Realty, LLC
(888) 814-9613
Listed By:
Nick Shivers · License #200209063
(503) 389-0821
Added: Apr 20
Changed: Oct 7
Last Checked: Oct 10 at 9:06AM
MLS# 734171783
Copyright © 2026 Regional Multiple Listing Services. All rights reserved. All information provided by the listing agent/broker is deemed reliable but is not guaranteed and should be independently verified.
Investment Insights
Based on property information with market context.
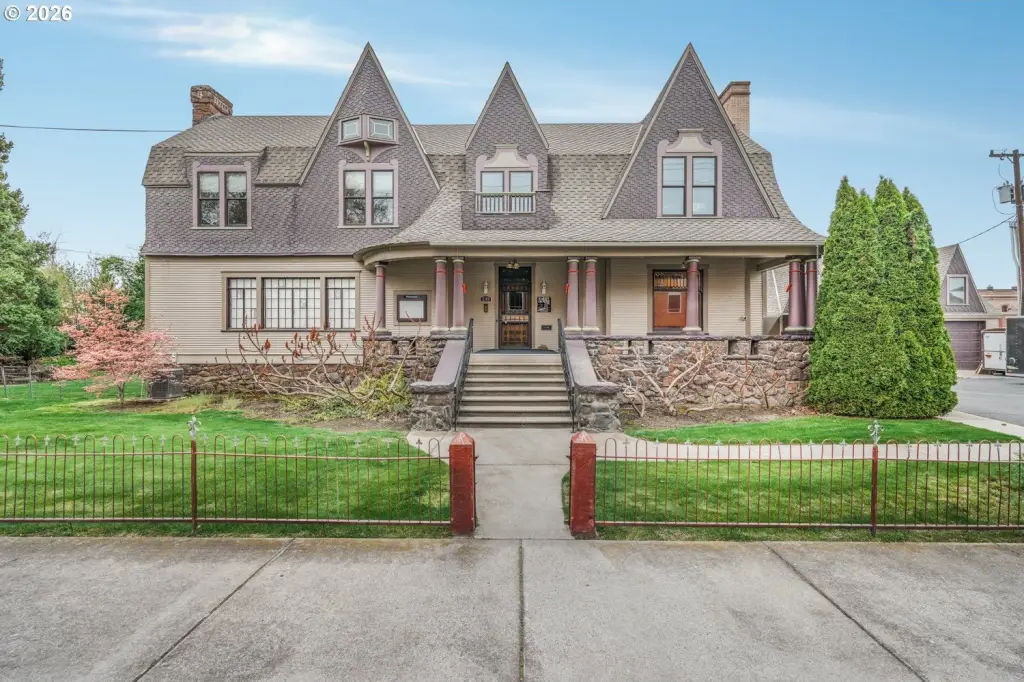
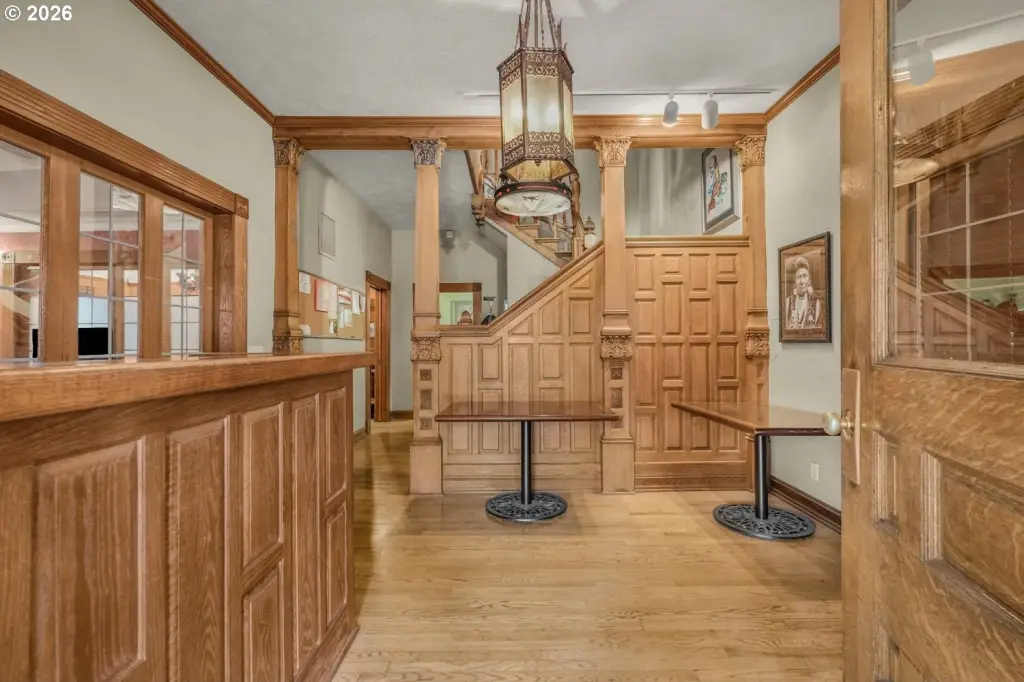
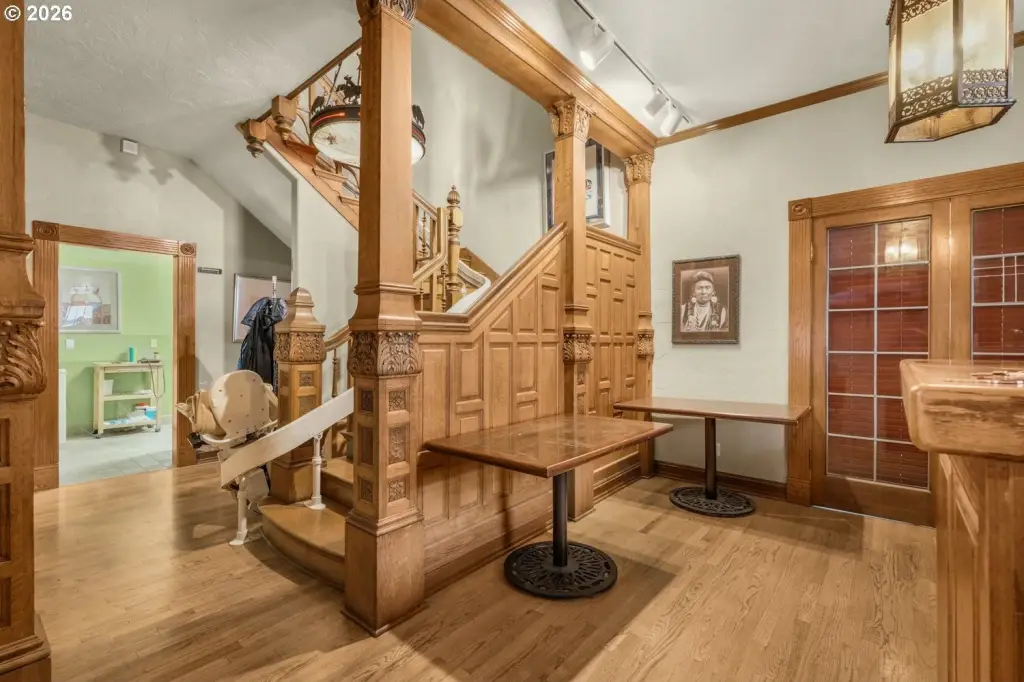
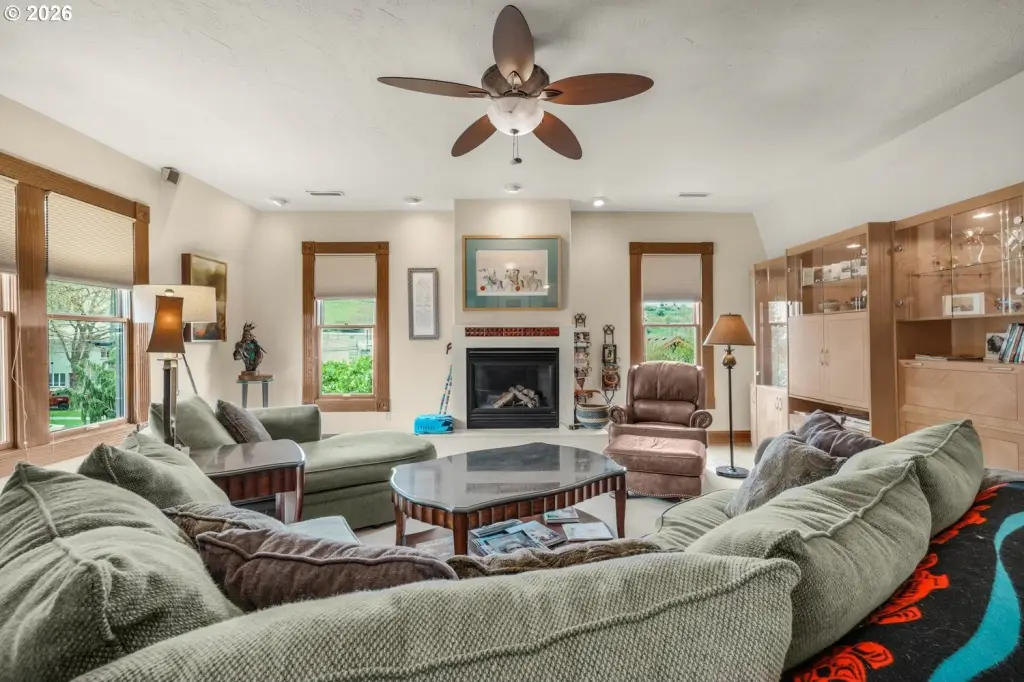
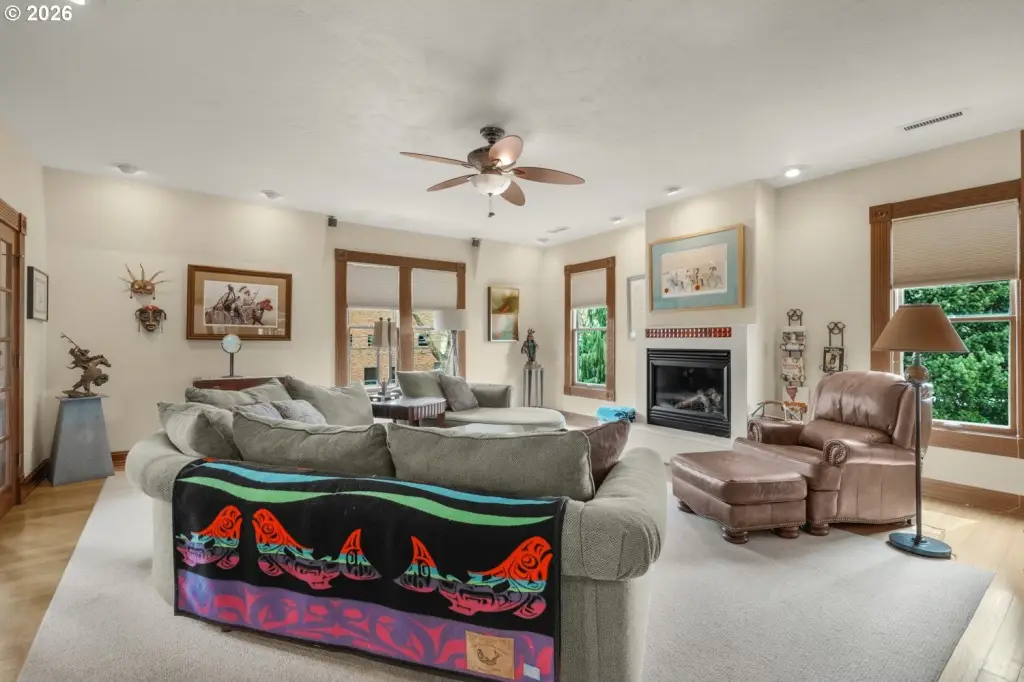
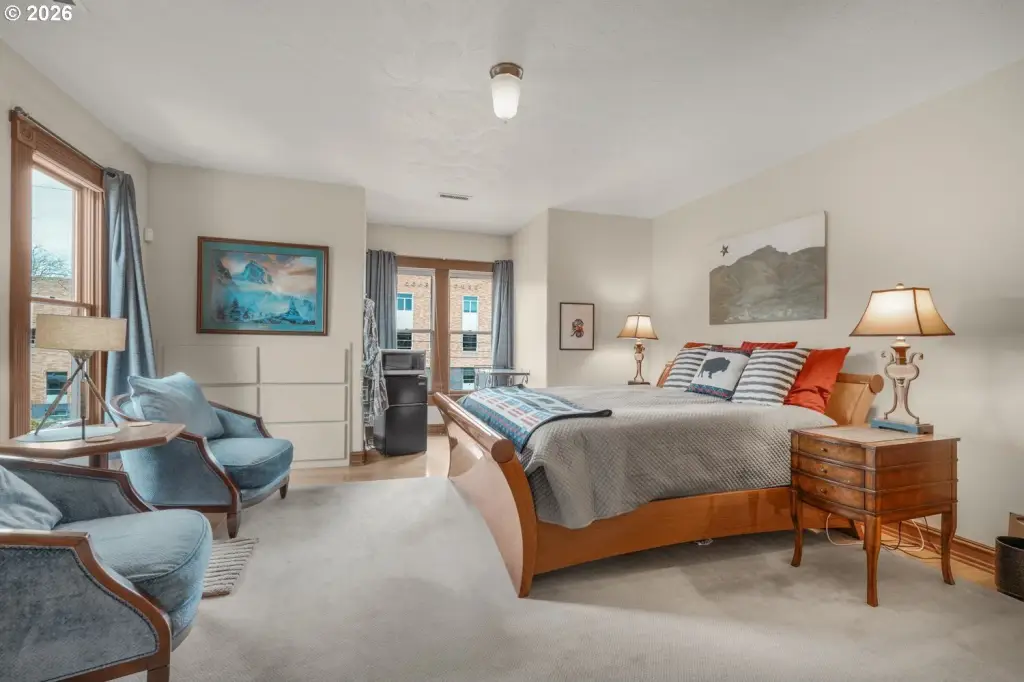
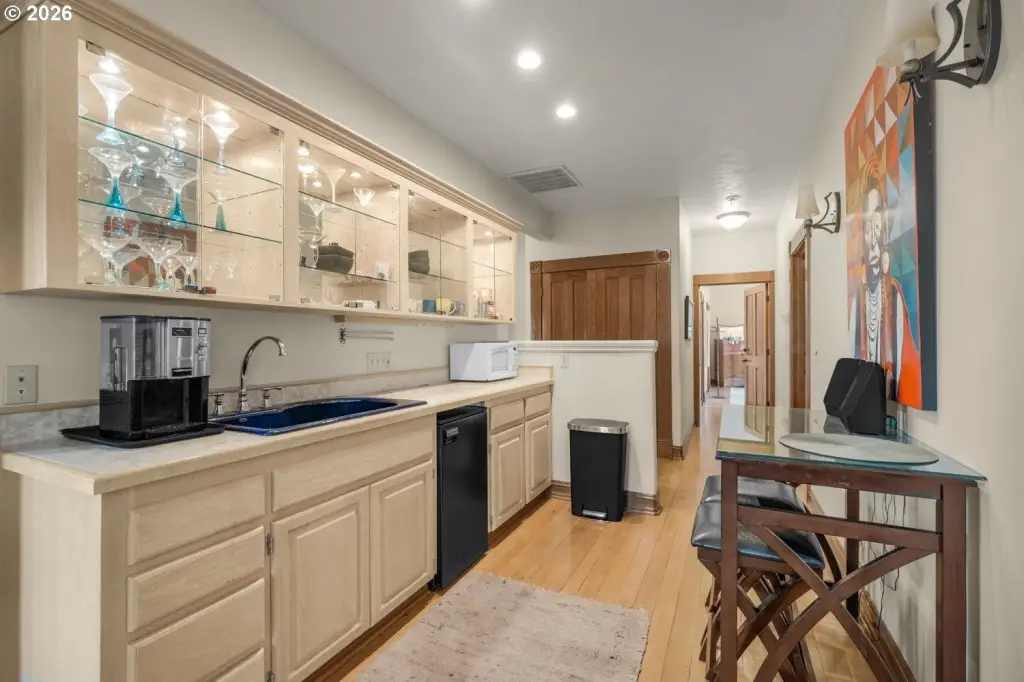
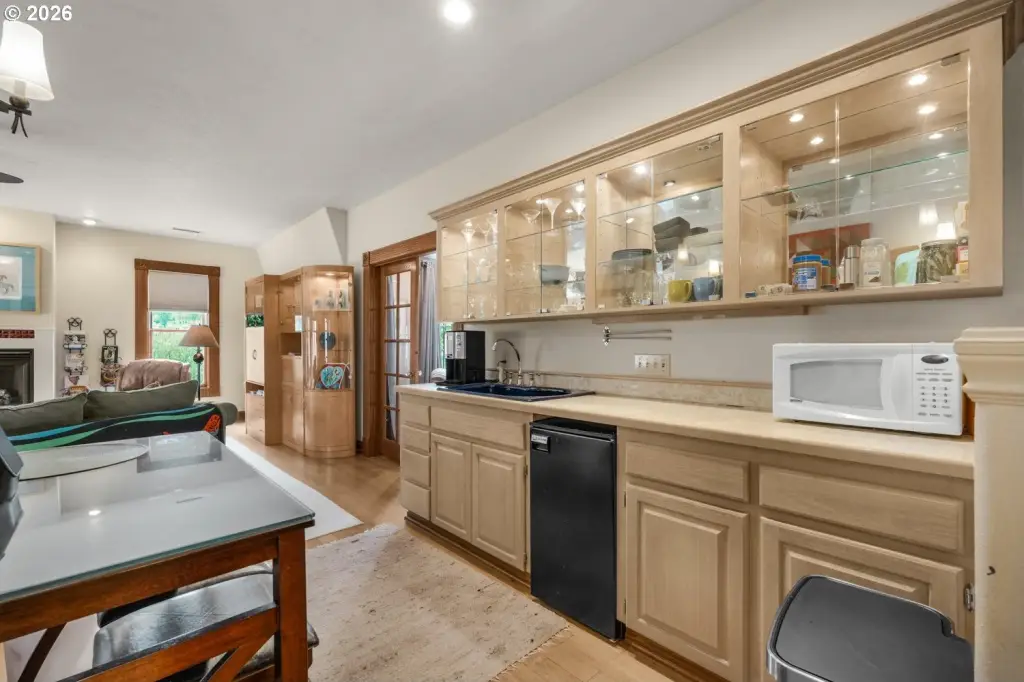
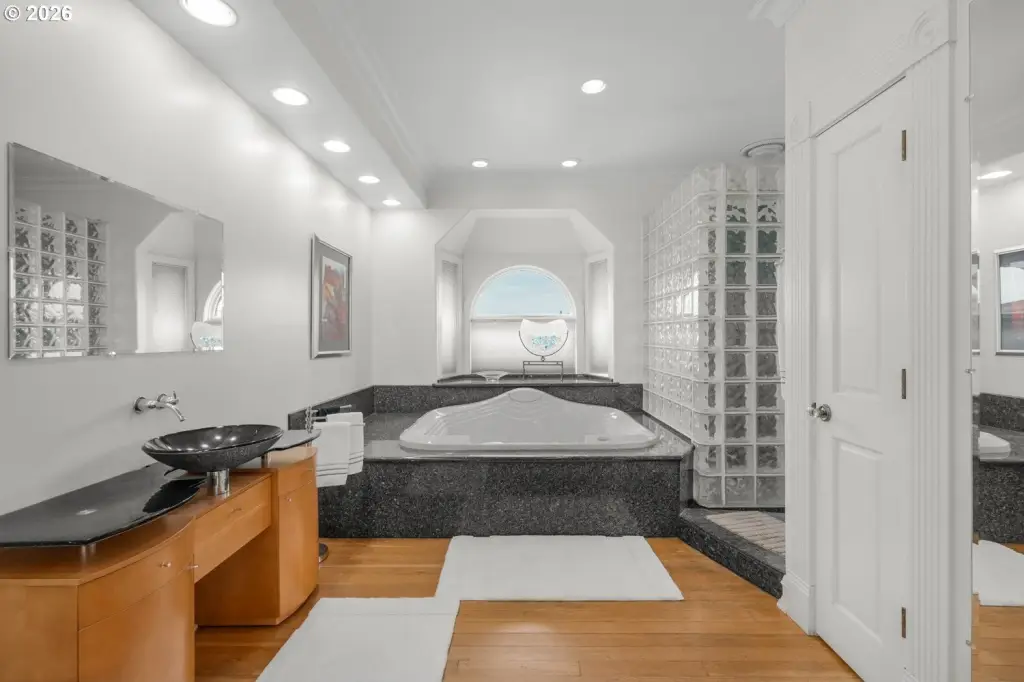
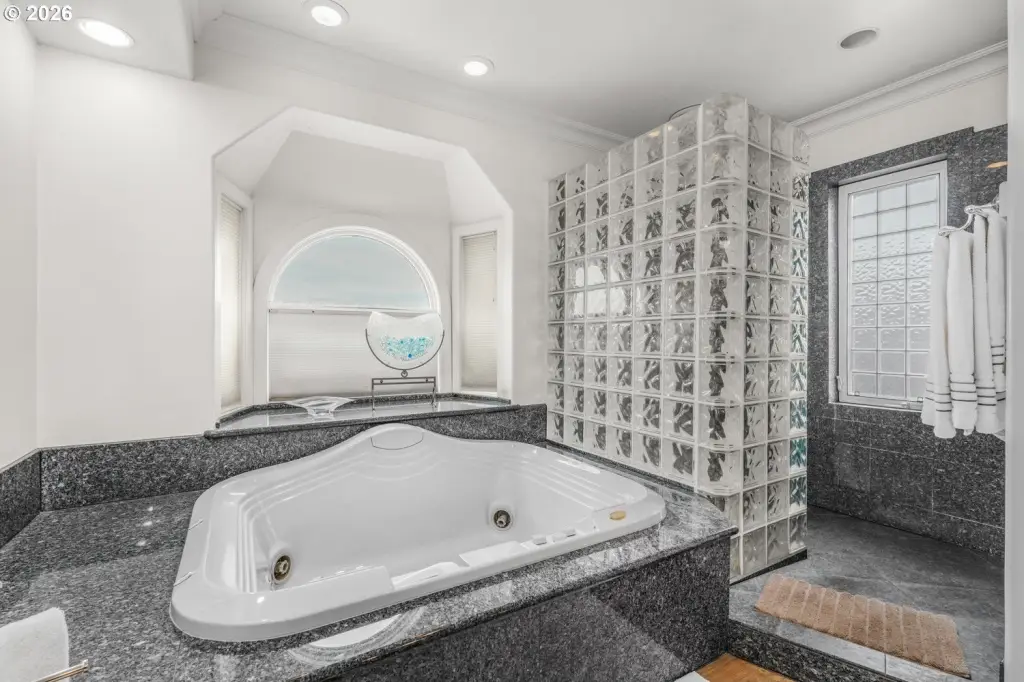
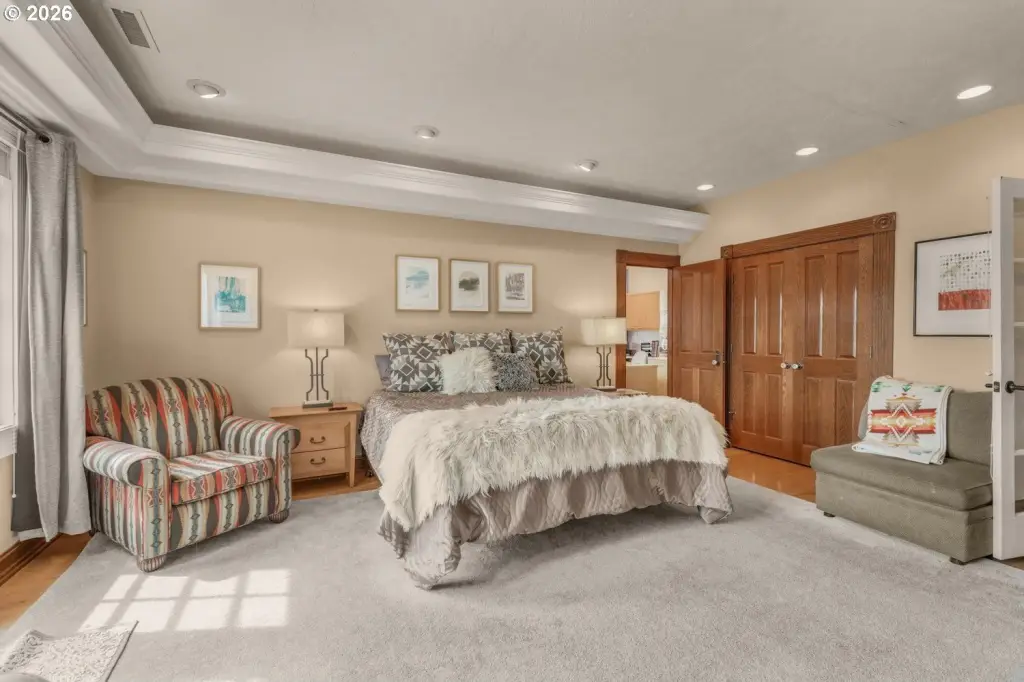
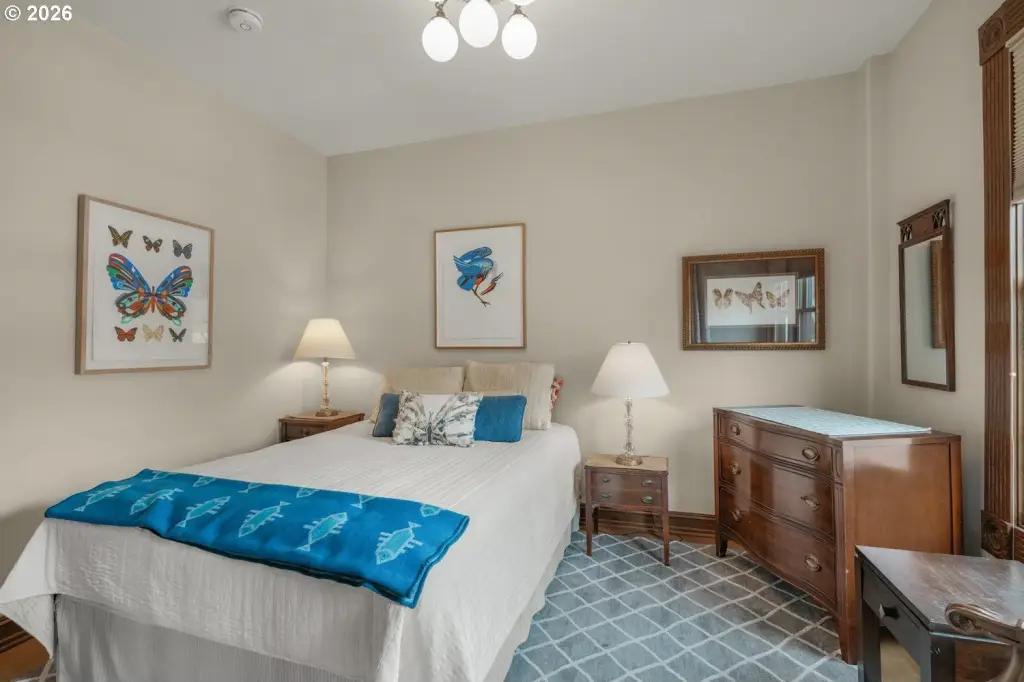
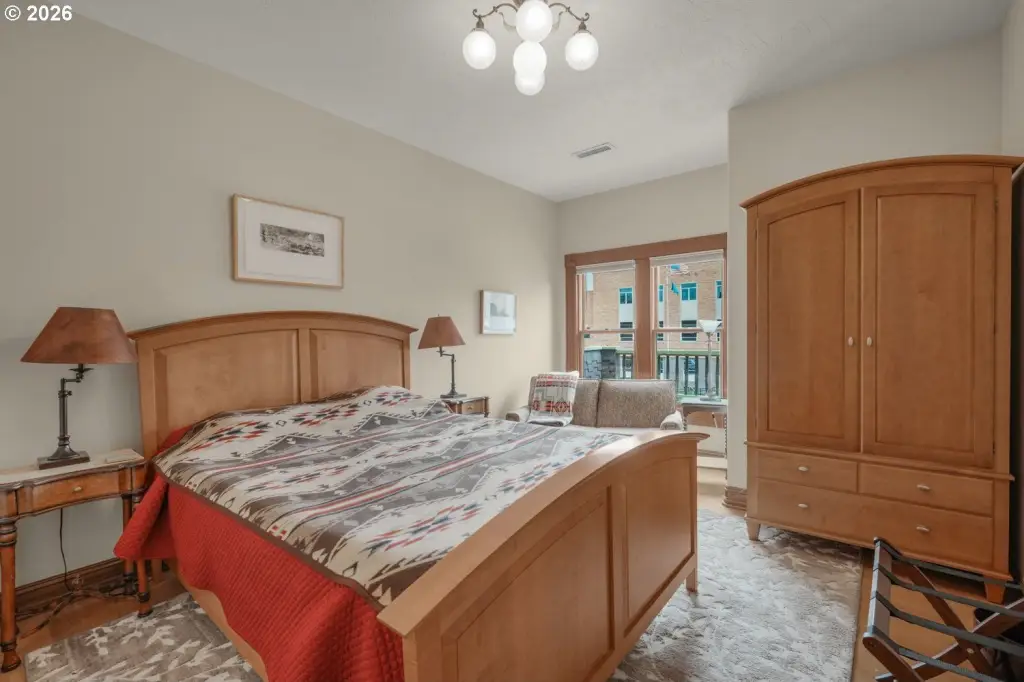
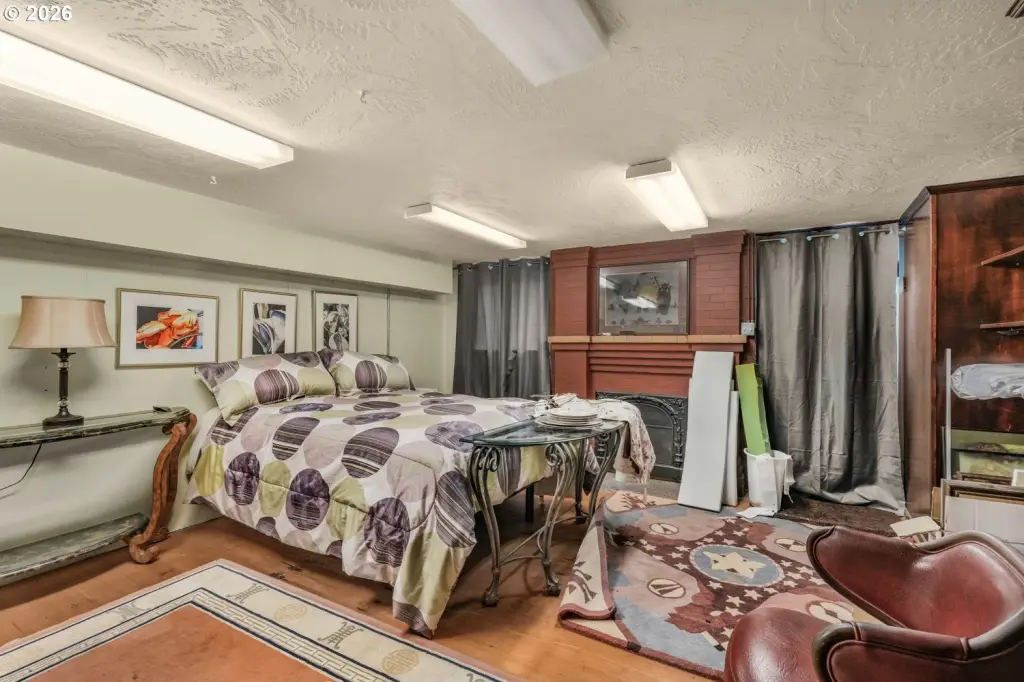
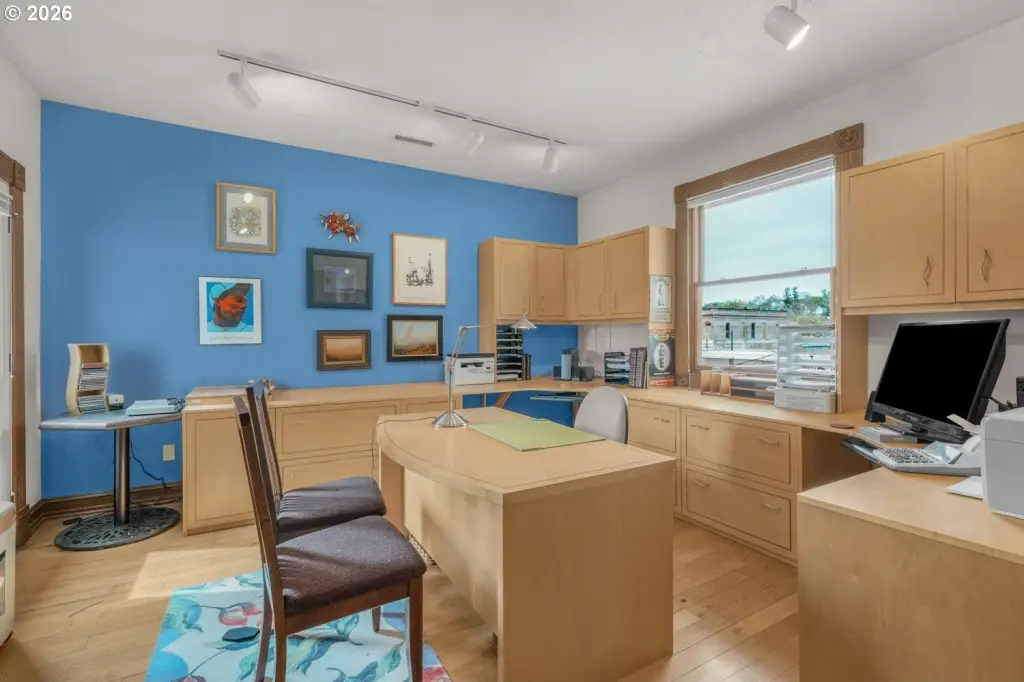
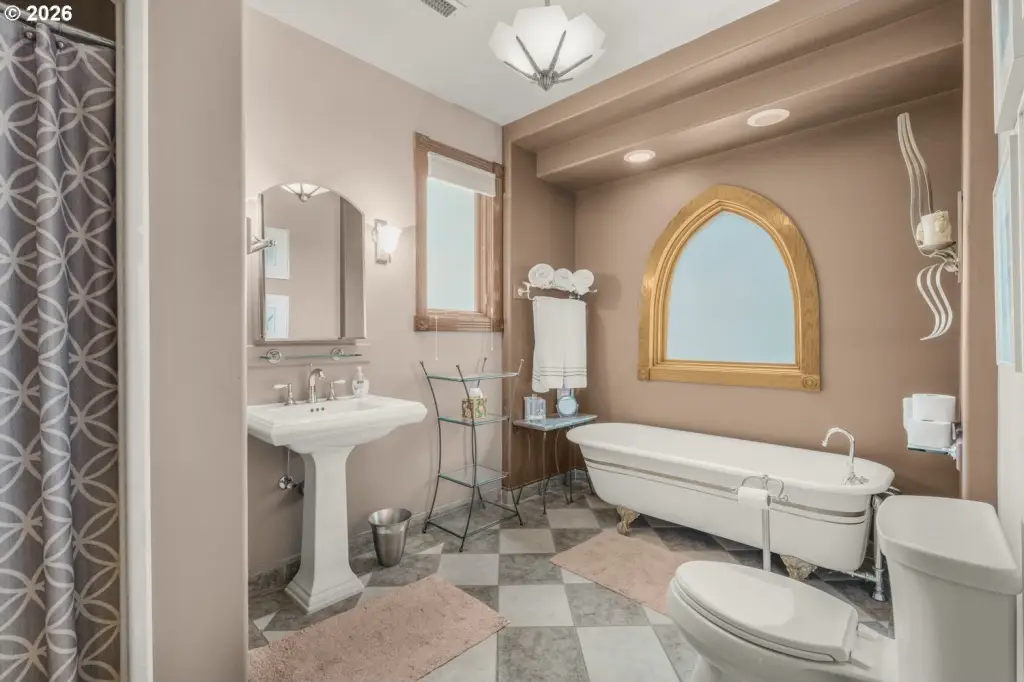
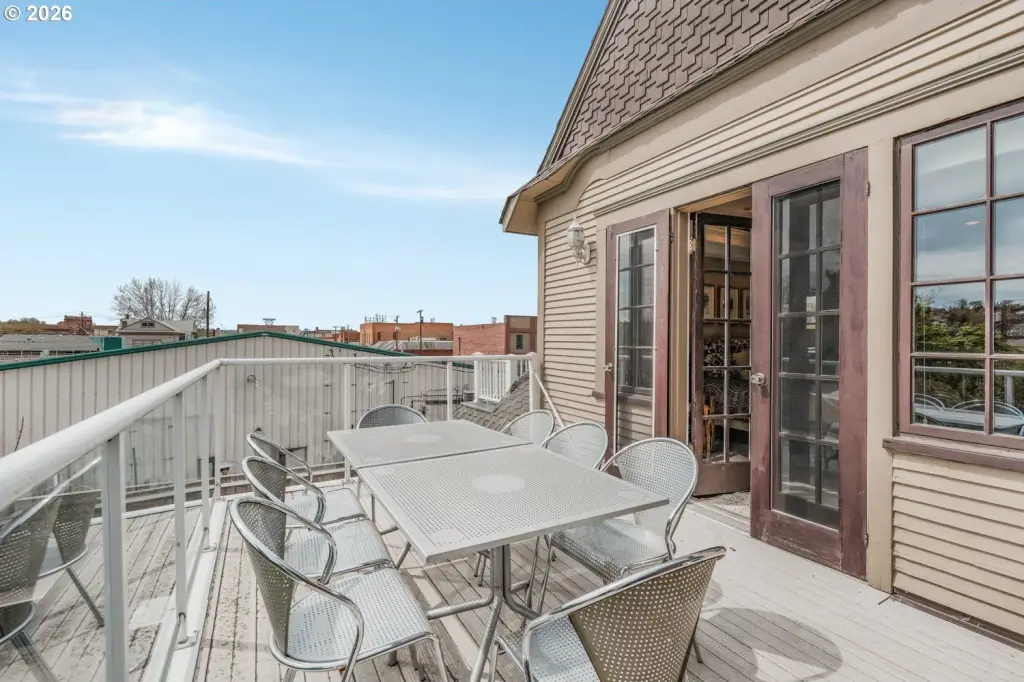
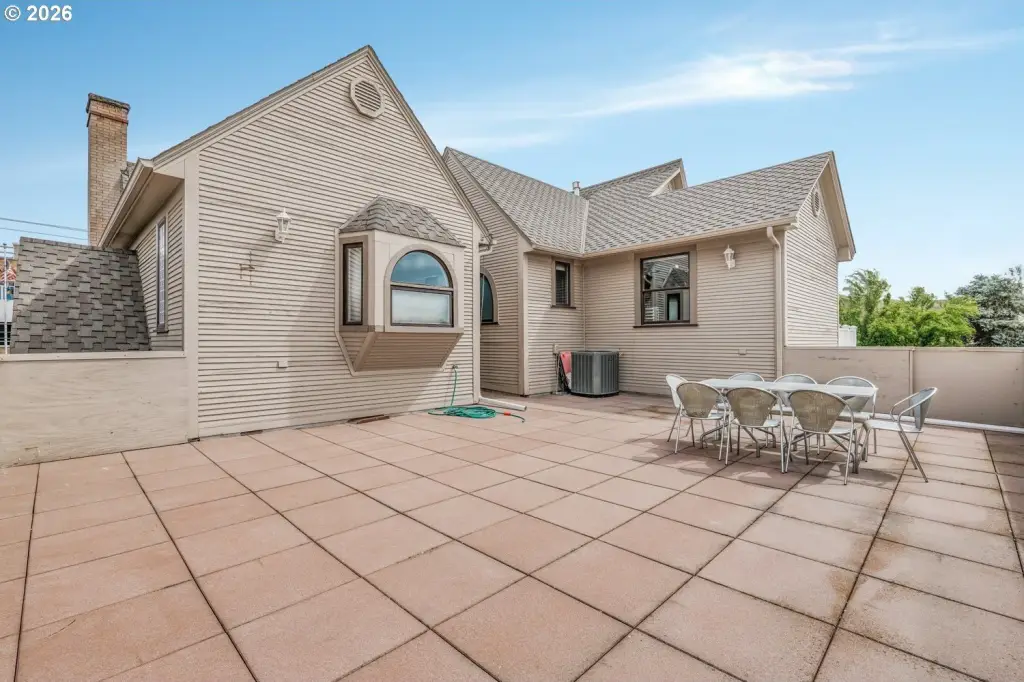
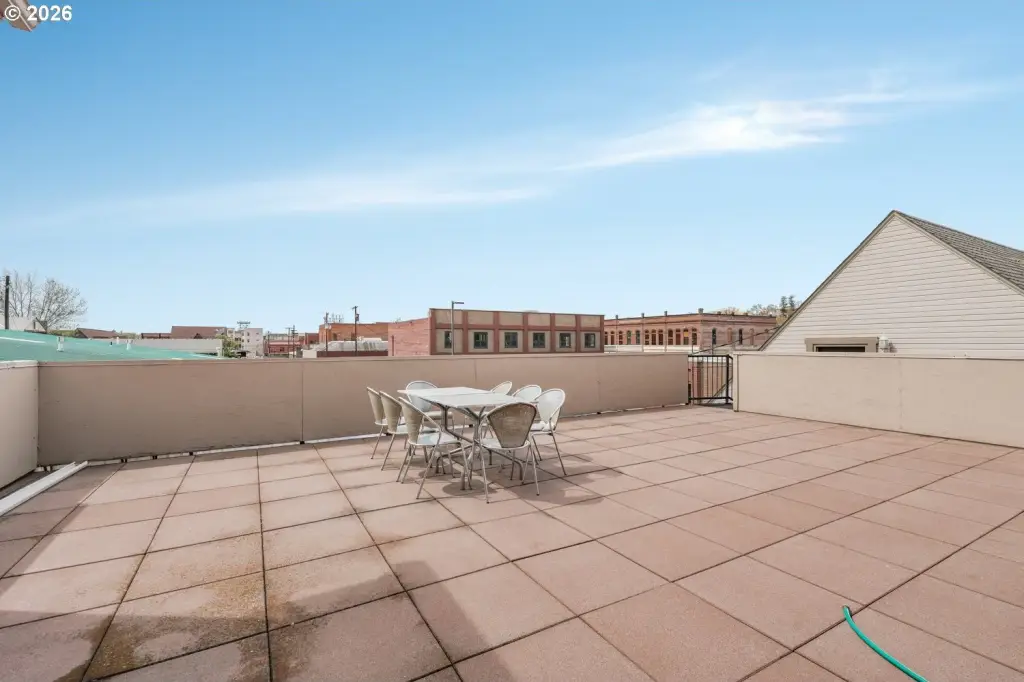
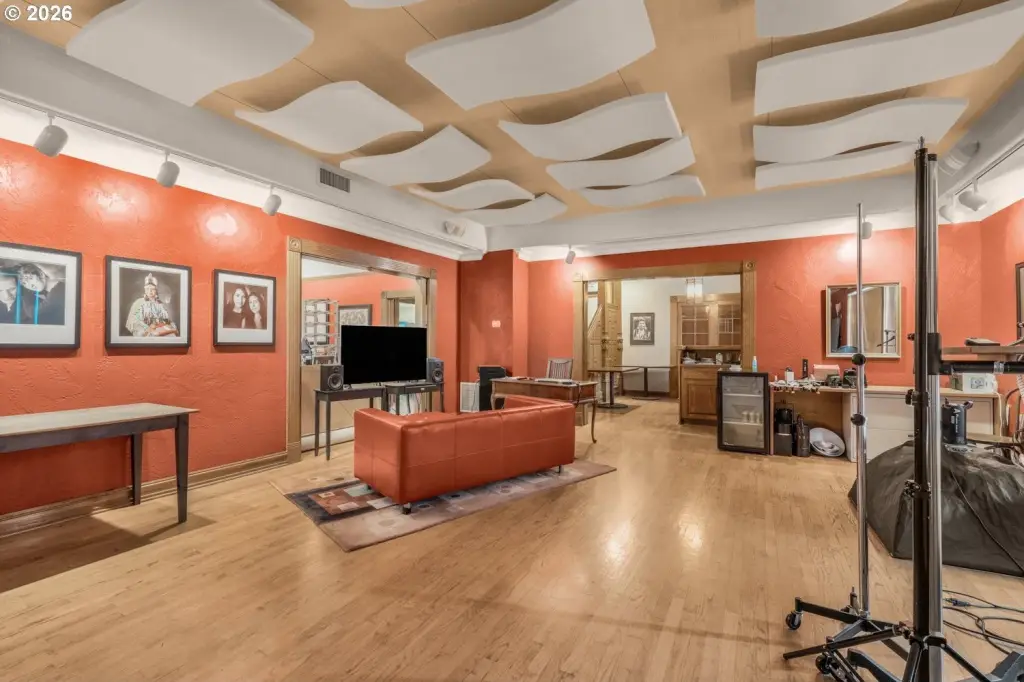
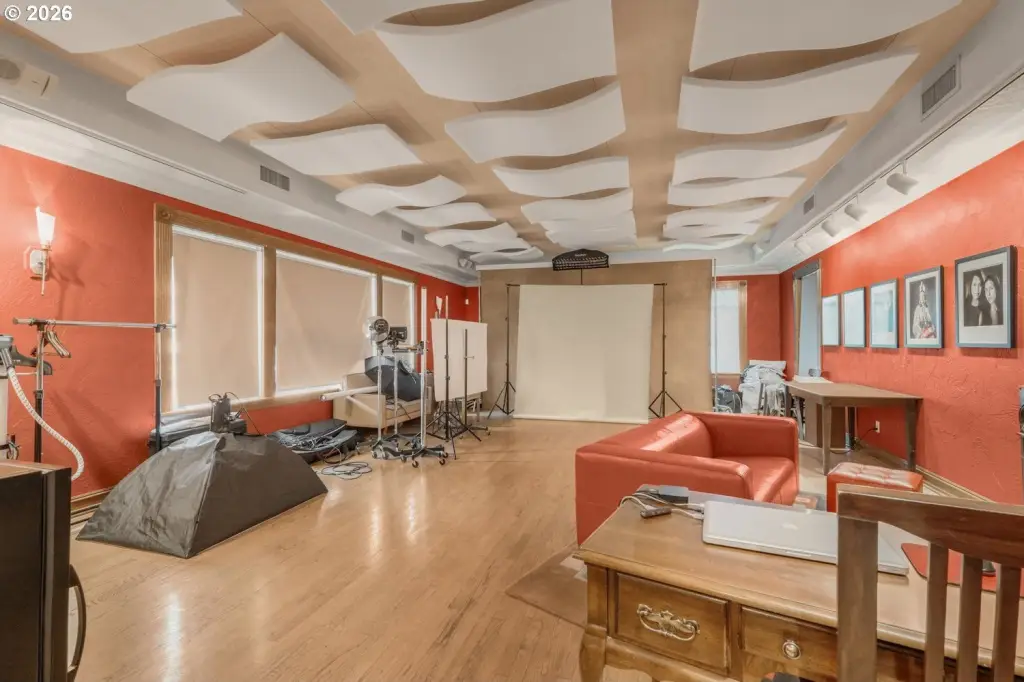
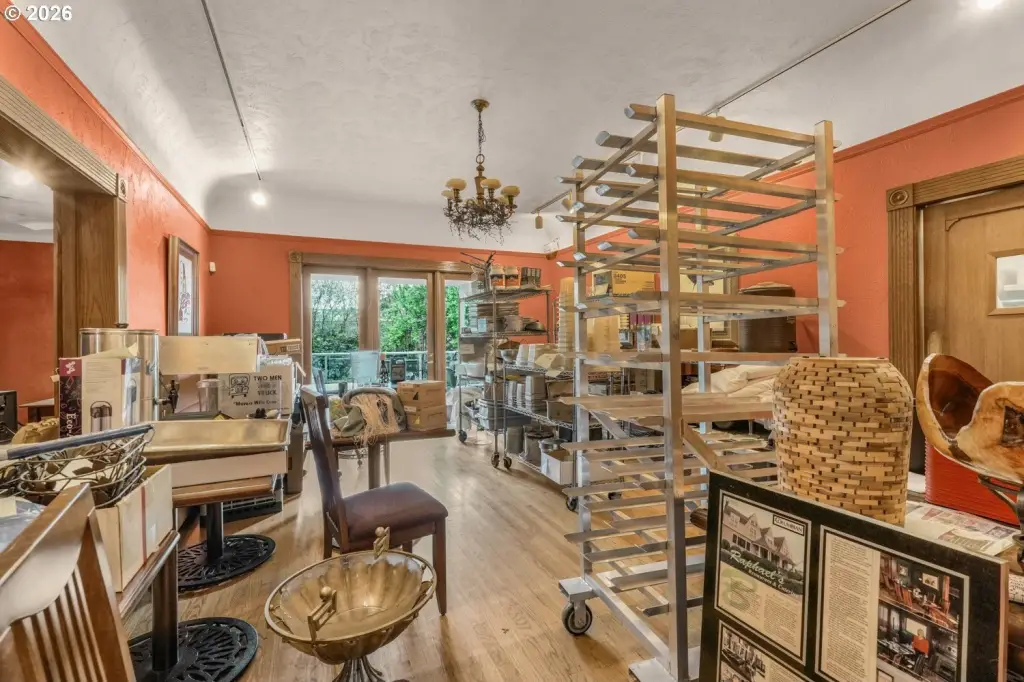
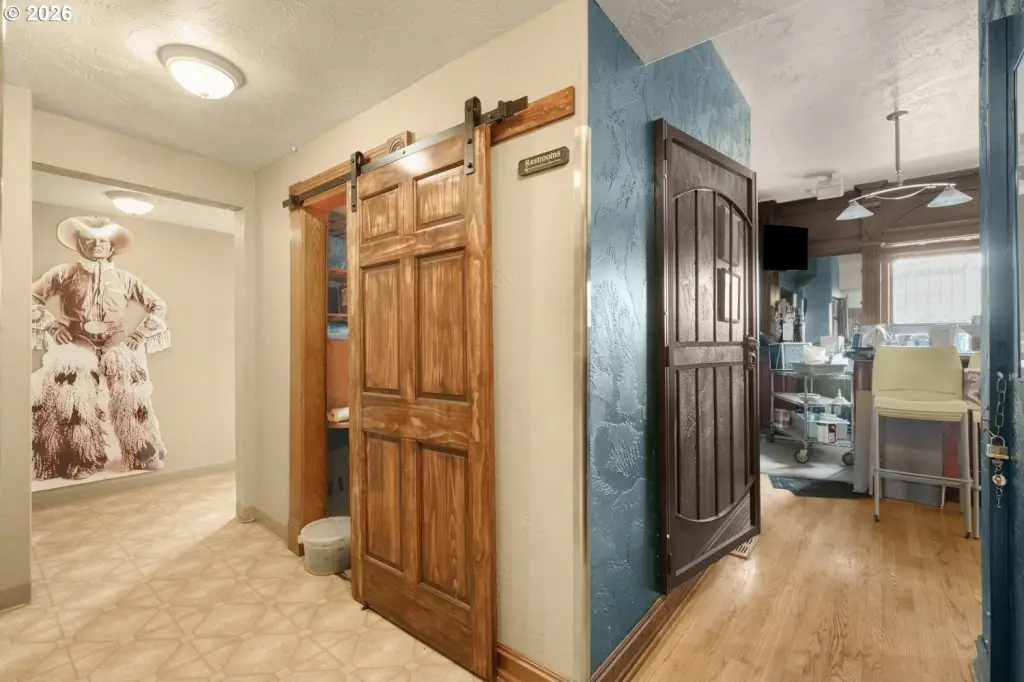
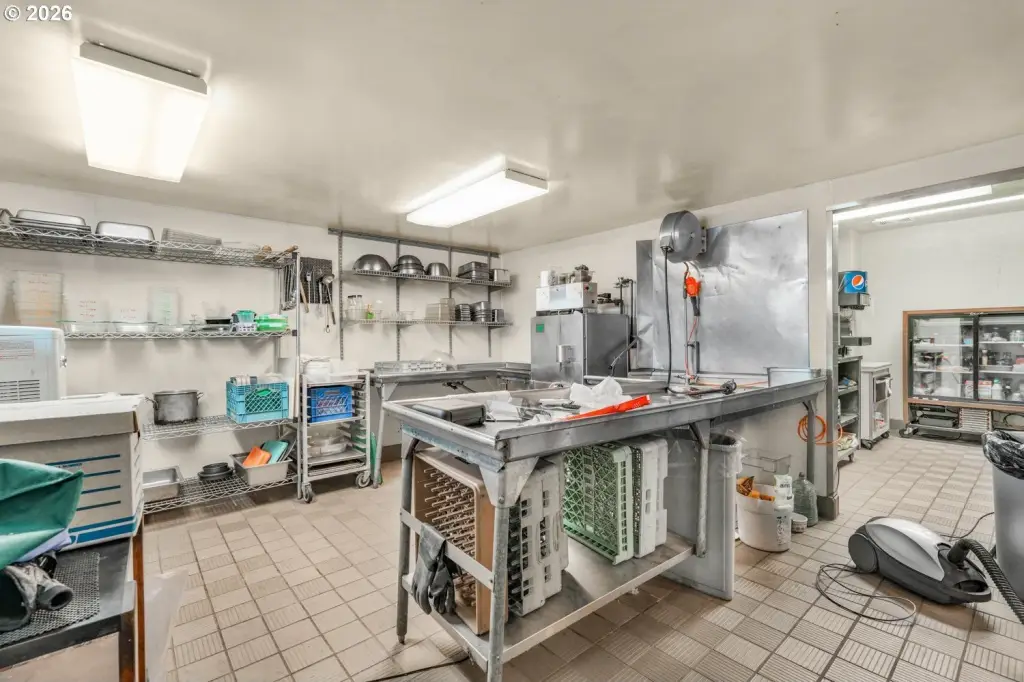
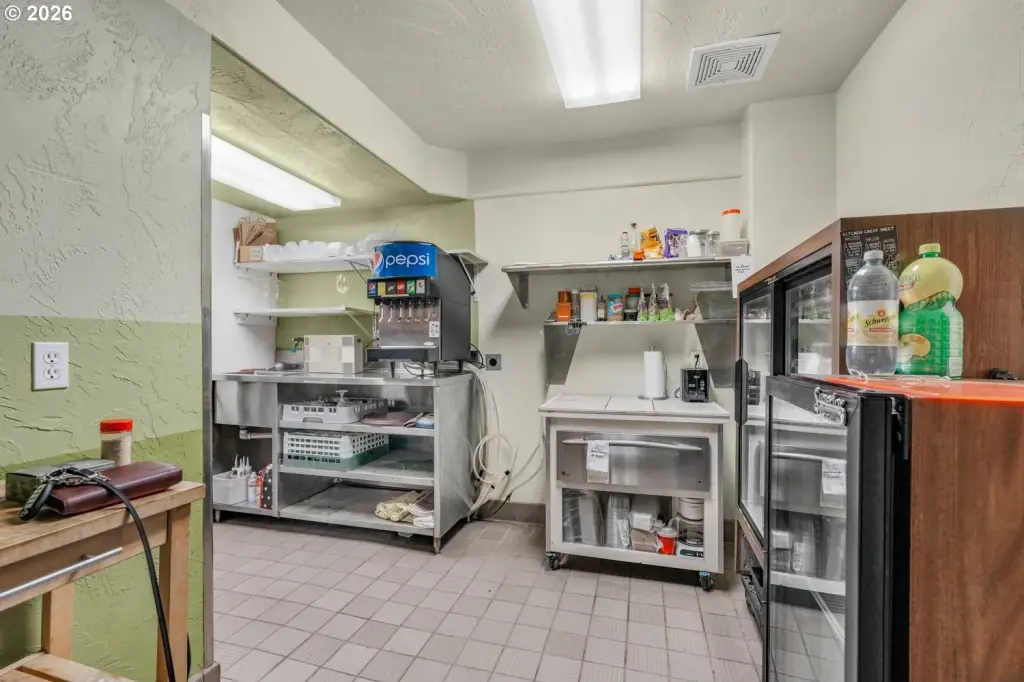
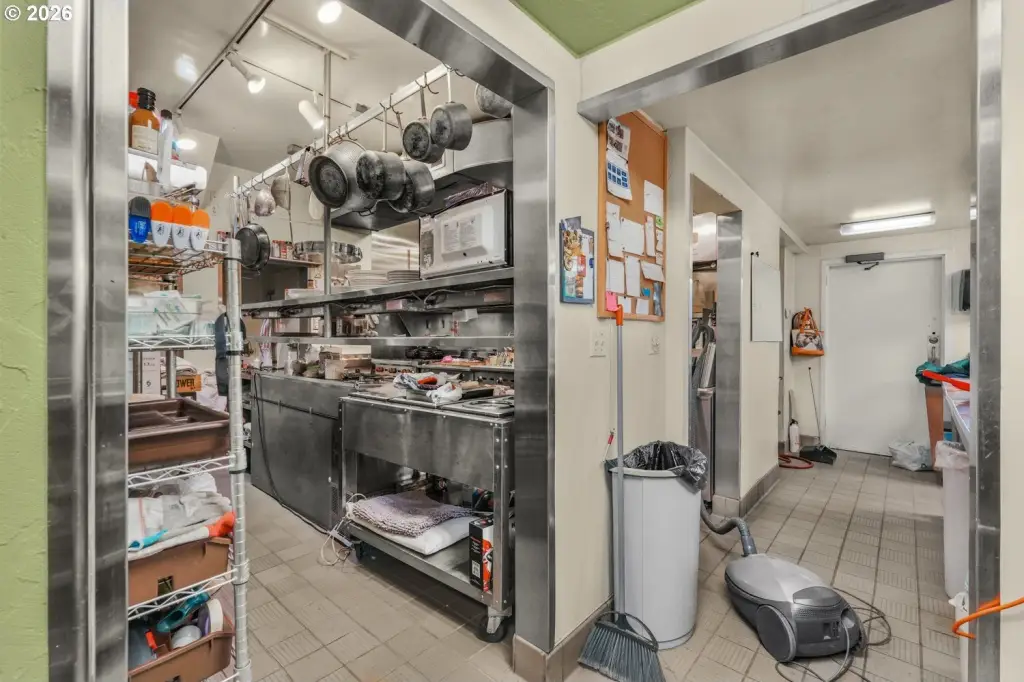
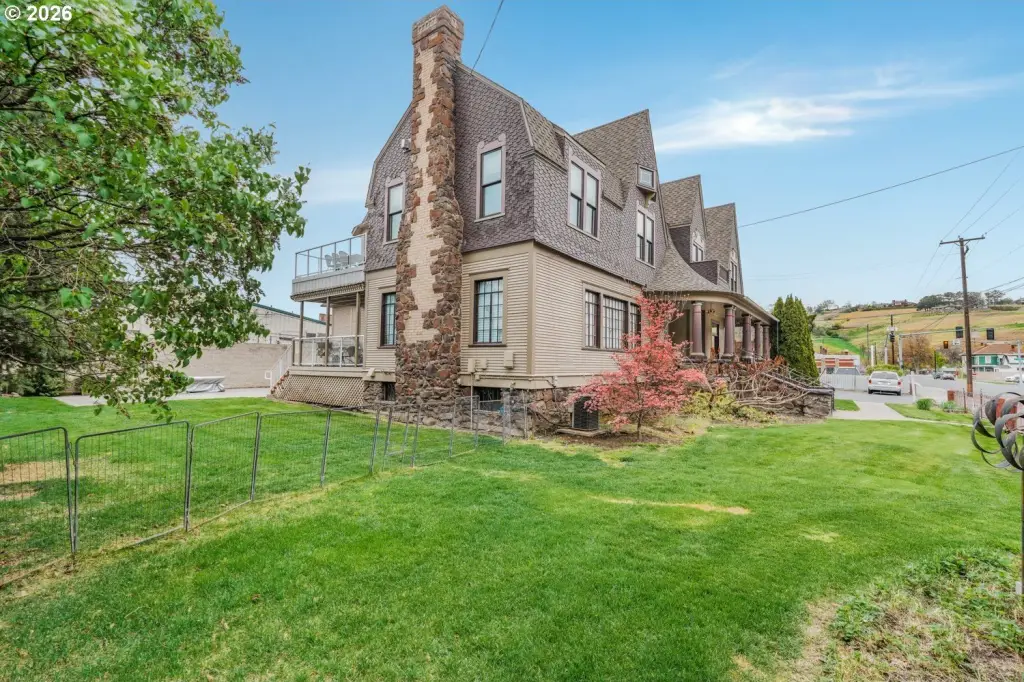
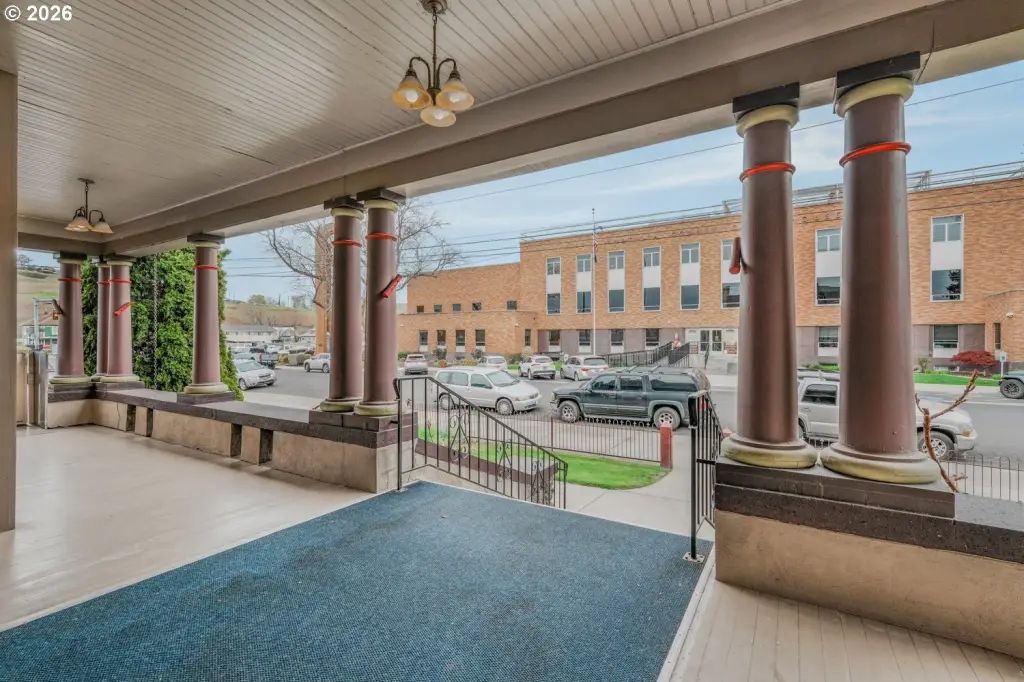
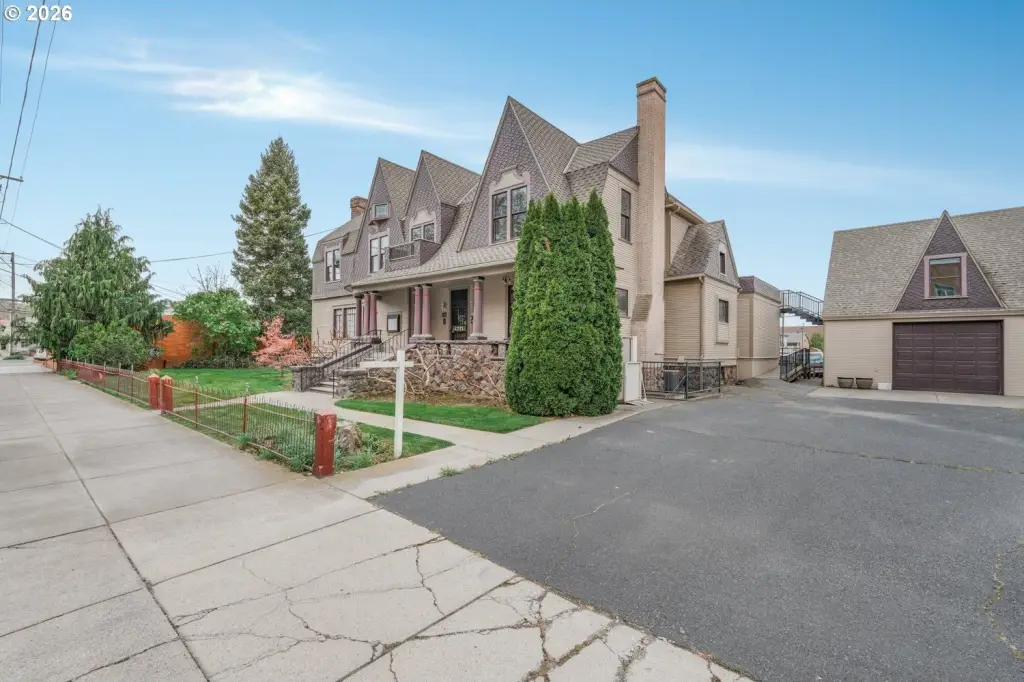
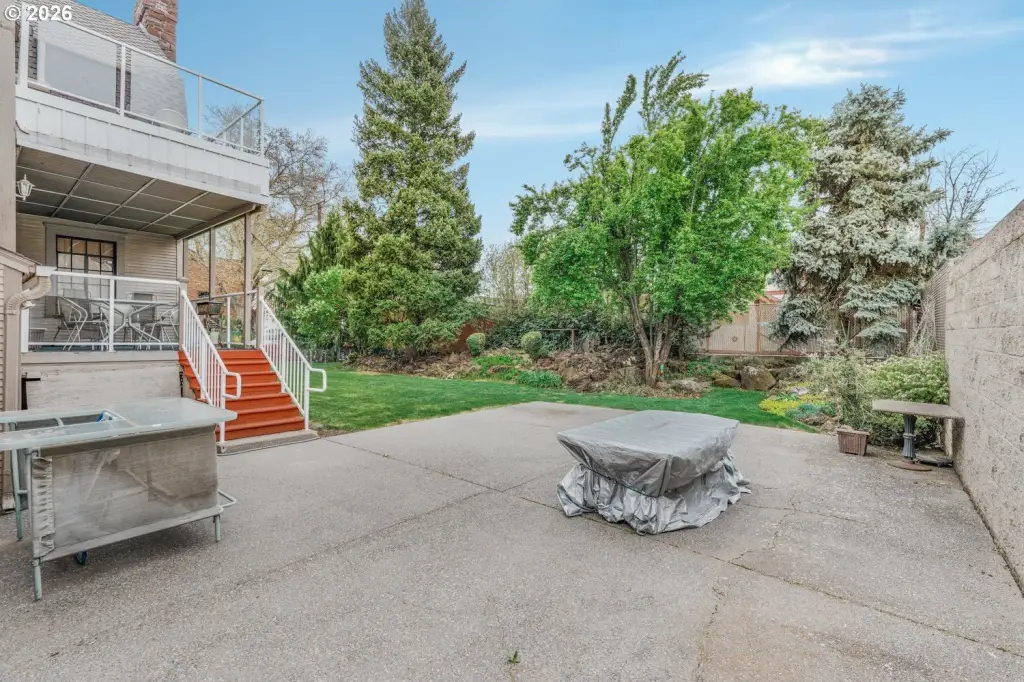
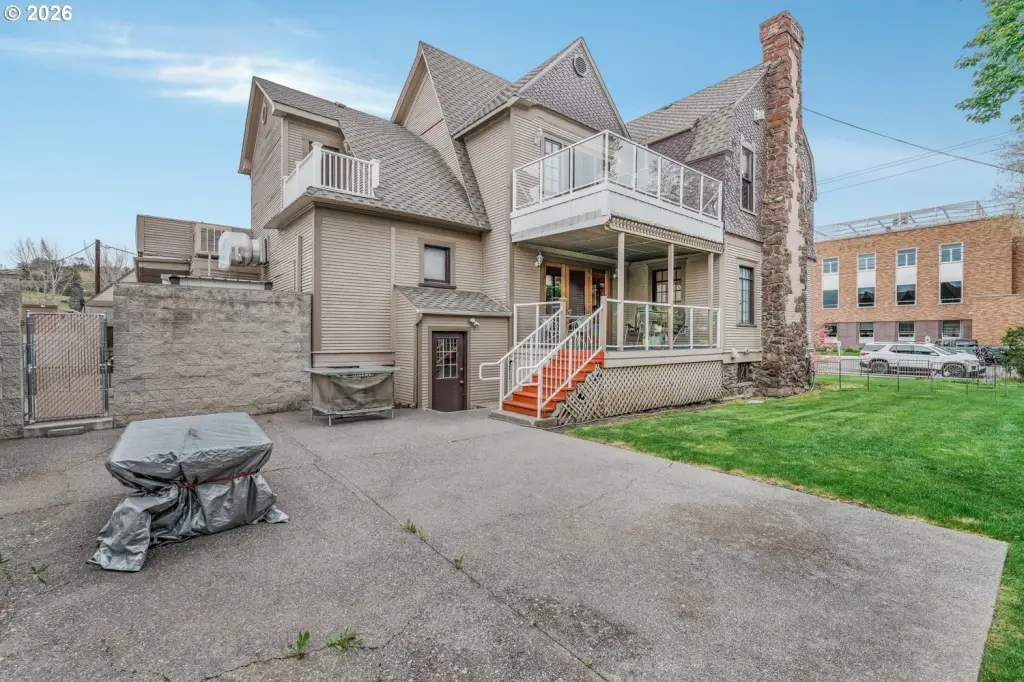
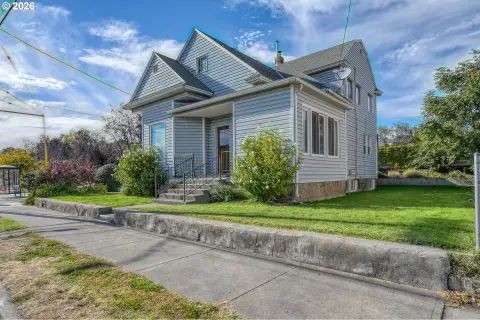
Built in 1904, this 9,177-square-foot mixed-use property pairs a restaurant-oriented commercial level with an upper-floor residential or hospitality configuration. The commercial space includes a full kitchen, beverage pantry, wait station, dish room, dining areas, bar, and patio. The upper level contains four bedrooms, two bathrooms, a living room, office, kitchenette, laundry area, and multiple private decks. Original oak millwork, carved casings, period fireplaces, and updated finishes contribute to the building’s character. Forced-air heating and central air conditioning serve the property.
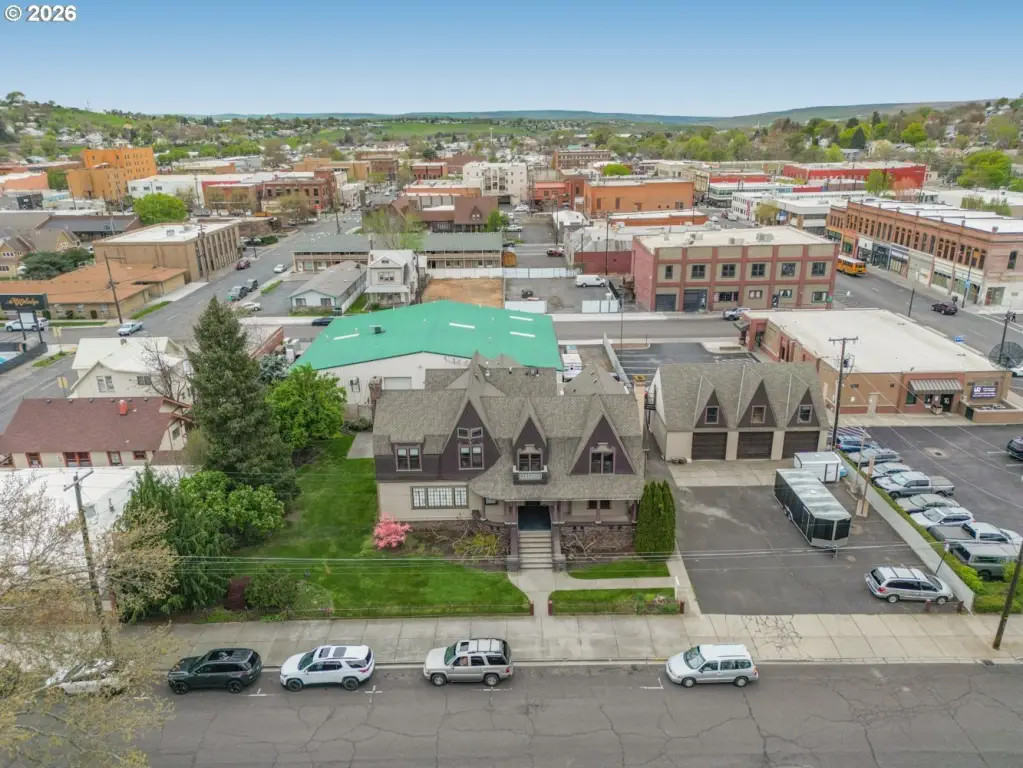
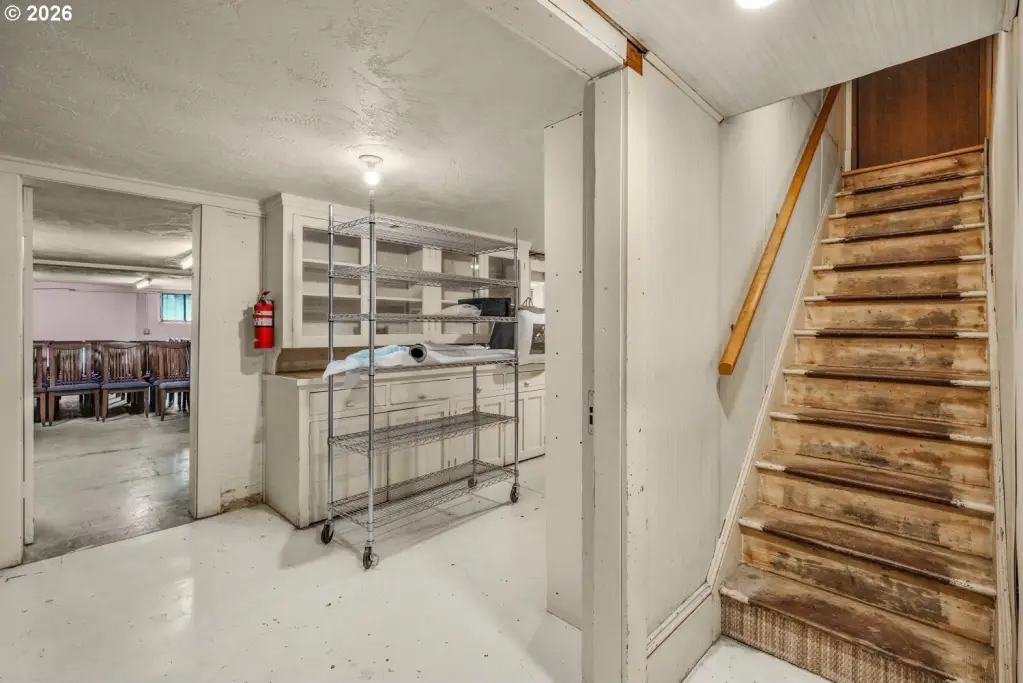
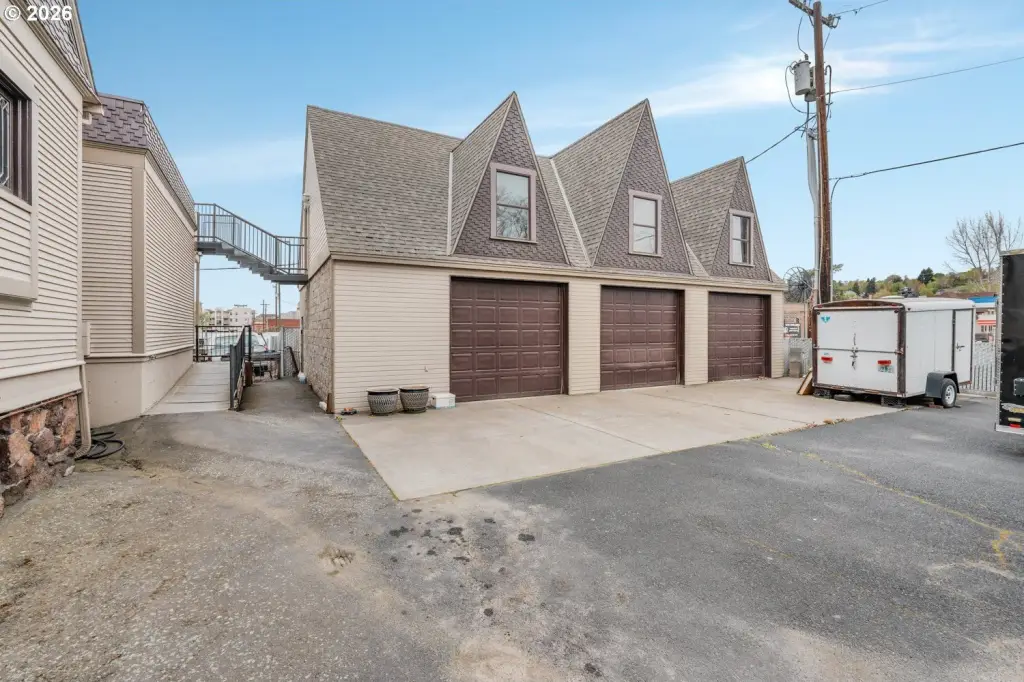
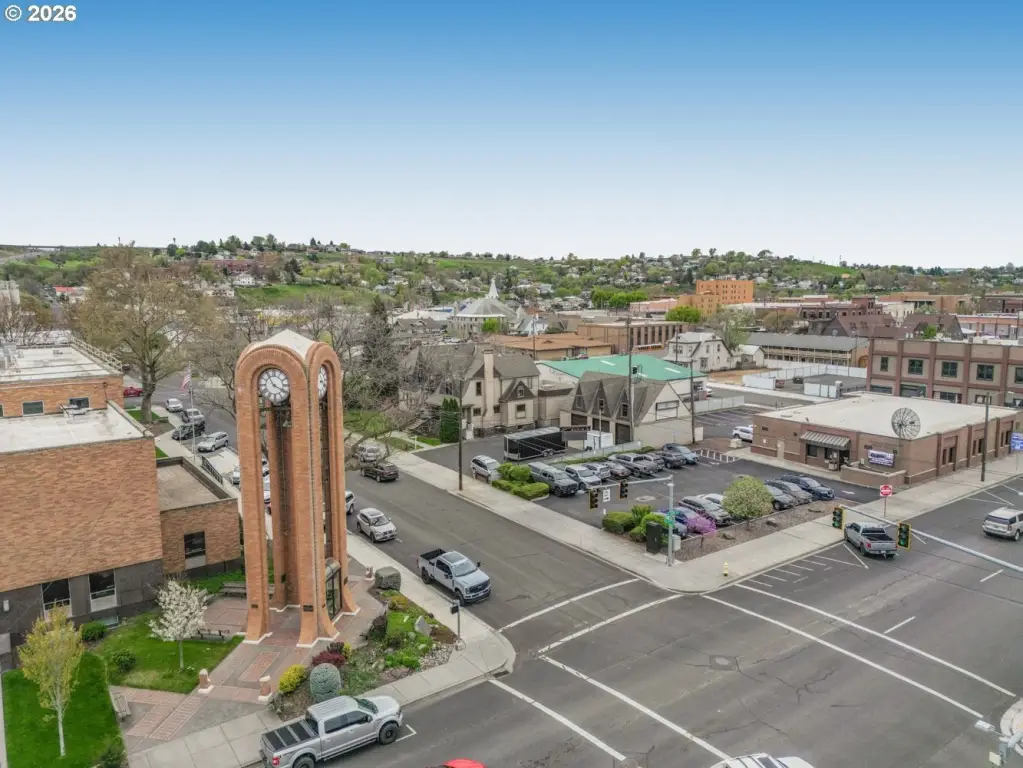
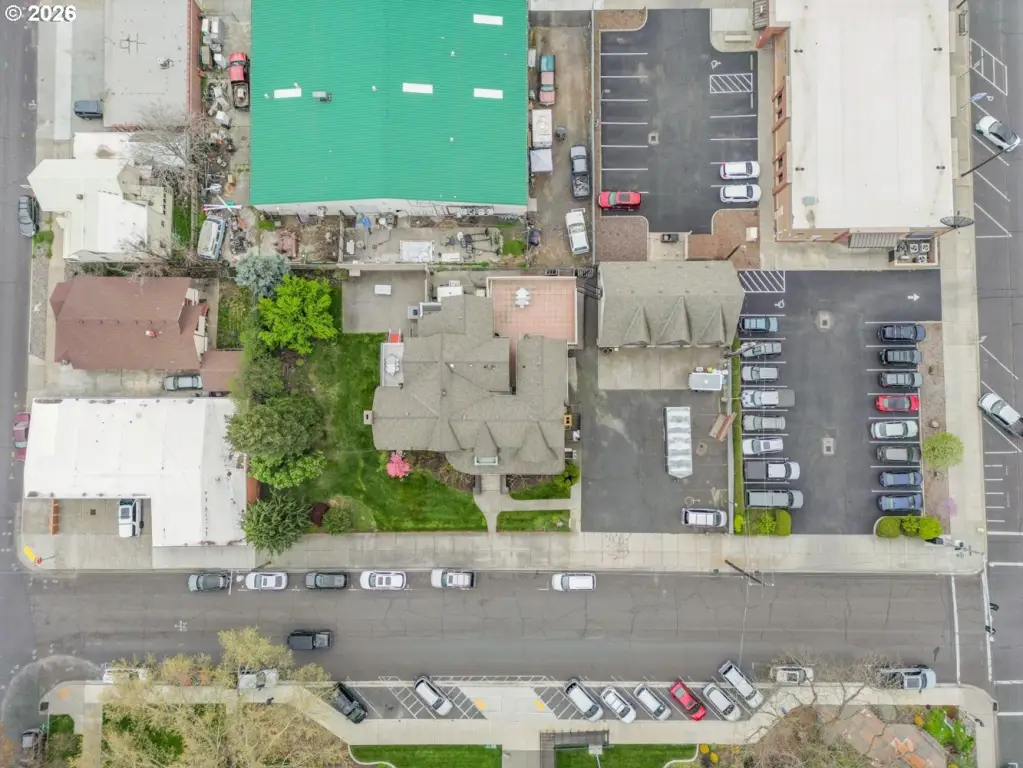
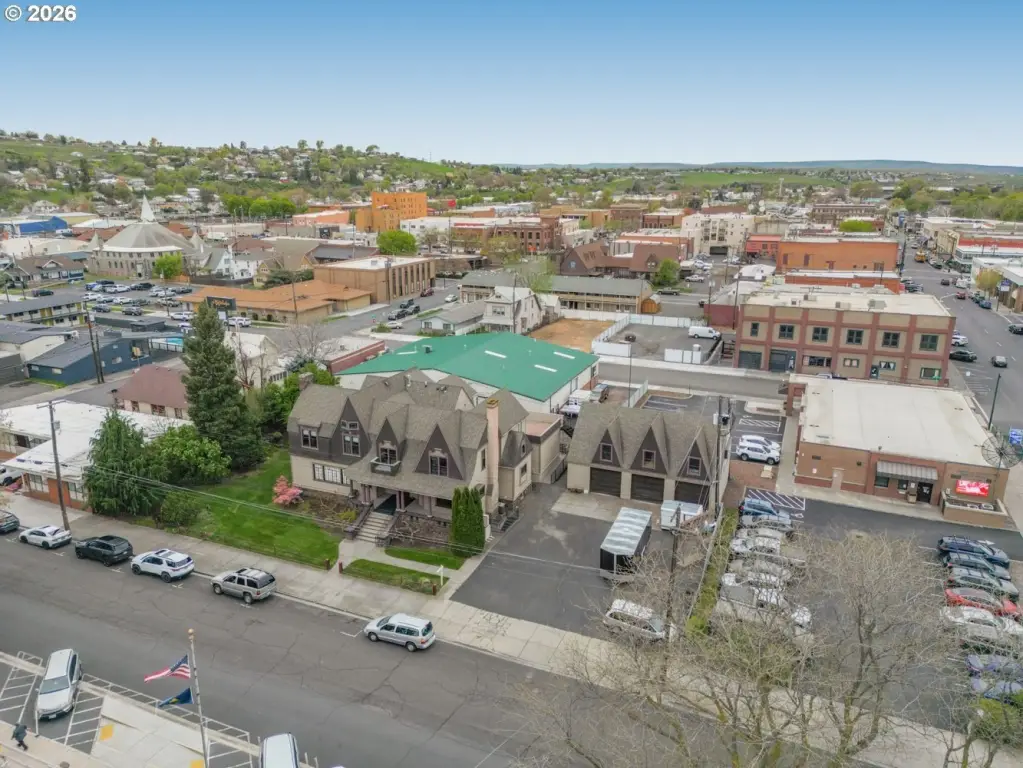
The property is located at 233 SE 4TH St in Pendleton, Oregon, near Main Street. The site encompasses 0.4 acres and includes a dedicated parking lot plus a 1,380-square-foot garage. C1 zoning, a full basement, and shingle and composition roofing are also part of the property configuration.
The property is located at 233 SE 4TH St in Pendleton, Oregon, near Main Street. The site encompasses 0.4 acres and includes a dedicated parking lot plus a 1,380-square-foot garage. C1 zoning, a full basement, and shingle and composition roofing are also part of the property configuration.
Key Highlights
- 9,177‑square‑foot mixed‑use building constructed in 1904
- Commercial level includes full kitchen, beverage pantry, wait station, dish room, dining areas, and bar
- Upper level has four bedrooms, two bathrooms, living room, office, kitchenette, and laundry
Financial Insights
Estimated NOI and Cap Rate
NOI / Yr
$57,213
Cap Rate
6.39%
Suggested Prices Based on Cap Rates
Cap Rate 5%
$1,144,260
$1.1M
Cap Rate 7%
$817,329
$817.3K
Cap Rate 9%
$635,700
$635.7K
Market Conditions
NOI Build-Up for 9,177 SF
Gross rent
$137.7K $15.00/SF
− Vacancy
−$17.2K −$1.88/SF
EGI
$120.4K $13.13/SF
− OpEx
−$63.2K −$6.89/SF
NOI
$57.2K $6.23/SF
Area
Umatilla County, OR
Vacancy
12.50%
Lease Rate
$15.00 /SF/Yr
Expense Ratio
52.50%
Simulate Cap Rate and NOI
Suggested Prices Based on Cap Rates
Cap Rate 5%
$1,144,260
Cap Rate 7%
$817,329
Cap Rate 9%
$635,700
Alternative Uses
Best Use
Specialty Retail
$1.48M
$1.29M – $1.72M
NOI $103,477 @ 7.0% cap · market cap 11.56%
Second Best
Mixed Use
$1.36M
$1.19M – $1.58M
NOI $94,982 @ 7.0% cap · market cap 10.61%
Theoretical Best
Office A
$1.92M
$1.68M – $2.24M
NOI $134,475 @ 7.0% cap · market cap 15.03%
Zoning and permitted uses should be independently verified with authorities.
Property Analytics
Unlock full access to Insights
Subscribe to Realmo Intelligence
Open Analytics
Current Use
Location Intelligence
Trade Area within ½ mile
964
Businesses Nearby
Explore this area
Business Placement
Demographics for 97801, OR
21,882
Population
9,033
Households
2.4
Avg Household Size
39
Median Age
26%
College-Educated
92%
High-School Grad
496.2 sq mi
ZIP Area
44
Density / Sq Mi
$73,308
Median Household Income
$38,719
Median Earnings
$924
Median Rent
$277,600
Median Home Value
Check the figures for this property
Cap Rate, Value Estimation, Potential NOI and more
View Realmo Analytics
Market
Vacancy Rate% for Multifamily in West region

Questions? Ask Rey
Realmo’s AI knows this listing — price, zoning, demand, history. Ask anything.





Frequently Asked Questions
What type of property is this?
Mixed-use property - A 1904 building combines restaurant facilities with four-bedroom residential quarters and outdoor dining areas.
Where is this mixed-use property located?
The property is located at 233 SE 4TH St Pendleton, OR.
What is the asking price?
The asking price for this property is $895,000.
What are key features of this property?
This property features: 9,177‑square‑foot mixed‑use building constructed in 1904; Commercial level includes full kitchen, beverage pantry, wait station, dish room, dining areas, and bar; Upper level has four bedrooms, two bathrooms, living room, office, kitchenette, and laundry


