5-Unit Apartment Building with
For Sale
$1,595,000
Pending
231 E Hyde Park Blvd, Inglewood, CA 90302
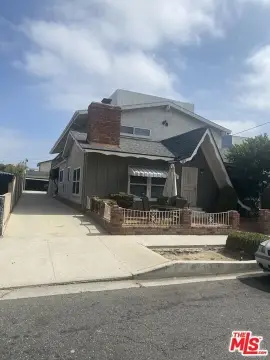
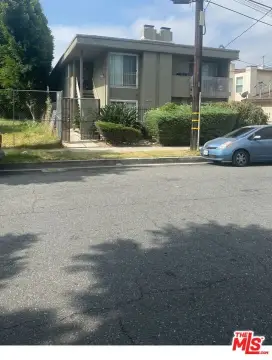
Well-maintained apartment property with updated interiors, varied unit layouts, and a flexible owner-user or rental configuration.
Property Size4,229 SF
Days on Market66
Property Features for 231 E Hyde Park Blvd
General Information
Standard status
Pending
Size
4,229 SF
Property subtype
MULTI_FAMILY
Site & Location
Neighborhood
Centinela Heights
Units
Unit Mix
1 x 1BR+1BA+Den, 1 x 2BR+2BA, 1 x 3BR+2BA, 2 x 2BR+1BA
Multifamily Units
5
Building Details
Building Size
4,229 SF
Year Built
1990
Listing Agency:
The Agency
Listed By:
Marcus Kassin · License #01216904
(310) 948-1915
Source:
Evecap
Added: Aug 19
Changed: Oct 16
Last Checked: Oct 21 at 3:06AM
Displayed information is deemed reliable but is not guaranteed and should be independently verified. All listing content including descriptions, pricing, images are the copyrighted material of The Agency

Ask AI about this property
Review the available facts, identify missing information and prepare questions for the agent.
Investment Insights
Based on property information with market context.
Built in 1990, this five-unit apartment property combines three original residences with two newer accessory dwelling units. The unit mix includes a 613-square-foot one-bedroom, one-bath unit with a den; a 966-square-foot two-bedroom, two-bath residence with a living-room balcony; and a two-level owner's unit measuring approximately 1,532 square feet with three bedrooms, two bathrooms, a primary-suite balcony, and rooftop deck access. Each ADU provides two bedrooms and one bathroom.
Four residences are occupied and one is vacant, providing an existing rental component alongside flexibility for an owner-user. Interior improvements include newer kitchens and bathrooms, updated flooring, appliances, and other property enhancements. The building also has 100% copper plumbing and is positioned near Ladera Heights and Hyde Park, approximately 2 miles north of SoFi Stadium, 3 blocks east of La Brea Avenue, and 2 blocks south of Centinela Avenue.
Four residences are occupied and one is vacant, providing an existing rental component alongside flexibility for an owner-user. Interior improvements include newer kitchens and bathrooms, updated flooring, appliances, and other property enhancements. The building also has 100% copper plumbing and is positioned near Ladera Heights and Hyde Park, approximately 2 miles north of SoFi Stadium, 3 blocks east of La Brea Avenue, and 2 blocks south of Centinela Avenue.
Key Highlights
- Five total units: three original residences plus two newer ADUs
- Unit mix includes 3Br+2Ba owner's unit, 2Br+2Ba unit, 1Br+1Ba+Den unit, and two 2Br+1Ba ADUs
- Owner's unit spans approximately 1,532 SF over two levels and includes a rooftop deck
Financial Insights
Estimated NOI and Cap Rate
NOI / Yr
$52,383
Cap Rate
3.28%
Suggested Prices Based on Cap Rates
Cap Rate 5%
$1,047,660
$1.0M
Cap Rate 7%
$748,329
$748.3K
Cap Rate 9%
$582,033
$582.0K
Market Conditions
NOI Build-Up for 4,229 SF
Gross rent
$95.9K $22.68/SF
− Vacancy
−$671 −$0.16/SF
EGI
$95.2K $22.52/SF
− OpEx
−$42.9K −$10.13/SF
NOI
$52.4K $12.39/SF
Area
Inglewood, CA
Vacancy
0.70%
Lease Rate
$22.68 /SF/Yr
Expense Ratio
45.00%
Simulate Cap Rate and NOI
Suggested Prices Based on Cap Rates
Cap Rate 5%
$1,047,660
Cap Rate 7%
$748,329
Cap Rate 9%
$582,033
Alternative Uses
Best Use
Apartment 5plus
$748.3K
$654.8K – $873.1K
NOI $52,383 @ 7.0% cap · market cap 3.28%
Second Best
—
—
no second resolved use
Theoretical Best
Office A
$1.73M
$1.51M – $2.01M
NOI $120,780 @ 7.0% cap · market cap 7.57%
Zoning and permitted uses should be independently verified with authorities.
How Realmo checks its estimates
Property Analytics
Contact the owner directly
Get the owner's phone numbers and email
Open Analytics
Lease Details
5
Residential units
Location Intelligence
Trade Area within ½ mile
1,569
Businesses Nearby
Explore this area
Business Placement
Demographics for 90302, CA
29,264
Population
11,366
Households
2.6
Avg Household Size
36
Median Age
30%
College-Educated
81%
High-School Grad
1.9 sq mi
ZIP Area
15,402
Density / Sq Mi
$72,461
Median Household Income
$37,675
Median Earnings
$1,784
Median Rent
$731,300
Median Home Value
Check the figures for this property
Cap Rate, Value Estimation, Potential NOI and more
View Realmo Analytics
Market
Vacancy Rate% for Multifamily in West region






Frequently Asked Questions
What type of property is this?
Apartment building - Well-maintained apartment property with updated interiors, varied unit layouts, and a flexible owner-user or rental configuration.
Where is this apartment building located?
The property is located at 231 E Hyde Park Blvd Inglewood, CA.
What is the asking price?
The asking price for this property is $1,595,000.
What are key features of this property?
This property features: Five total units: three original residences plus two newer ADUs; Unit mix includes 3Br+2Ba owner's unit, 2Br+2Ba unit, 1Br+1Ba+Den unit, and two 2Br+1Ba ADUs; Owner's unit spans approximately 1,532 SF over two levels and includes a rooftop deck


