Midland Flex Space For
For Sale
Contact for pricing
2308 W Front St, Midland, TX 79701
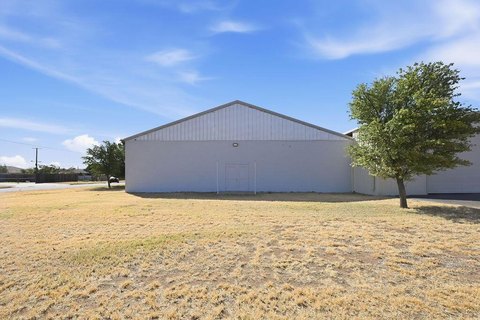
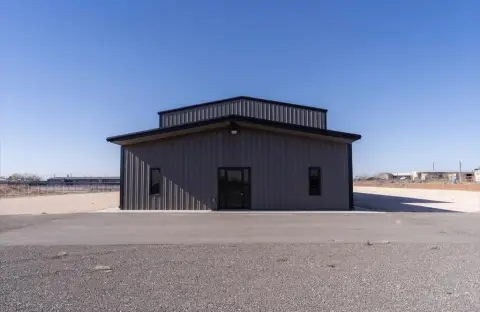
6,720 SF flex space on 0.31 acres.
Property Size6,720 SF
Lot Size0.31 Acres
Price / SF$104.17
Days on Market252
Property Features for 2308 W Front St
General Information
Standard status
Active
Size
6,720 SF
Lot size
0.31 Acres
Property subtype
Industrial
Zoning
C3
Building Details
Year Built
1972
Listing Agency:
Marcus & Millichap - Dallas
Listed By:
Adam Abushagur · License #TX 661916
(972) 755-5200
Source:
Crexi
Added: Feb 4
Changed: Aug 24
Last Checked: Aug 14 at 6:05AM
Displayed information is deemed reliable but is not guaranteed and should be independently verified. All listing content including descriptions, pricing, images are the copyrighted material of Marcus & Millichap - Dallas
Investment Insights
Based on property information with market context.
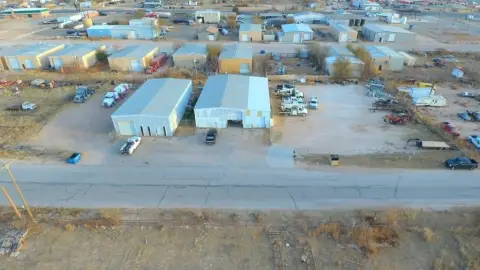
The property at 2308 West Front Street in Midland, Texas, is a 6,720-square-foot flex space situated on 0.31 acres. The single-tenant asset features tilt-wall construction and one grade-level door. The property has frontage along Front Street and proximity to Interstate 20, the main corridor connecting Midland to Odessa. The tenant, Coco Bananas, specializes in women’s contemporary apparel, accessories, and gifts and has been in business since 2015. Coco Bananas was voted Best in the Basin in 2025 and awarded the Gold Boutique of Midland by the Midland Reporter-Telegram. The tenant is signed to a triple net lease at $11.00 per square foot that expires at the start of September 2029.
Key Highlights
- Triple net lease in place at $11.00 per square foot, expiring September 2029.
- Located on Front Street with proximity to Interstate 20, a major transportation corridor.
- Single‑tenant property leased to Coco Bananas, an established business since 2015.
Financial Insights
Estimated NOI and Cap Rate
NOI / Yr
$60,278
Cap Rate
8.61%
Suggested Prices Based on Cap Rates
Cap Rate 5%
$1,205,560
$1.2M
Cap Rate 7%
$861,114
$861.1K
Cap Rate 9%
$669,756
$669.8K
Market Conditions
NOI Build-Up for 6,720 SF
Gross rent
$91.1K $13.56/SF
− Vacancy
−$5.0K −$0.75/SF
EGI
$86.1K $12.81/SF
− OpEx
−$25.8K −$3.84/SF
NOI
$60.3K $8.97/SF
Area
Midland, TX
Vacancy
5.50%
Lease Rate
$13.56 /SF/Yr
Expense Ratio
30.00%
Simulate Cap Rate and NOI
Suggested Prices Based on Cap Rates
Cap Rate 5%
$1,205,560
Cap Rate 7%
$861,114
Cap Rate 9%
$669,756
Alternative Uses
Best Use
Industrial
$861.1K
$753.5K – $1.00M
NOI $60,278 @ 7.0% cap · market cap 8.61%
Second Best
Flex RnD
$844.6K
$739.1K – $985.4K
NOI $59,125 @ 7.0% cap · market cap 8.45%
Theoretical Best
Office A
$1.59M
$1.39M – $1.85M
NOI $110,961 @ 7.0% cap · market cap 15.85%
Zoning and permitted uses should be independently verified with authorities.
How Realmo checks its estimates
Property Analytics
Unlock full access to Insights
Subscribe to Realmo Intelligence
Open Analytics
Current Use
Location Intelligence
Trade Area within ½ mile
616
Businesses Nearby
Under-served
Demand for This Use
Explore this area
Business Placement
Demographics for 79701, TX
29,748
Population
11,393
Households
2.6
Avg Household Size
33
Median Age
19%
College-Educated
73%
High-School Grad
12.1 sq mi
ZIP Area
2,459
Density / Sq Mi
$57,679
Median Household Income
$36,213
Median Earnings
$1,336
Median Rent
$204,000
Median Home Value
Check the figures for this property
Cap Rate, Value Estimation, Potential NOI and more
View Realmo Analytics
Market
Vacancy Rate% for Industrial in South region

Questions? Ask Rey
Realmo’s AI knows this listing — price, zoning, demand, history. Ask anything.







Frequently Asked Questions
What type of property is this?
Flex space - 6,720 SF flex space on 0.31 acres.
Where is this flex space located?
The property is located at 2308 W Front St Midland, TX.
What is the asking price?
The asking price for this property is $700,000.
What are key features of this property?
This property features: Triple net lease in place at $11.00 per square foot, expiring September 2029.; Located on Front Street with proximity to Interstate 20, a major transportation corridor.; Single‑tenant property leased to Coco Bananas, an established business since 2015.