Fully Occupied
For Sale
$310,000
2302-2304 Aberdeen Drive, Tyler, TX 75703
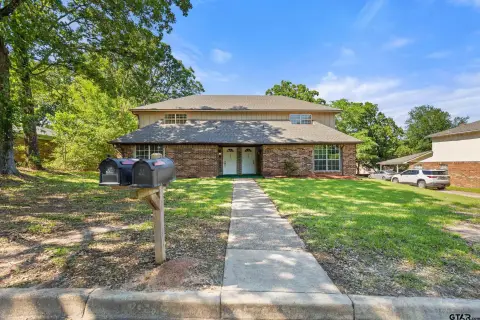
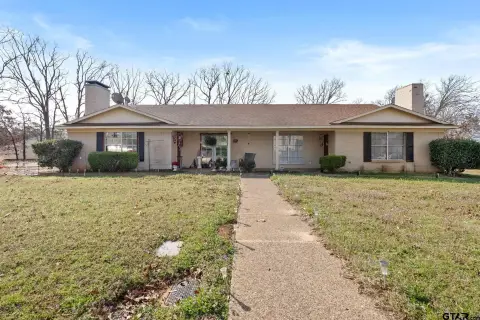
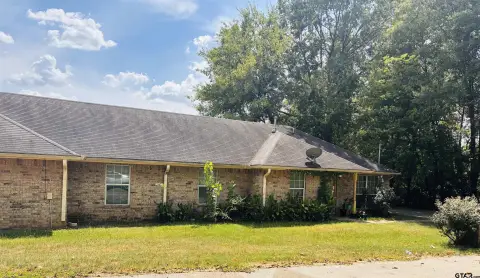
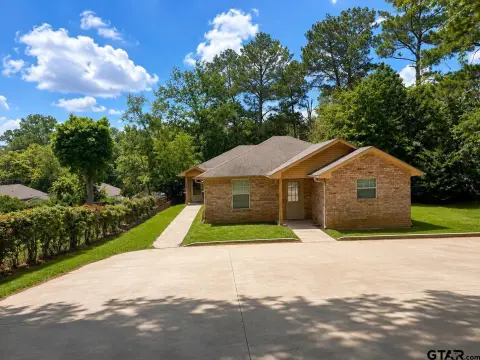
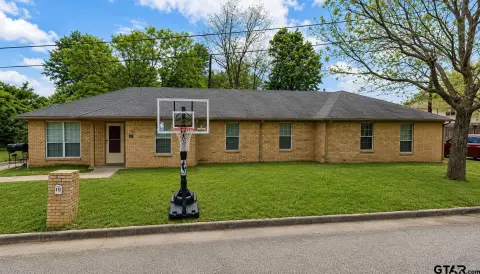
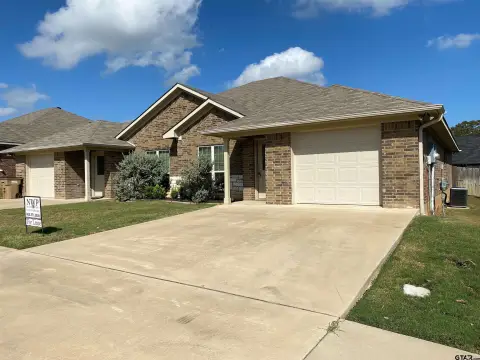
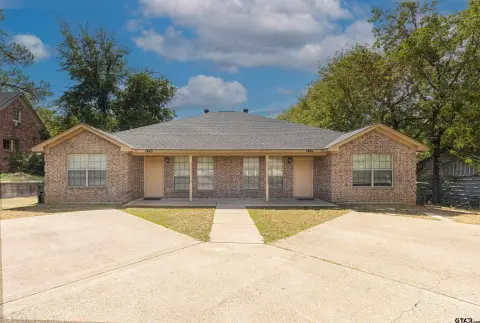
Two three-bedroom units offer practical layouts with bedrooms and full bathrooms on the main level.
Property Size3,020 SF
Price / SF$102.65
Days on Market179
Property Features for 2302-2304 Aberdeen Drive
General Information
Standard status
Active
Size
3,020 SF
Property subtype
Residential Income / Duplex
Occupancy
100%
Units
Unit Mix
2 x 3BR/2BA
Multifamily Units
2
Amenities
Central Electric
Central
Wood Burning
Lake
Building Details
Year Built
1976
Buildings
1
Listing Agency:
Leslie Cain Realty
Listed By:
Kenneth Sheppa · License #0701586
(903) 217-6168
Source:
Compass
Added: Apr 24
Changed: Oct 16
Last Checked: Oct 16 at 10:47AM
Displayed information is deemed reliable but is not guaranteed and should be independently verified. All listing content including descriptions, pricing, images are the copyrighted material of Leslie Cain Realty

Ask AI about this property
Review the available facts, identify missing information and prepare questions for the agent.
Investment Insights
Based on property information with market context.
This 3,020-square-foot duplex, built in 1976, contains two units with three bedrooms and two full bathrooms each. Both residences include a bedroom and full bathroom on the main level, along with more than 1,500 square feet per unit. The property is fully occupied and features central electric, central gas, wood-burning fireplaces, slab construction, and wood-frame construction.
The property is located in Tyler near TJC, downtown, shopping, dining, and the hospital district. It is zoned Residential Townhouse and is available individually or as part of a package with 2226/2228 Aberdeen, which would combine two duplexes and four units.
The property is located in Tyler near TJC, downtown, shopping, dining, and the hospital district. It is zoned Residential Townhouse and is available individually or as part of a package with 2226/2228 Aberdeen, which would combine two duplexes and four units.
Key Highlights
- Fully occupied duplex with 2 three‑bedroom, two‑bathroom units
- 3,020 SF total; each unit offers more than 1,500 square feet
- Main‑level bedroom and full bathroom in each unit
Financial Insights
Estimated NOI and Cap Rate
NOI / Yr
$27,277
Cap Rate
8.80%
Suggested Prices Based on Cap Rates
Cap Rate 5%
$545,540
$545.5K
Cap Rate 7%
$389,671
$389.7K
Cap Rate 9%
$303,078
$303.1K
Market Conditions
NOI Build-Up for 3,020 SF
Gross rent
$41.7K $13.80/SF
− Vacancy
−$2.7K −$0.90/SF
EGI
$39.0K $12.90/SF
− OpEx
−$11.7K −$3.87/SF
NOI
$27.3K $9.03/SF
Area
Tyler, TX
Vacancy
6.50%
Lease Rate
$13.80 /SF/Yr
Expense Ratio
30.00%
Simulate Cap Rate and NOI
Suggested Prices Based on Cap Rates
Cap Rate 5%
$545,540
Cap Rate 7%
$389,671
Cap Rate 9%
$303,078
Alternative Uses
Best Use
Multifamily LT 5
$389.7K
$341.0K – $454.6K
NOI $27,277 @ 7.0% cap · market cap 8.80%
Second Best
Apartment 5plus
$365.2K
$319.5K – $426.1K
NOI $25,563 @ 7.0% cap · market cap 8.25%
Theoretical Best
Office A
$674.1K
$589.8K – $786.4K
NOI $47,184 @ 7.0% cap · market cap 15.22%
Zoning and permitted uses should be independently verified with authorities.
How Realmo checks its estimates
Property Analytics
Lease Details
2
Residential units
100%
Occupancy
Location Intelligence
Trade Area within ½ mile
862
Businesses Nearby
Explore this area
Business Placement
Demographics for 75703, TX
44,428
Population
20,045
Households
2.2
Avg Household Size
39
Median Age
43%
College-Educated
96%
High-School Grad
55.1 sq mi
ZIP Area
806
Density / Sq Mi
$76,347
Median Household Income
$45,301
Median Earnings
$1,262
Median Rent
$310,500
Median Home Value
Market
Vacancy Rate% for Multifamily in South region


Frequently Asked Questions
What type of property is this?
Duplex - Two three-bedroom units offer practical layouts with bedrooms and full bathrooms on the main level.
Where is this duplex located?
The property is located at 2302-2304 Aberdeen Drive Tyler, TX.
What is the asking price?
The asking price for this property is $310,000.
What are key features of this property?
This property features: Fully occupied duplex with 2 three‑bedroom, two‑bathroom units; 3,020 SF total; each unit offers more than 1,500 square feet; Main‑level bedroom and full bathroom in each unit


