Six-Story Mixed-Use Commercial
For Sale
Contact for pricing
226 Fifth Avenue, New York, NY 10001
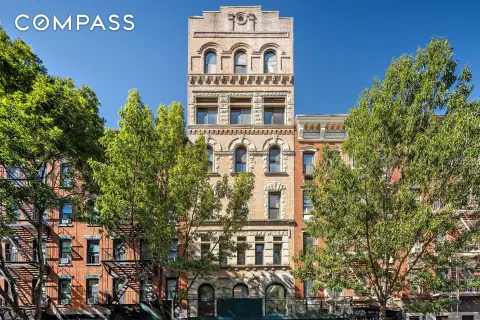
Boutique commercial property with full-floor upper levels and direct elevator access in Manhattan’s NoMad neighborhood.
Property Size13,300 SF
Price / SF$751.88
Days on Market55
Property Features for 226 Fifth Avenue
General Information
Standard status
Active
Size
13,300 SF
Net Rentable
13,300 SF
Elevators
Yes
Property subtype
Mixed Use
Zoning
C5-2 / R10
Occupancy
83%
Investment Type
Value Add
Net Operating Income
$413,028
Site & Location
Frontage
22.5 ft
Road Access
Yes
Public Transit
Yes
Building Details
Buildings
1
Stories
6
Units
6
Tenancy
Multi
Listing Agency:
Cushman & Wakefield New York
Listed By:
John Ciraulo · License #NY 10301211304
(212) 660-7700
Source:
Crexi
Added: Aug 24
Changed: Oct 3
Last Checked: Oct 16 at 8:55AM
Displayed information is deemed reliable but is not guaranteed and should be independently verified. All listing content including descriptions, pricing, images are the copyrighted material of Cushman & Wakefield New York

Ask AI about this property
Review the available facts, identify missing information and prepare questions for the agent.
Investment Insights
Based on property information with market context.
Located at 226 Fifth Avenue in Manhattan’s NoMad neighborhood, this six-story commercial building includes a cellar and 13,300 rentable square feet. The property combines street-level retail with upper-floor commercial space, offering a compact vertical format suited to office, showroom, service, and other commercial uses supported by the existing configuration. Direct elevator access serves the upper floors, which are arranged as five full-floor spaces.
The ground floor and lower level total 5,000 RSF and are leased to Rezo Salon through November 2026. The space includes an existing salon buildout and may potentially be delivered vacant at lease expiration. Upper-floor occupants include professional, wellness, and service-oriented users. The building presents 22.5 feet of frontage along Fifth Avenue between 26th and 27th Street and is zoned C5-2 / R10.
Subway lines are within a 1–2-minute walk, with additional access to PATH, Penn Station, and regional commuter rail. The property sits near NoMad, Flatiron, Union Square, Chelsea, and Madison Square Park.
The ground floor and lower level total 5,000 RSF and are leased to Rezo Salon through November 2026. The space includes an existing salon buildout and may potentially be delivered vacant at lease expiration. Upper-floor occupants include professional, wellness, and service-oriented users. The building presents 22.5 feet of frontage along Fifth Avenue between 26th and 27th Street and is zoned C5-2 / R10.
Subway lines are within a 1–2-minute walk, with additional access to PATH, Penn Station, and regional commuter rail. The property sits near NoMad, Flatiron, Union Square, Chelsea, and Madison Square Park.
Key Highlights
- 13,300 rentable square feet in a six‑story building with cellar
- 22.5 feet of frontage along Fifth Avenue between 26th and 27th Street
- Ground floor and lower level comprise 5,000 RSF leased through November 2026
Financial Insights
Estimated NOI and Cap Rate
NOI / Yr
$423,938
Cap Rate
4.24%
Suggested Prices Based on Cap Rates
Cap Rate 5%
$8,478,760
$8.5M
Cap Rate 7%
$6,056,257
$6.1M
Cap Rate 9%
$4,710,422
$4.7M
Market Conditions
NOI Build-Up for 13,300 SF
Gross rent
$798.0K $60.00/SF
− Vacancy
−$119.7K −$9.00/SF
EGI
$678.3K $51.00/SF
− OpEx
−$254.4K −$19.13/SF
NOI
$423.9K $31.88/SF
Area
New York, NY
Vacancy
15.00%
Lease Rate
$60.00 /SF/Yr
Expense Ratio
37.50%
Simulate Cap Rate and NOI
Suggested Prices Based on Cap Rates
Cap Rate 5%
$8,478,760
Cap Rate 7%
$6,056,257
Cap Rate 9%
$4,710,422
Alternative Uses
Best Use
Retail
$26.74M
$23.40M – $31.19M
NOI $1,871,636 @ 7.0% cap · market cap 18.72%
Second Best
Mixed Use
$6.06M
$5.30M – $7.07M
NOI $423,938 @ 7.0% cap · market cap 4.24%
Theoretical Best
Specialty Retail
$33.11M
$28.97M – $38.62M
NOI $2,317,392 @ 7.0% cap · market cap 23.17%
Zoning and permitted uses should be independently verified with authorities.
How Realmo checks its estimates
Property Analytics
Unlock full access to Insights
Subscribe to Realmo Intelligence
Open Analytics
Current Use
Lease Details
Yes
Paved road access
Location Intelligence
Trade Area within ½ mile
68,613
Businesses Nearby
Explore this area
Business Placement
Demographics for 10001, NY
32,612
Population
17,554
Households
1.9
Avg Household Size
35
Median Age
72%
College-Educated
93%
High-School Grad
0.6 sq mi
ZIP Area
54,353
Density / Sq Mi
$123,393
Median Household Income
$97,848
Median Earnings
$3,024
Median Rent
$793,000
Median Home Value
Check the figures for this property
Cap Rate, Value Estimation, Potential NOI and more
View Realmo Analytics
Market
Vacancy Rate% for Office in Northeast region






Frequently Asked Questions
What type of property is this?
Mixed-use property - Boutique commercial property with full-floor upper levels and direct elevator access in Manhattan’s NoMad neighborhood.
Where is this mixed-use property located?
The property is located at 226 Fifth Avenue New York, NY.
What is the asking price?
The asking price for this property is $10,000,000.
What are key features of this property?
This property features: 13,300 rentable square feet in a six‑story building with cellar; 22.5 feet of frontage along Fifth Avenue between 26th and 27th Street; Ground floor and lower level comprise 5,000 RSF leased through November 2026


