Mixed-Use Property With 11
For Sale
$14,250,000
123 Mulberry St, New York, NY 10013
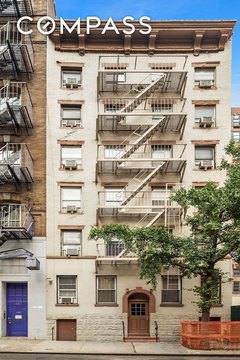
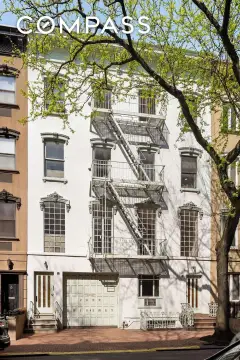
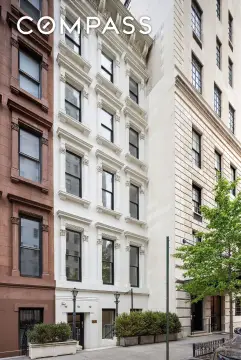
Two protected tax-class buildings combine residential occupancy with a commercial component in Manhattan’s Little Italy District.
Property Size15,109 SF
Price / SF$943.15
Days on Market161
Property Features for 123 Mulberry St
General Information
Standard status
Active
Size
15,109 SF
Property subtype
Mixed-Use
Zoning
C6-2G
Occupancy
100%
Additional Details
Multifamily Units
10
Amenities
123-125 Mulberry Street & 186 Hester Street, built in 1910, is an 11-unit mixed-use asset, spanning 15,109 SF.
Tax Class Protected: 2A/2B | Zoning: C6-2G | 90% Fair Market |1 Commercial and 10 Residential units
123-125 Mulberry Street and 186 Hester Street is perfectly positioned between the charm of SoHo, the energy on Chinatown and culture of NoLIta with close proximity to the N,Q,J,Z, and 6 Subway lines.
Building Details
Building Size
15,109 SF
Buildings
2
Units
11
Tenancy
Single
Listing Agency:
New York City Office
Listed By:
Joe Koicim · License #License(s): NY: 10301208718
(212) 430-5147
Source:
Marcusmillichap
Added: May 8
Changed: Oct 9
Last Checked: Oct 14 at 7:38PM
Displayed information is deemed reliable but is not guaranteed and should be independently verified. All listing content including descriptions, pricing, images are the copyrighted material of New York City Office
Investment Insights
Based on property information with market context.
The offering comprises two buildings at 123-125 Mulberry Street and 186 Hester Street, constructed in 1910 and totaling 15,109 square feet. Together, the properties contain 11 units, including 10 residential units and 1 commercial unit, creating a mixed-use configuration within a single offering.
Both properties carry C6-2G zoning and are situated in New York’s Little Italy District. The Mulberry Street building is designated Tax Class 2B Protected, while the Hester Street property is designated Tax Class 2A Protected. The assets are positioned near the northwest corner of Mulberry Street and Hester Street.
Both properties carry C6-2G zoning and are situated in New York’s Little Italy District. The Mulberry Street building is designated Tax Class 2B Protected, while the Hester Street property is designated Tax Class 2A Protected. The assets are positioned near the northwest corner of Mulberry Street and Hester Street.
Key Highlights
- 15,109 square feet across 123‑125 Mulberry Street and 186 Hester Street
- 11 total units: 10 residential and 1 commercial
- C6‑2G zoning in New York’s Little Italy District
Financial Insights
Estimated NOI and Cap Rate
NOI / Yr
$481,599
Cap Rate
3.38%
Suggested Prices Based on Cap Rates
Cap Rate 5%
$9,631,980
$9.6M
Cap Rate 7%
$6,879,986
$6.9M
Cap Rate 9%
$5,351,100
$5.4M
Market Conditions
NOI Build-Up for 15,109 SF
Gross rent
$906.5K $60.00/SF
− Vacancy
−$136.0K −$9.00/SF
EGI
$770.6K $51.00/SF
− OpEx
−$289.0K −$19.13/SF
NOI
$481.6K $31.88/SF
Area
New York, NY
Vacancy
15.00%
Lease Rate
$60.00 /SF/Yr
Expense Ratio
37.50%
Simulate Cap Rate and NOI
Suggested Prices Based on Cap Rates
Cap Rate 5%
$9,631,980
Cap Rate 7%
$6,879,986
Cap Rate 9%
$5,351,100
Alternative Uses
Best Use
Retail
$30.37M
$26.58M – $35.44M
NOI $2,126,207 @ 7.0% cap · market cap 14.92%
Second Best
Mixed Use
$6.88M
$6.02M – $8.03M
NOI $481,599 @ 7.0% cap · market cap 3.38%
Theoretical Best
Specialty Retail
$37.61M
$32.91M – $43.88M
NOI $2,632,592 @ 7.0% cap · market cap 18.47%
Zoning and permitted uses should be independently verified with authorities.
How Realmo checks its estimates
Property Analytics
Unlock full access to Insights
Subscribe to Realmo Intelligence
Open Analytics
Current Use
Lease Details
10
Residential units
Single-tenant
Tenancy
Location Intelligence
Trade Area within ½ mile
36,609
Businesses Nearby
Explore this area
Business Placement
Demographics for 10013, NY
31,042
Population
15,933
Households
1.9
Avg Household Size
36
Median Age
72%
College-Educated
89%
High-School Grad
0.5 sq mi
ZIP Area
62,084
Density / Sq Mi
$159,474
Median Household Income
$92,765
Median Earnings
$2,378
Median Rent
$2,000,001
Median Home Value
Check the figures for this property
Cap Rate, Value Estimation, Potential NOI and more
View Realmo Analytics
Market
Vacancy Rate% for Multifamily in Northeast region

Questions? Ask Rey
Realmo’s AI knows this listing — price, zoning, demand, history. Ask anything.






Frequently Asked Questions
What type of property is this?
Mixed-use property - Two protected tax-class buildings combine residential occupancy with a commercial component in Manhattan’s Little Italy District.
Where is this mixed-use property located?
The property is located at 123 Mulberry St New York, NY.
What is the asking price?
The asking price for this property is $14,250,000.
What are key features of this property?
This property features: 15,109 square feet across 123‑125 Mulberry Street and 186 Hester Street; 11 total units: 10 residential and 1 commercial; C6‑2G zoning in New York’s Little Italy District


