Turnkey Mixed-Use Investment
For Sale
$695,000
2223 FRANKFORD AVENUE, Philadelphia, PA 19125
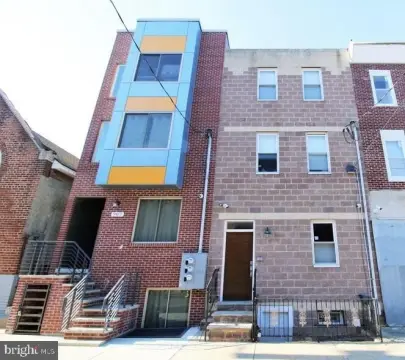
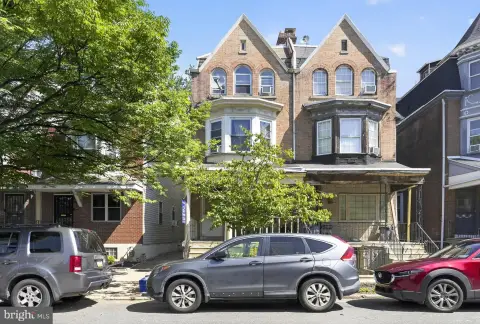
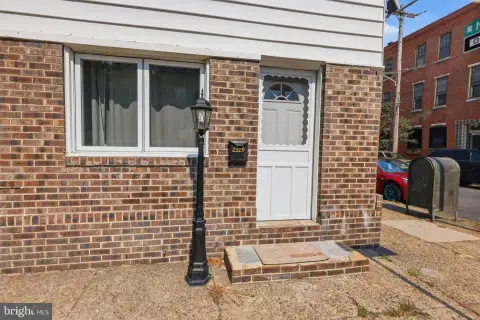
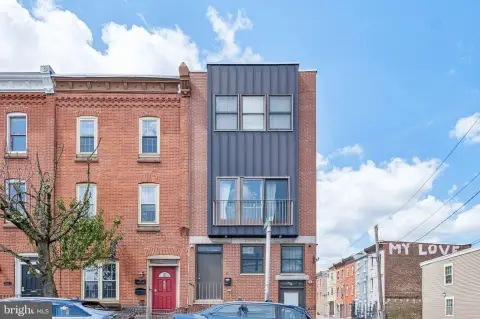
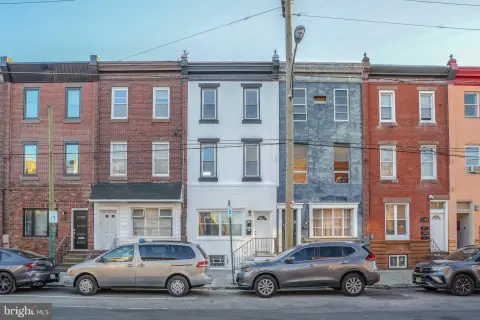
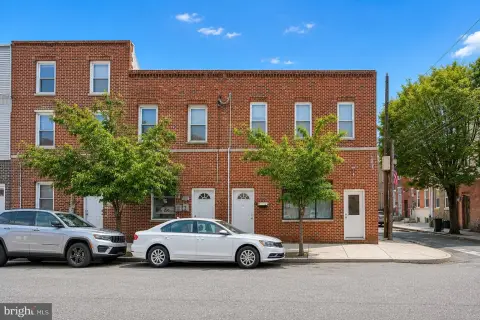
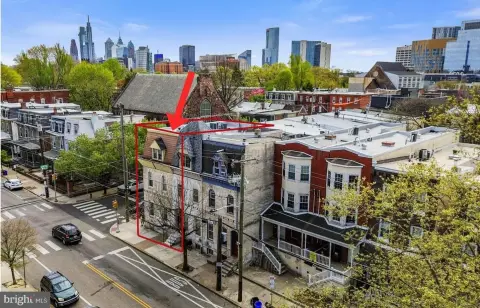
Fully occupied mixed-use property with an operating brewery on NNN lease plus two rented apartments above.
Property Size2,316 SF
Price / SF$300.09
Days on Market102
Property Features for 2223 FRANKFORD AVENUE
General Information
Standard status
Active
Size
2,316 SF
Property subtype
Commercial
Building Details
Year Built
1919
Listing Agency:
Keller Williams Hometown
(856) 241-4343
Listed By:
Heather M Bosco · License #RS357191
(856) 469-3091
Source:
Cummingsrealtors
Added: Jun 29
Changed: Oct 7
Last Checked: Oct 7 at 12:50PM
Displayed information is deemed reliable but is not guaranteed and should be independently verified. All listing content including descriptions, pricing, images are the copyrighted material of Keller Williams Hometown
Investment Insights
Based on property information with market context.
This fully occupied, turnkey mixed-use building includes three units: a brewery tenant on the first floor under a multi-year NNN lease, and two residential apartments above. The second-floor apartment offers two bedrooms and one full bath, and the third-floor unit features one bedroom and one bathroom. The property has been well maintained with numerous updates across both commercial and residential spaces. Recent improvements include a newer roof, exterior paint, brick pointing, concrete front steps, and updated windows, along with interior updates such as carpeting and a new front entry door. A new brewery entrance and additional plumbing and electrical upgrades have been completed in the commercial space, complemented by cosmetic improvements and exposed brick. The basement has also been improved with plumbing and electrical work and a new Bilco door.
The building is located at 2223 Frankford Avenue in Philadelphia and is zoned CMX-2. It is part of the Fishtown Kensington Area Business Improvement District (FKABID). The property also notes low annual real estate taxes of $3,230, supporting an ongoing, cost-conscious operating profile for owners.
For investors seeking stabilized cash flow from existing tenants, the mix of an operating brewery under a multi-year NNN structure and two currently rented apartments provides immediate income. With unit-specific updates—such as kitchen, laundry, lighting, and finish improvements in the third-floor apartment and additional refreshes in the second-floor unit—the property is positioned for straightforward ongoing ownership. Current Gross Annual Income is stated at $56,856.
The building is located at 2223 Frankford Avenue in Philadelphia and is zoned CMX-2. It is part of the Fishtown Kensington Area Business Improvement District (FKABID). The property also notes low annual real estate taxes of $3,230, supporting an ongoing, cost-conscious operating profile for owners.
For investors seeking stabilized cash flow from existing tenants, the mix of an operating brewery under a multi-year NNN structure and two currently rented apartments provides immediate income. With unit-specific updates—such as kitchen, laundry, lighting, and finish improvements in the third-floor apartment and additional refreshes in the second-floor unit—the property is positioned for straightforward ongoing ownership. Current Gross Annual Income is stated at $56,856.
Key Highlights
- Mixed‑use 3‑unit building (commercial + 2 apartments) built in 1919 in Fishtown
- First‑floor brewery tenant, Brewery ARS, operating under a multi‑year NNN lease
- Both upstairs apartments are currently rented: 2BR/1BA on the second floor and 1BR/1BA on the third floor
Financial Insights
Estimated NOI and Cap Rate
NOI / Yr
$36,430
Cap Rate
5.24%
Suggested Prices Based on Cap Rates
Cap Rate 5%
$728,600
$728.6K
Cap Rate 7%
$520,429
$520.4K
Cap Rate 9%
$404,778
$404.8K
Market Conditions
NOI Build-Up for 2,316 SF
Gross rent
$70.3K $30.36/SF
− Vacancy
−$4.1K −$1.76/SF
EGI
$66.2K $28.60/SF
− OpEx
−$29.8K −$12.87/SF
NOI
$36.4K $15.73/SF
Area
Philadelphia, PA
Vacancy
5.80%
Lease Rate
$30.36 /SF/Yr
Expense Ratio
45.00%
Simulate Cap Rate and NOI
Suggested Prices Based on Cap Rates
Cap Rate 5%
$728,600
Cap Rate 7%
$520,429
Cap Rate 9%
$404,778
Alternative Uses
Best Use
Apartment 5plus
$520.4K
$455.4K – $607.2K
NOI $36,430 @ 7.0% cap · market cap 5.24%
Second Best
Mixed Use
$393.1K
$343.9K – $458.6K
NOI $27,514 @ 7.0% cap · market cap 3.96%
Theoretical Best
Multifamily LT 5
$564.6K
$494.0K – $658.7K
NOI $39,522 @ 7.0% cap · market cap 5.69%
Zoning and permitted uses should be independently verified with authorities.
Property Analytics
Unlock full access to Insights
Subscribe to Realmo Intelligence
Open Analytics
Current Use
Location Intelligence
Trade Area within ½ mile
2,781
Businesses Nearby
Explore this area
Business Placement
Demographics for 19125, PA
25,325
Population
13,055
Households
1.9
Avg Household Size
34
Median Age
64%
College-Educated
94%
High-School Grad
1.4 sq mi
ZIP Area
18,089
Density / Sq Mi
$110,842
Median Household Income
$62,656
Median Earnings
$1,743
Median Rent
$373,600
Median Home Value
Check the figures for this property
Cap Rate, Value Estimation, Potential NOI and more
View Realmo Analytics
Market
Vacancy Rate% for Industrial in Philadelphia, PA

Questions? Ask Rey
Realmo’s AI knows this listing — price, zoning, demand, history. Ask anything.



Frequently Asked Questions
What type of property is this?
Brewery - Fully occupied mixed-use property with an operating brewery on NNN lease plus two rented apartments above.
Where is this brewery located?
The property is located at 2223 FRANKFORD AVENUE Philadelphia, PA.
What is the asking price?
The asking price for this property is $695,000.
What are key features of this property?
This property features: Mixed‑use 3‑unit building (commercial + 2 apartments) built in 1919 in Fishtown; First‑floor brewery tenant, Brewery ARS, operating under a multi‑year NNN lease; Both upstairs apartments are currently rented: 2BR/1BA on the second floor and 1BR/1BA on the third floor


