Mixed-Use Property with Event
For Sale
$225,000
2200 JEFFERSON STREET, Baltimore, MD 21205
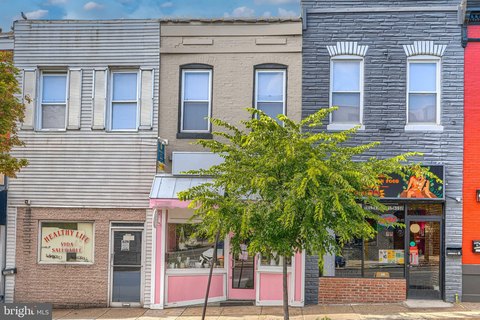
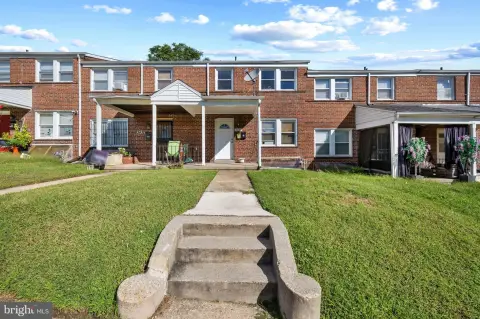
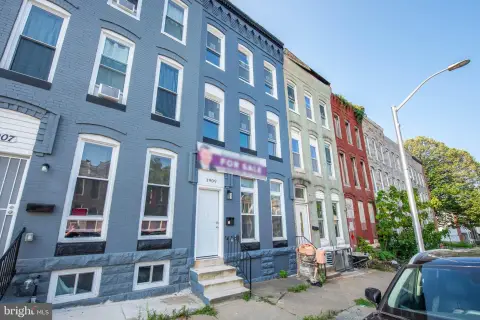
Two-level building combines a vacant commercial area with an occupied two-bedroom dwelling.
Property Size1,400 SF
Days on Market125
Property Features for 2200 JEFFERSON STREET
General Information
Standard status
Active
Size
1,400 SF
Property subtype
Duplex
Taxes and HOA fees
Annual Taxes
$2,313
Building Details
Building Size
1,400 SF
Year Built
1920
Listing Agency:
Everything Real Estate, LLC
Listed By:
John Stockton · License #669972
(410) 660-0013
Source:
Thehulsmangroup
Added: Jun 10
Changed: Oct 8
Last Checked: Oct 11 at 1:59PM
Displayed information is deemed reliable but is not guaranteed and should be independently verified. All listing content including descriptions, pricing, images are the copyrighted material of Everything Real Estate, LLC
Investment Insights
Based on property information with market context.
This 1,500 SQFT mixed-use property includes a ground-floor banquet hall or event area and an upper-level residential unit. The commercial portion will be delivered vacant, while kitchen chattel and a bar may remain or be removed. The event space has a decades-long operating history, and the existing business may be transferred to a buyer if desired.
The upper residence contains 2 bedrooms and 1 bath and is currently occupied. Building updates include a newer roof, newer water heater, and a well-maintained forced air furnace. Constructed in 1920, the property offers a combination of commercial and residential components within one building.
The upper residence contains 2 bedrooms and 1 bath and is currently occupied. Building updates include a newer roof, newer water heater, and a well-maintained forced air furnace. Constructed in 1920, the property offers a combination of commercial and residential components within one building.
Key Highlights
- 1,500 SQFT mixed‑use property with ground‑floor banquet hall/event space
- Upper‑level 2 Bed / 1 Bath dwelling unit
- Commercial component conveyed vacant
Financial Insights
Estimated NOI and Cap Rate
NOI / Yr
$20,559
Cap Rate
9.14%
Suggested Prices Based on Cap Rates
Cap Rate 5%
$411,180
$411.2K
Cap Rate 7%
$293,700
$293.7K
Cap Rate 9%
$228,433
$228.4K
Market Conditions
NOI Build-Up for 1,400 SF
Gross rent
$31.1K $22.20/SF
− Vacancy
−$1.7K −$1.22/SF
EGI
$29.4K $20.98/SF
− OpEx
−$8.8K −$6.29/SF
NOI
$20.6K $14.69/SF
Area
Baltimore, MD
Vacancy
5.50%
Lease Rate
$22.20 /SF/Yr
Expense Ratio
30.00%
Simulate Cap Rate and NOI
Suggested Prices Based on Cap Rates
Cap Rate 5%
$411,180
Cap Rate 7%
$293,700
Cap Rate 9%
$228,433
Alternative Uses
Best Use
Multifamily LT 5
$293.7K
$257.0K – $342.7K
NOI $20,559 @ 7.0% cap · market cap 9.14%
Second Best
Mixed Use
$276.0K
$241.5K – $322.0K
NOI $19,320 @ 7.0% cap · market cap 8.59%
Theoretical Best
Office A
$335.4K
$293.5K – $391.3K
NOI $23,478 @ 7.0% cap · market cap 10.43%
Zoning and permitted uses should be independently verified with authorities.
Property Analytics
Unlock full access to Insights
Subscribe to Realmo Intelligence
Open Analytics
Current Use
Location Intelligence
Trade Area within ½ mile
6,531
Businesses Nearby
Explore this area
Business Placement
Demographics for 21205, MD
14,691
Population
6,502
Households
2.3
Avg Household Size
34
Median Age
16%
College-Educated
78%
High-School Grad
2.1 sq mi
ZIP Area
6,996
Density / Sq Mi
$38,723
Median Household Income
$36,735
Median Earnings
$1,052
Median Rent
$94,900
Median Home Value
Check the figures for this property
Cap Rate, Value Estimation, Potential NOI and more
View Realmo Analytics
Market
Vacancy Rate% for Multifamily in South region

Questions? Ask Rey
Realmo’s AI knows this listing — price, zoning, demand, history. Ask anything.




Frequently Asked Questions
What type of property is this?
Mixed-use property - Two-level building combines a vacant commercial area with an occupied two-bedroom dwelling.
Where is this mixed-use property located?
The property is located at 2200 JEFFERSON STREET Baltimore, MD.
What is the asking price?
The asking price for this property is $225,000.
What are key features of this property?
This property features: 1,500 SQFT mixed‑use property with ground‑floor banquet hall/event space; Upper‑level 2 Bed / 1 Bath dwelling unit; Commercial component conveyed vacant


