Updated Half-Duplex with
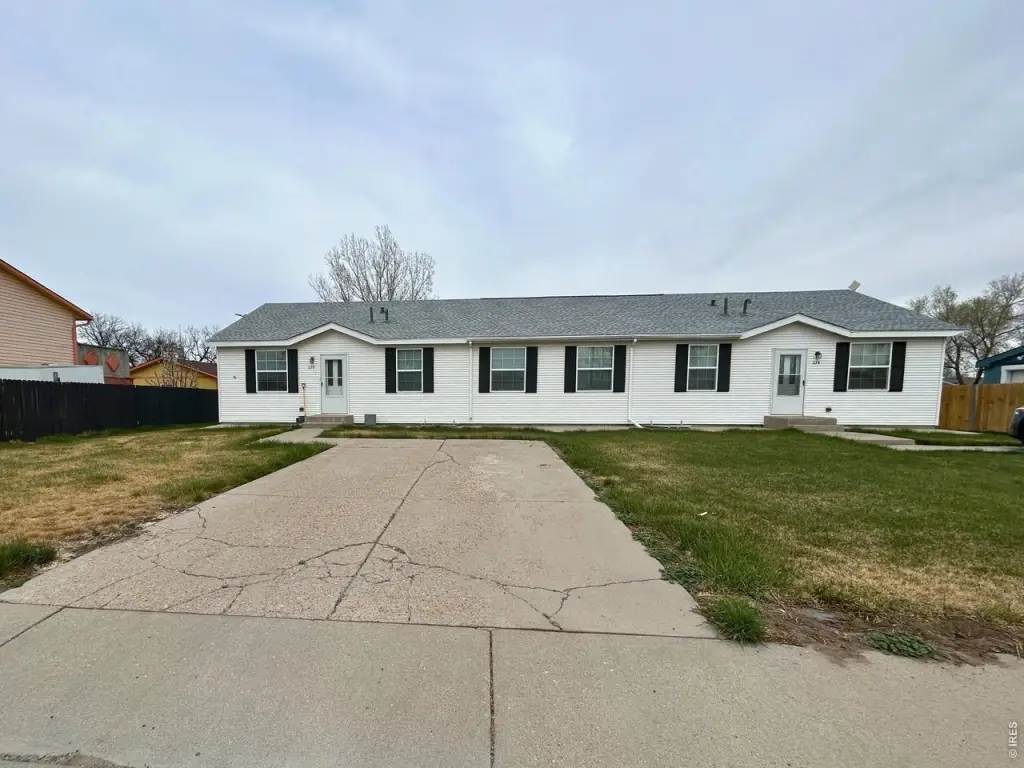
For Sale
$265,000
220 S Spruce St, Fort Morgan, CO 80701
Residential, Fort Morgan, CO
Property Size2,280 SF
Lot Size0.14 Acres
Price / SF$116.23
Days on Market188
Property Features for 220 S Spruce St
General Information
Property type
Residential
Property subtype
Duplex
Zoning
Res
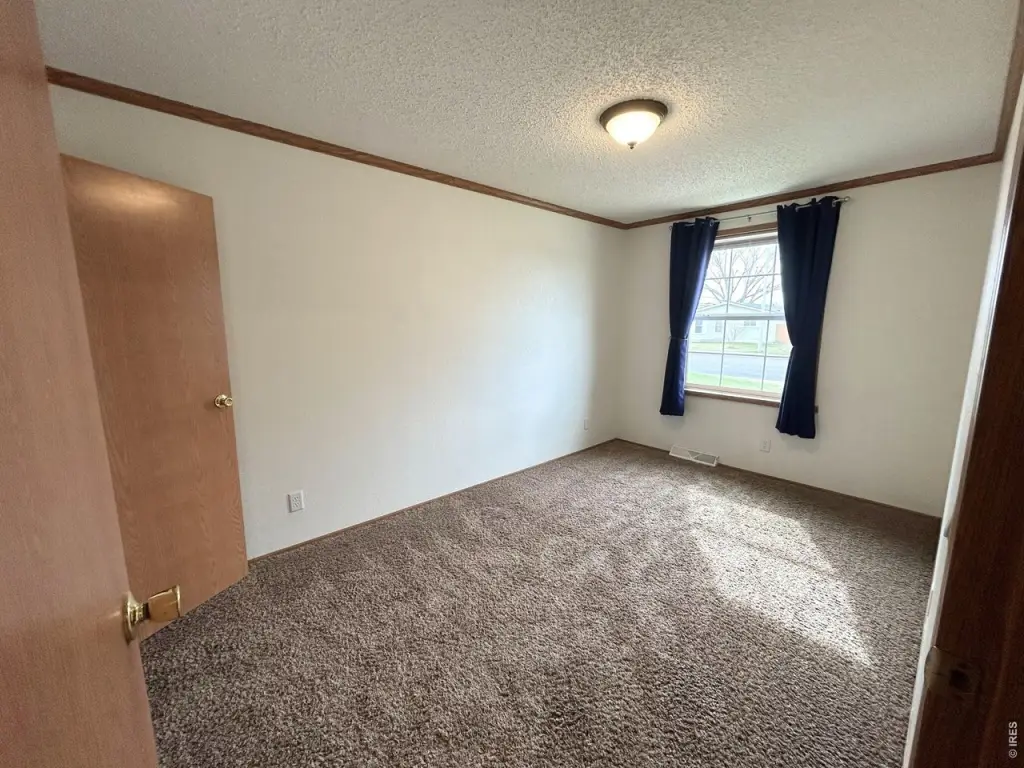
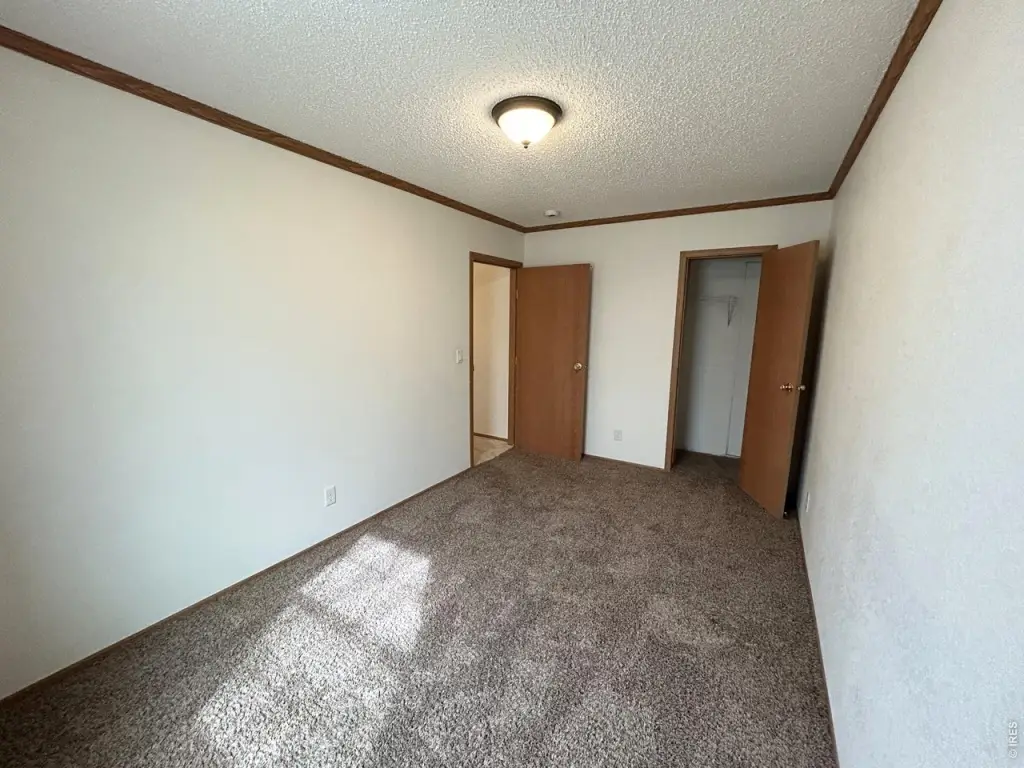
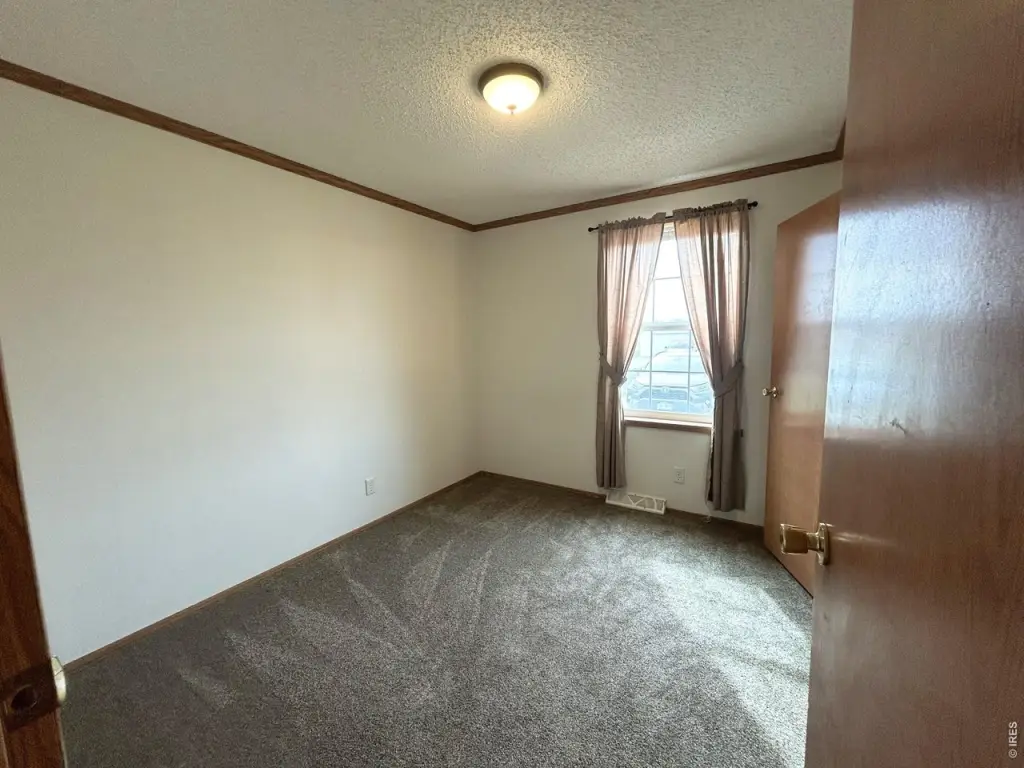
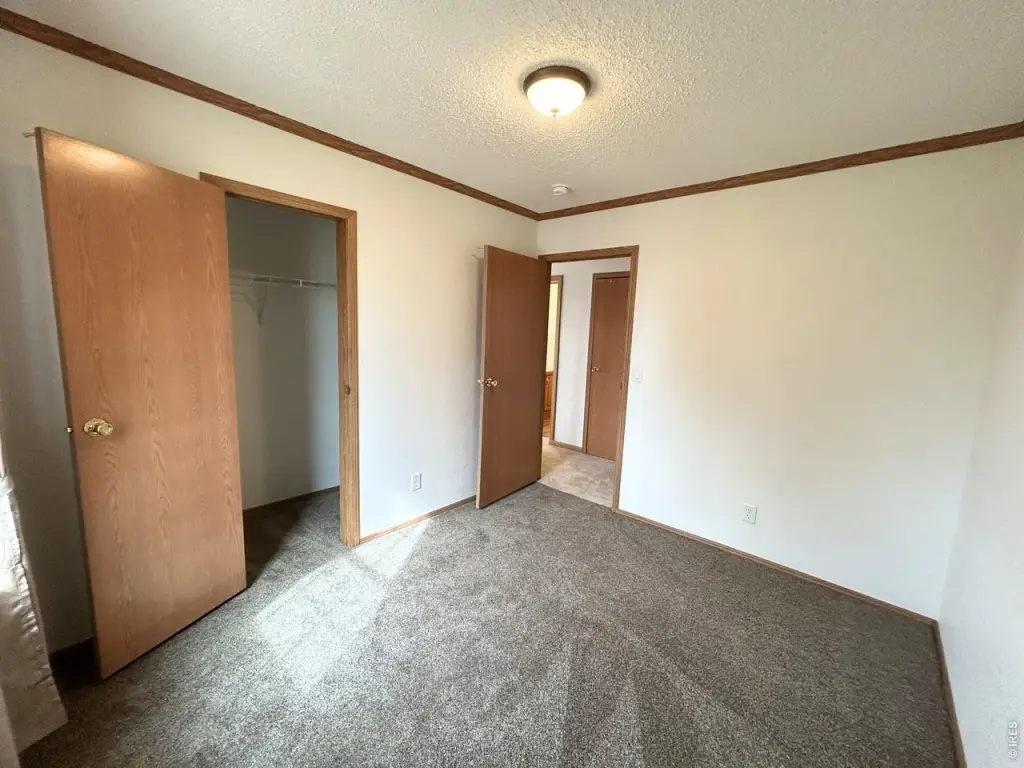
Bedrooms
3
Bathrooms
2
Full bathrooms
1
Rooms
Bedroom 3, Bathroom 1, Bedroom 1, Basement, Bedroom 2, Bathroom 2
Parking features
Off Street
Window features
Window Coverings
Pets allowed
Cats OK, Dogs OK
Interior features
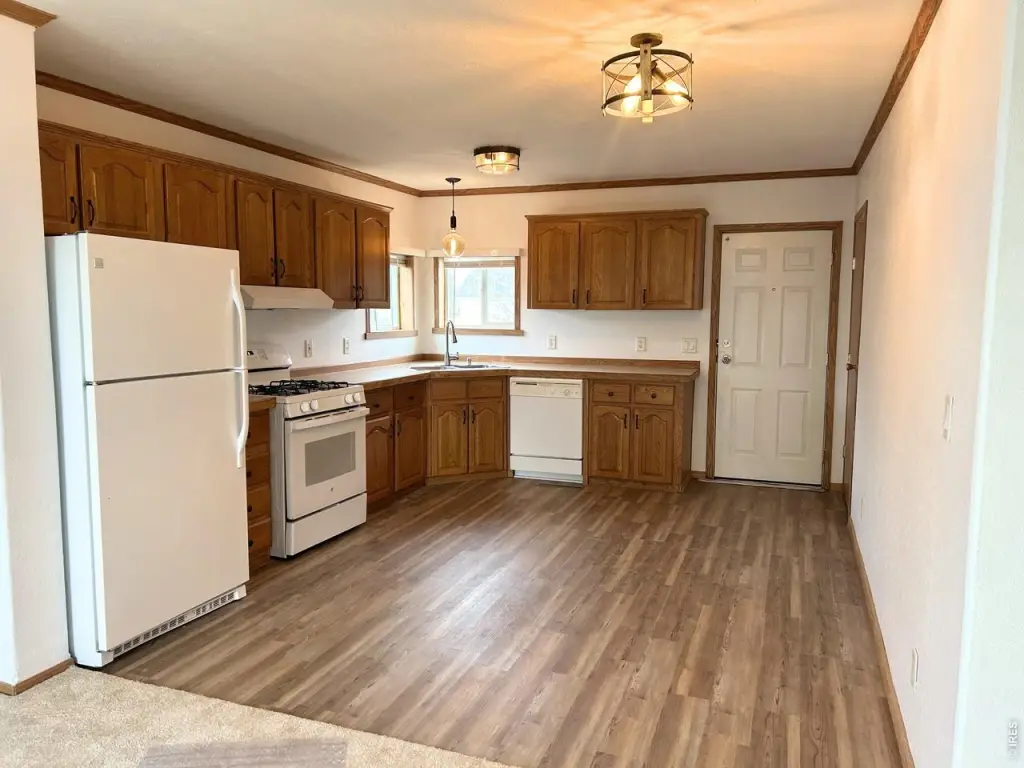
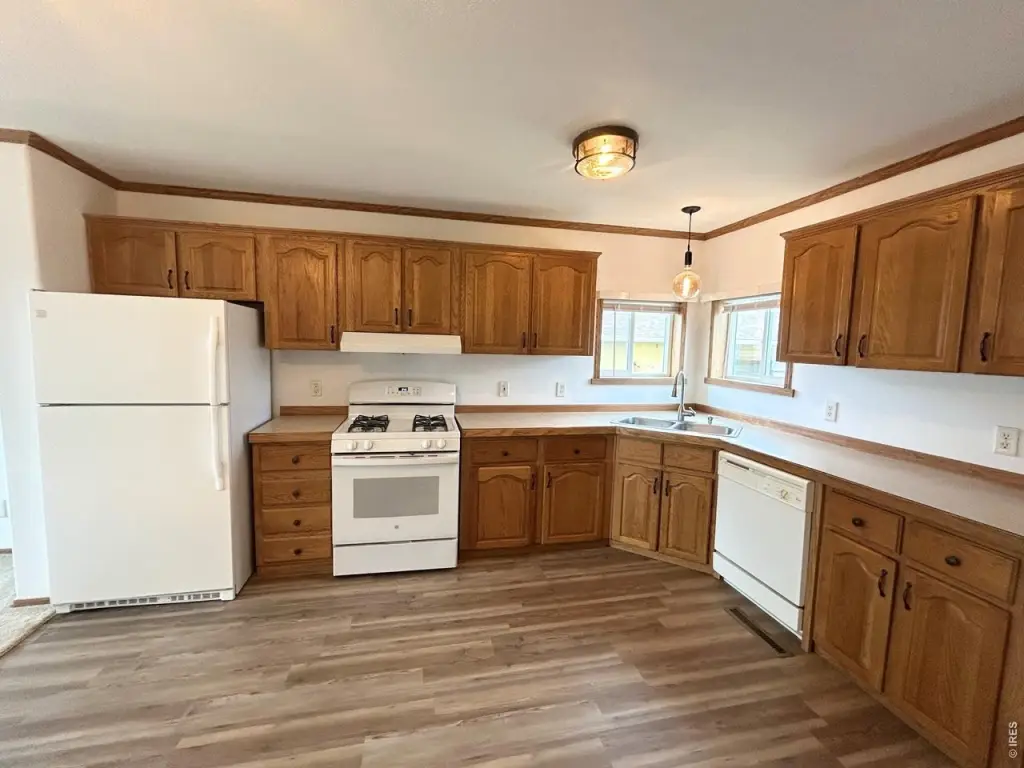
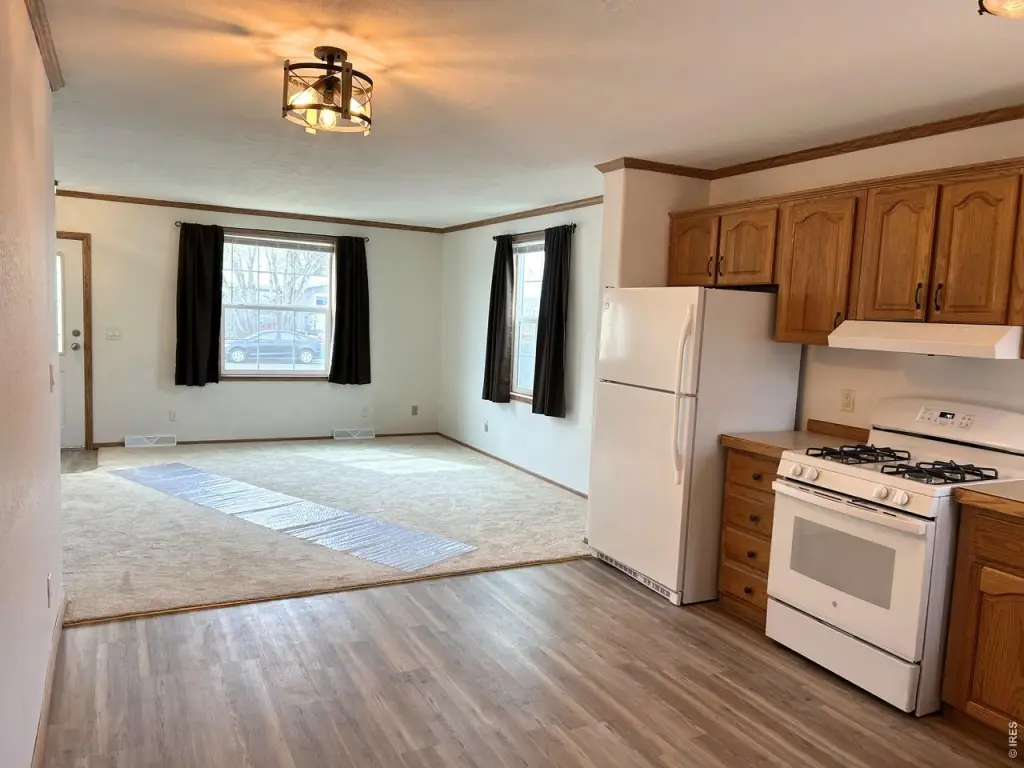
Eat-in Kitchen, Open Floorplan, Walk-In Closet(s)
Exterior features
Sprinkler System
Fencing
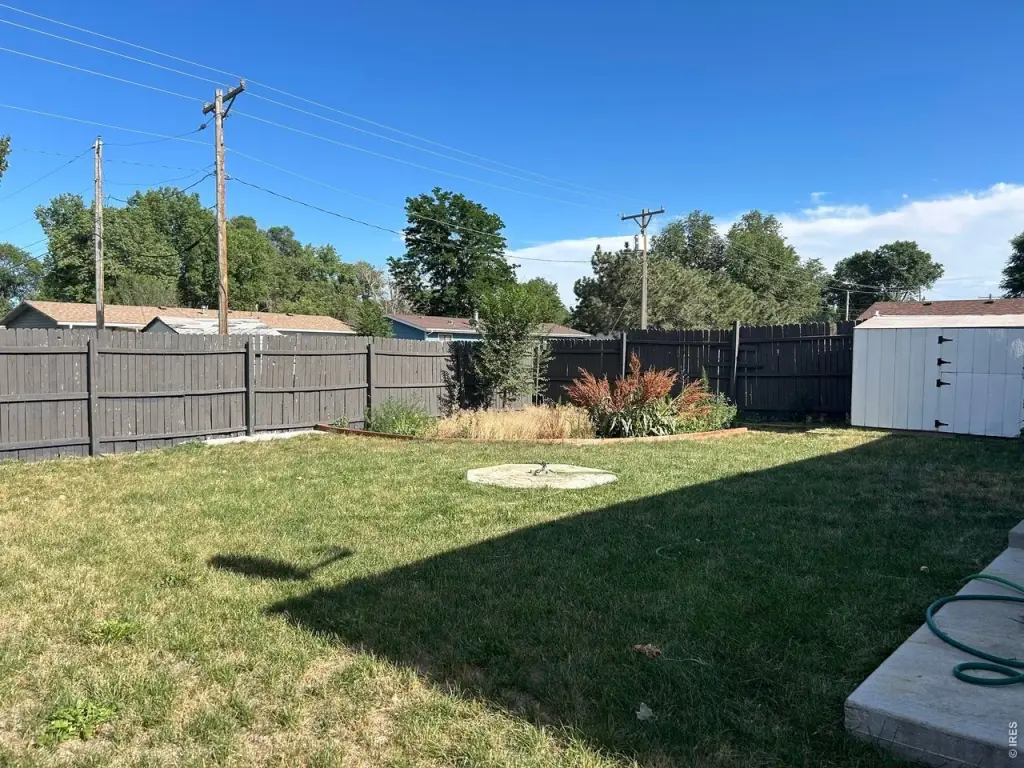
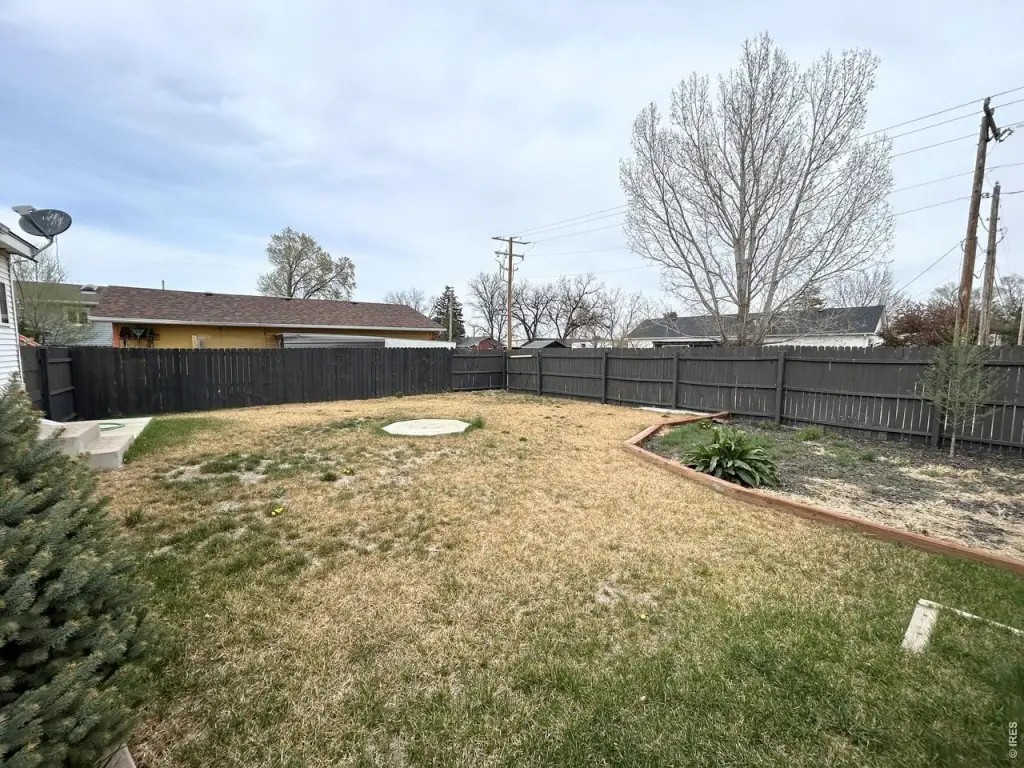
Fenced
Basement
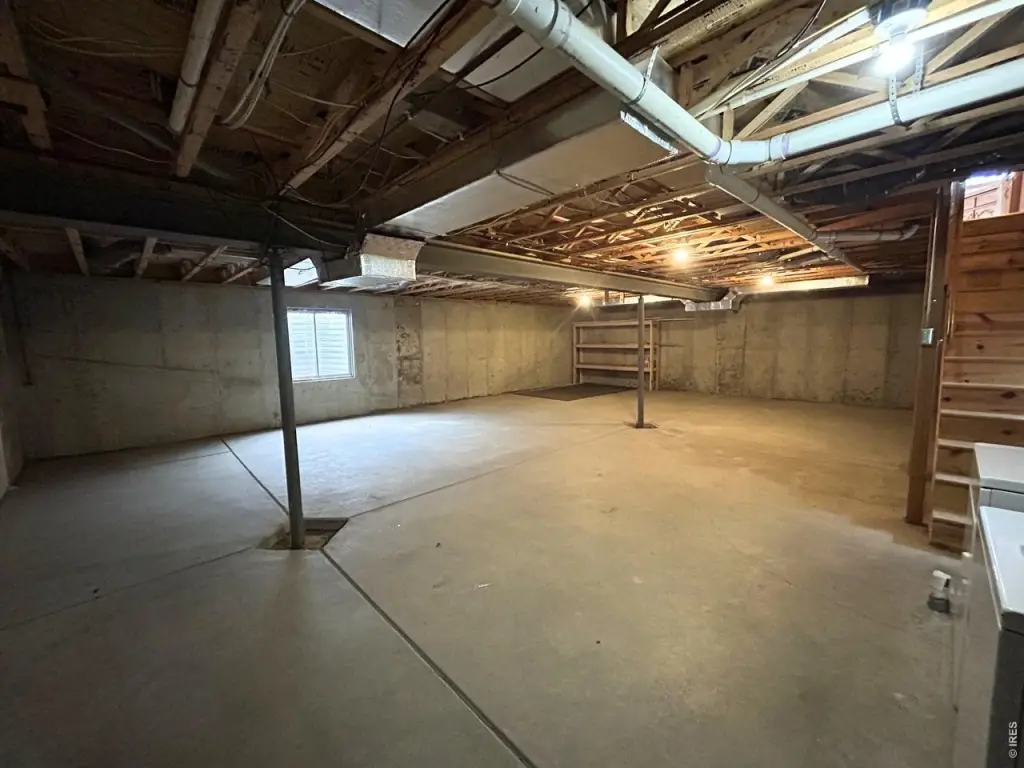
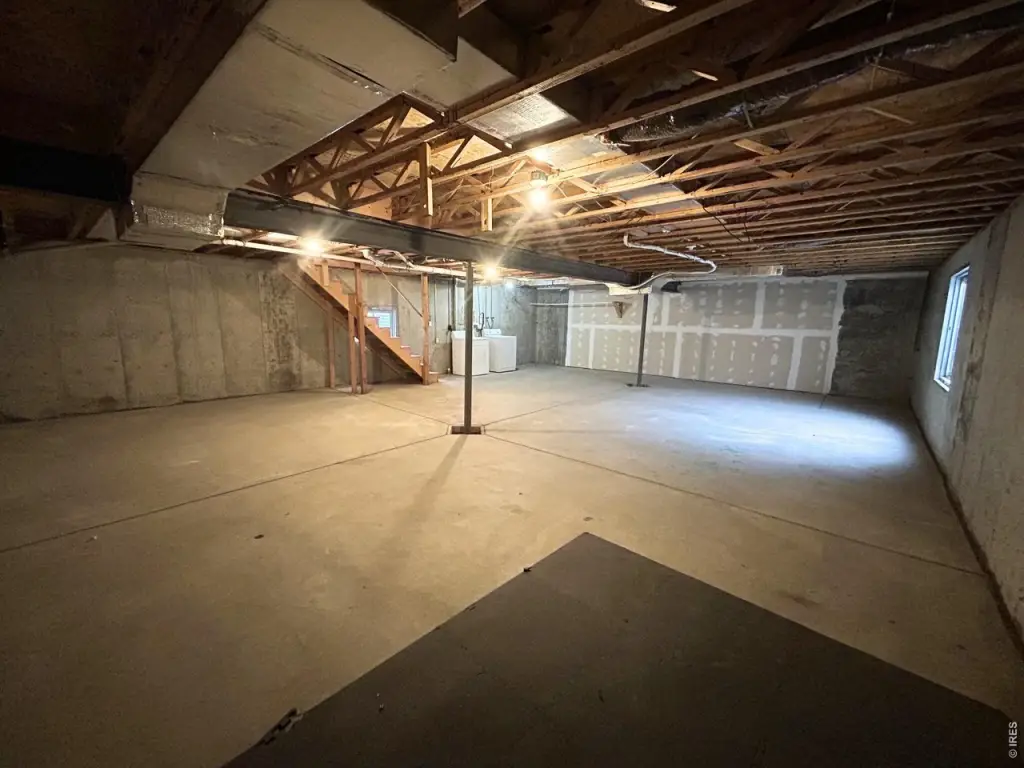
Full, Unfinished
Appliances
Electric Range, Dishwasher, Refrigerator, Washer, Dryer
Subdivision
Pioneer Add
Lot features
Level, Paved, Sidewalks
Elementary school
Fort Morgan
Middle school
Fort Morgan
High school
Fort Morgan
Elementary school district
Fort Morgan RE-3
Middle school district
Fort Morgan RE-3
High school district
Fort Morgan RE-3
Standard status
Active
APN
122907142006
Size
2,280 SF
Lot size
0.14 Acres
Taxes and HOA fees
Tax Year
2025
Tax Annual Amount
954
Utilities
Utilities
Natural Gas Available
Sewer type
Public Sewer
Heating system
Forced Air
Cooling system
Central Air
Water source
Public
Amenities
fenced backyard
storage shed
Building Details
Year built
2002
Floors in Building
1
Building materials
Frame
Roof type
Composition
Additional Structures
Storage
Listing Agency:
8z Real Estate
(303) 543-3083
Listed By:
Baylei Curtis
(970) 441-0223
Added: Apr 13
Changed: Oct 17
Last Checked: Oct 17 at 10:06AM
MLS# 1056341
Copyright © 2026 IRES MLS. All rights reserved. All information provided by the listing agent/broker is deemed reliable but is not guaranteed and should be independently verified.

Ask AI about this property
Review the available facts, identify missing information and prepare questions for the agent.
Investment Insights
Based on property information with market context.
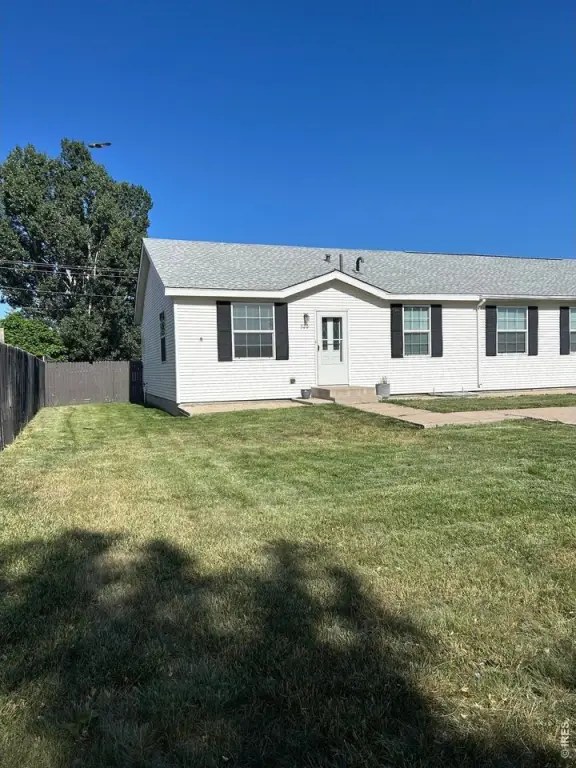
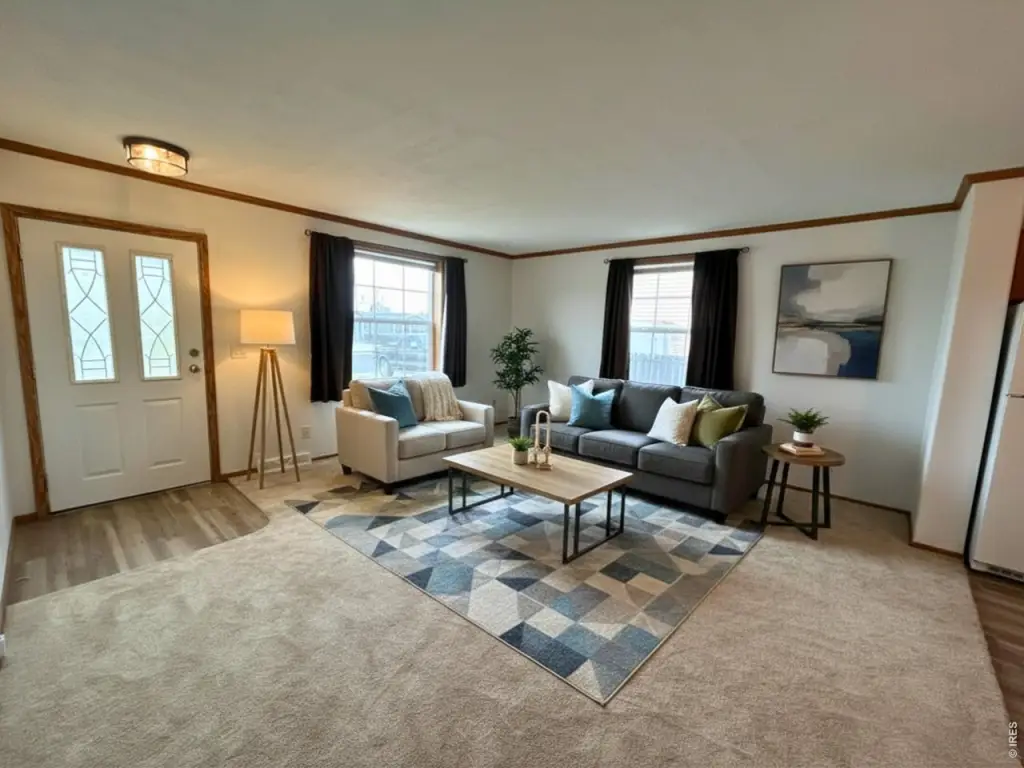
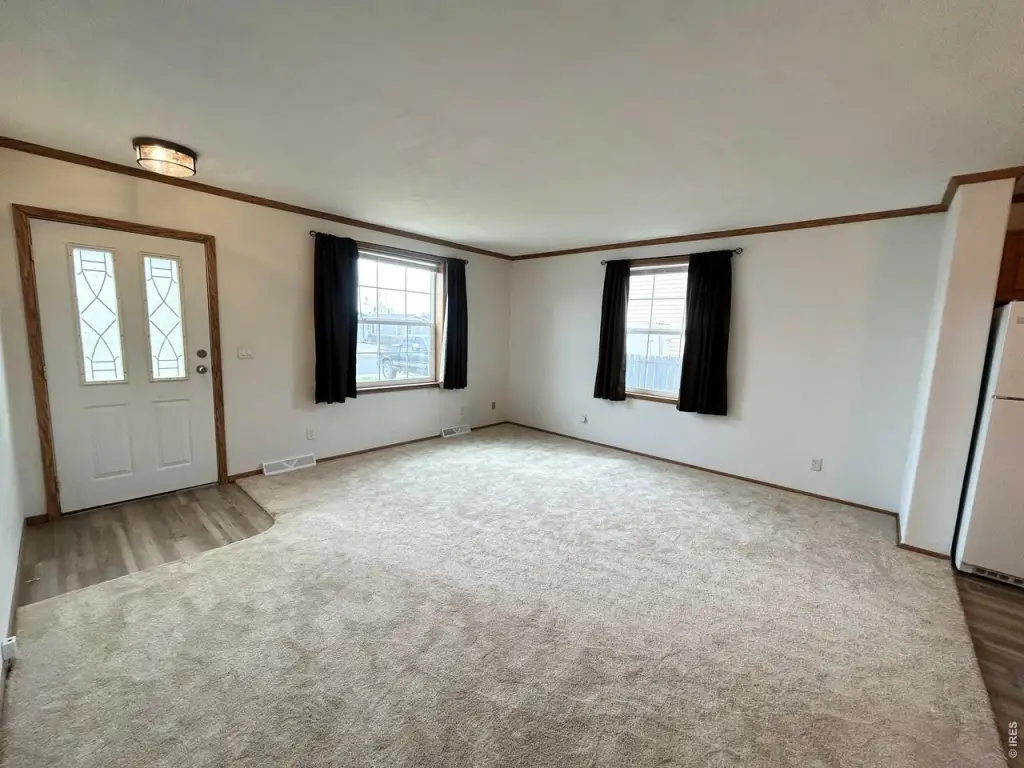
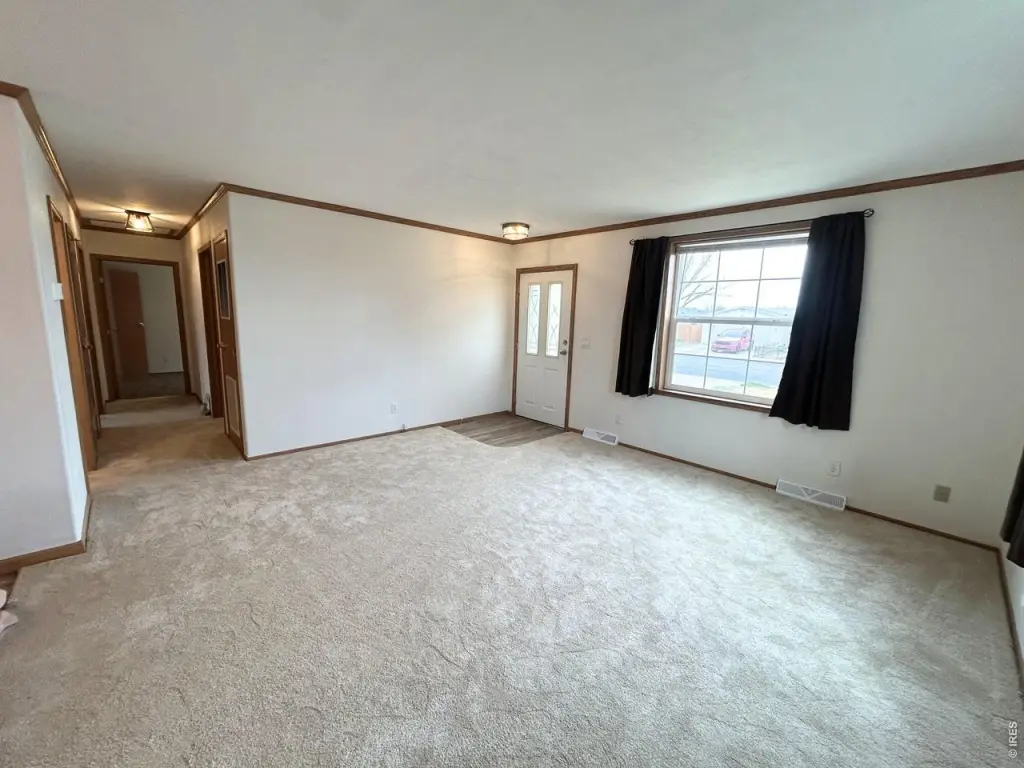
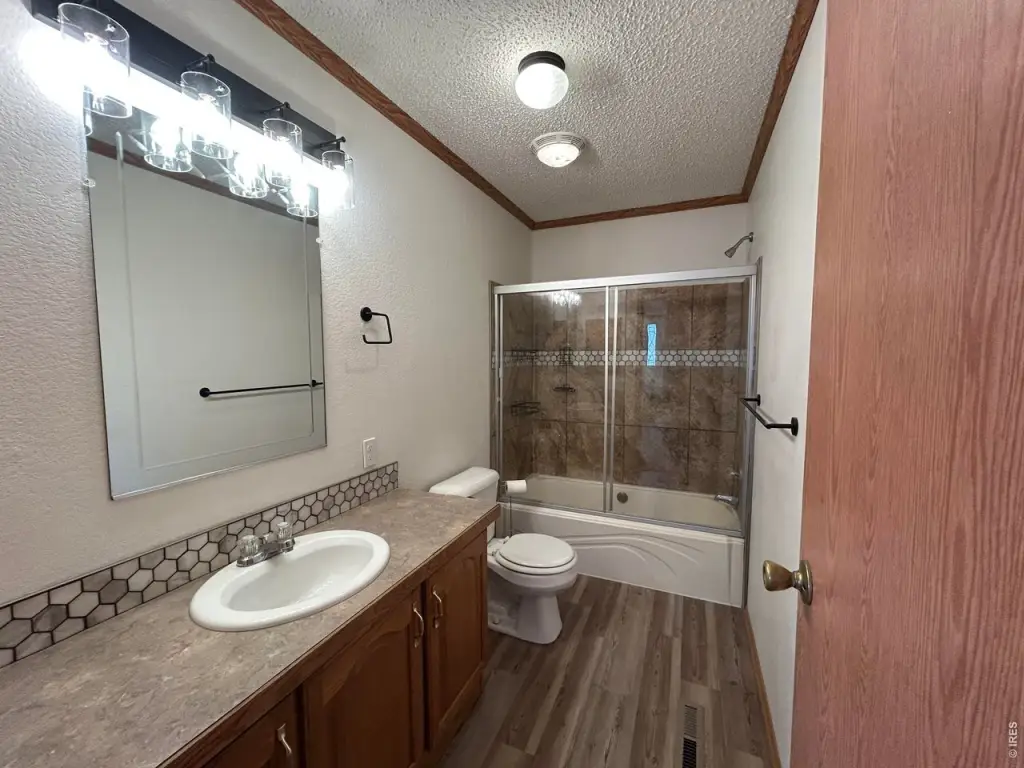
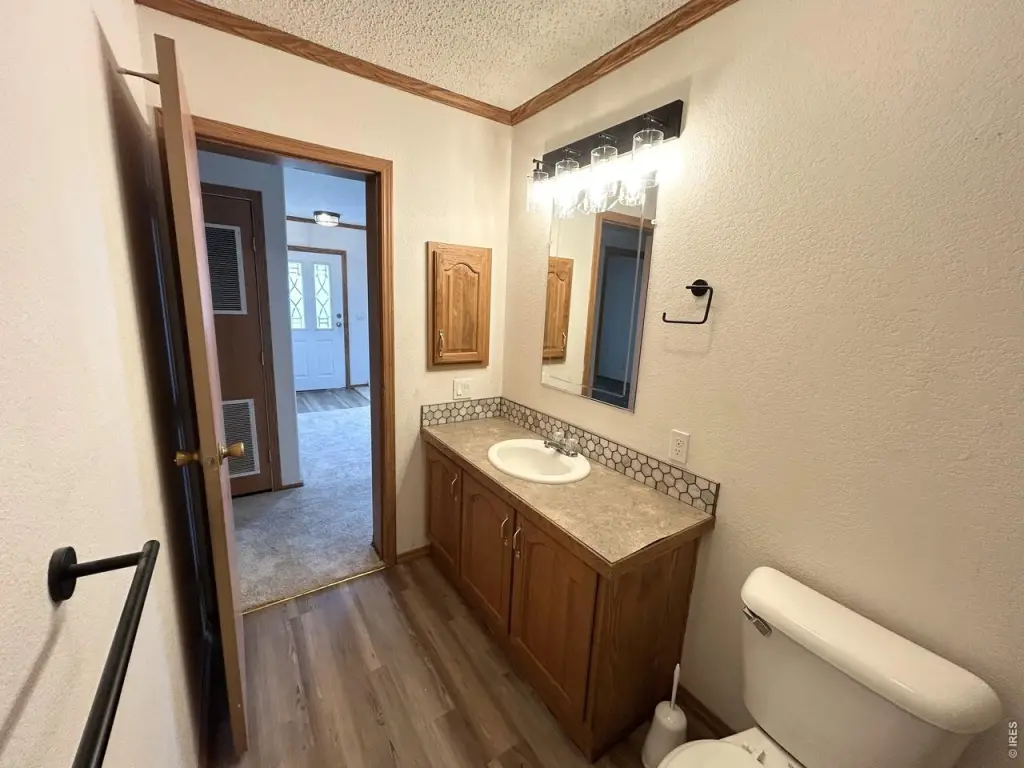
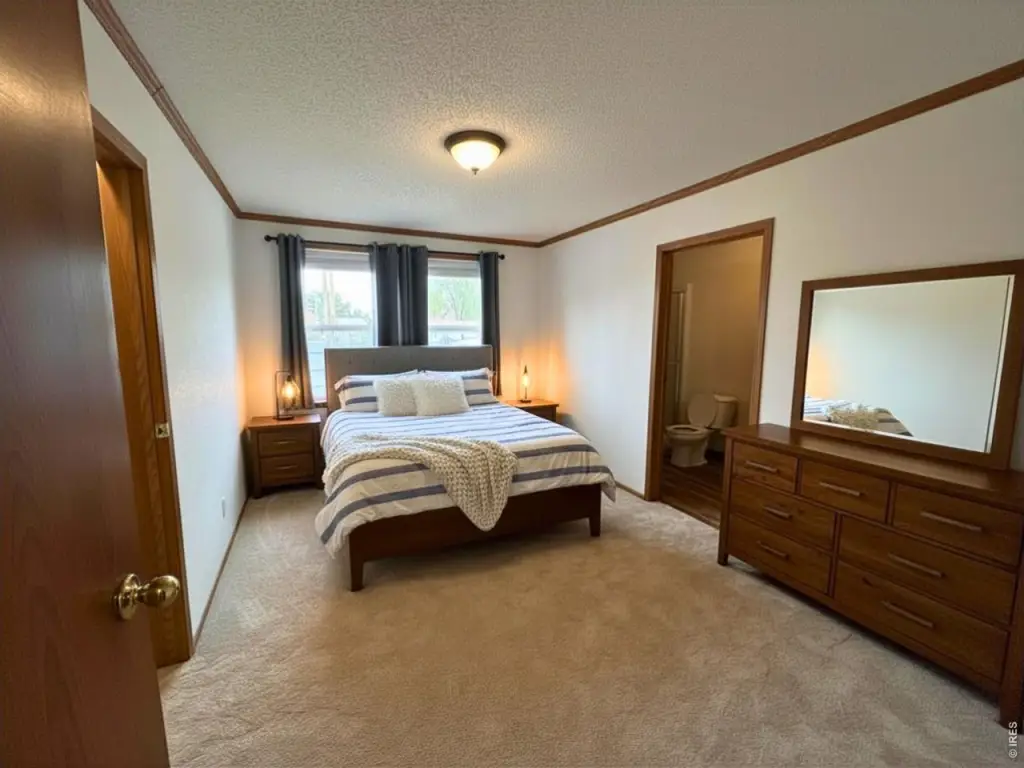
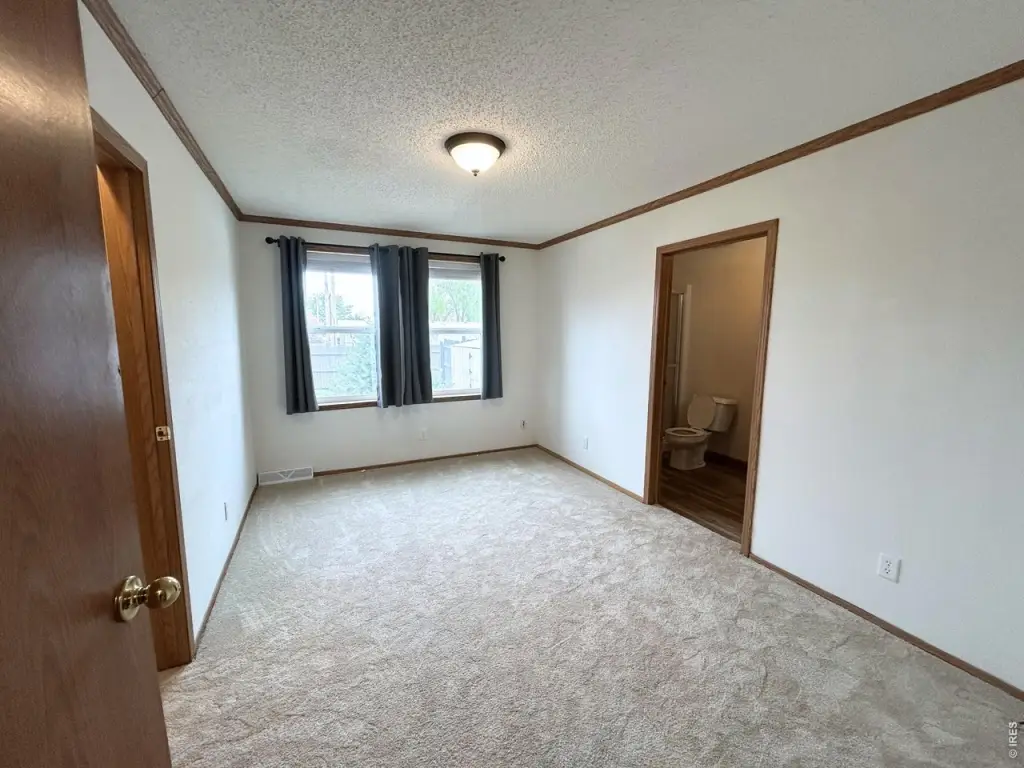
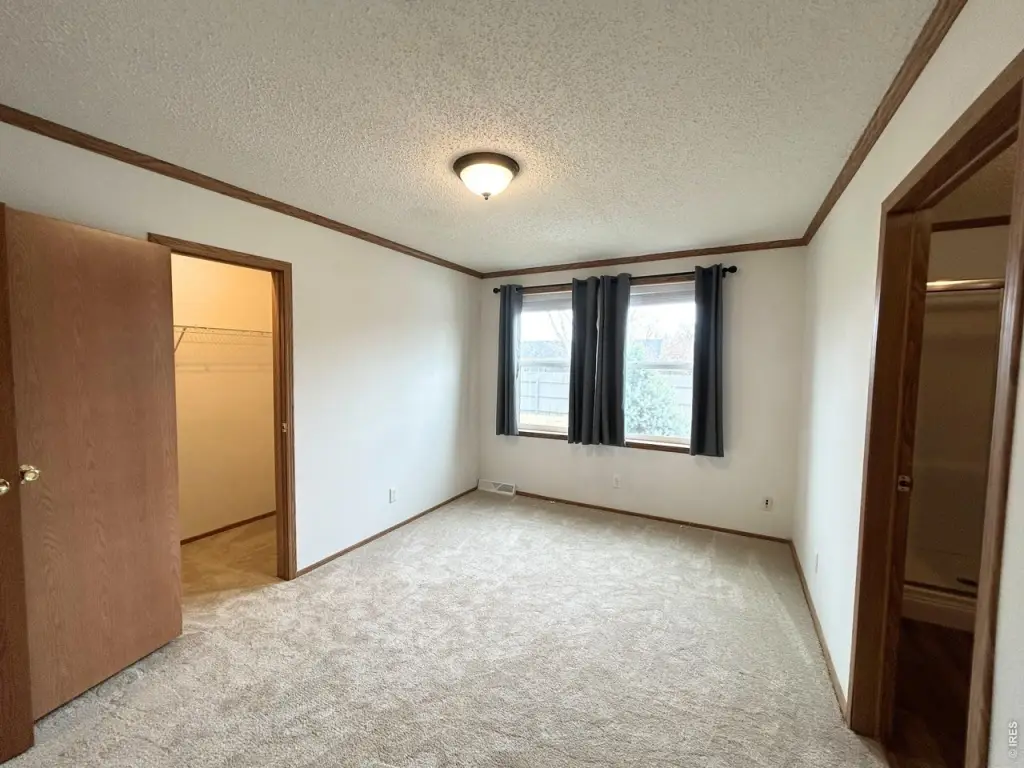
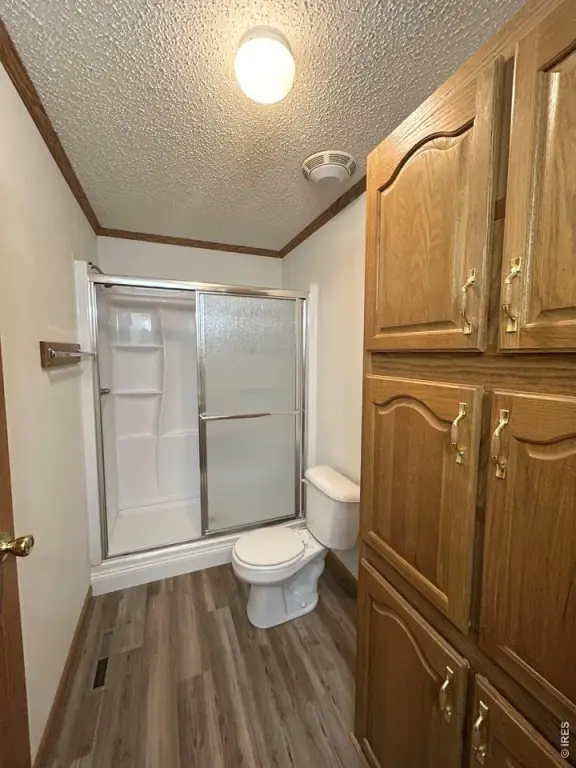
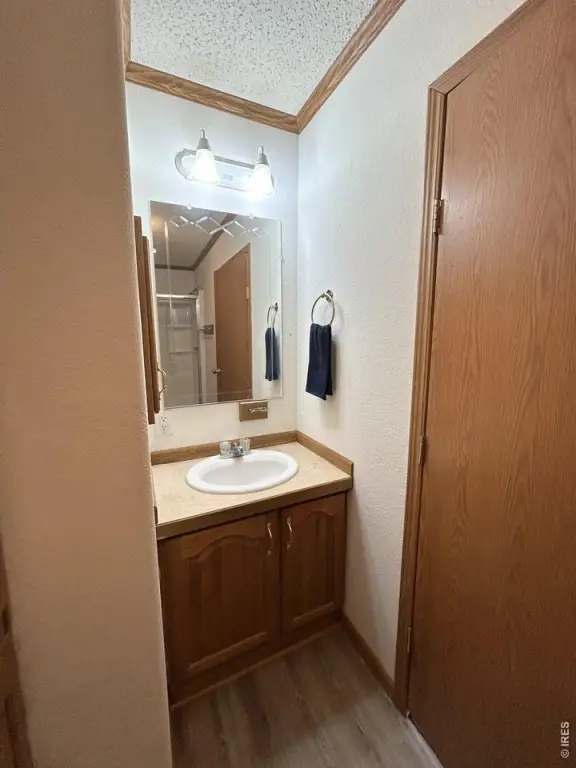
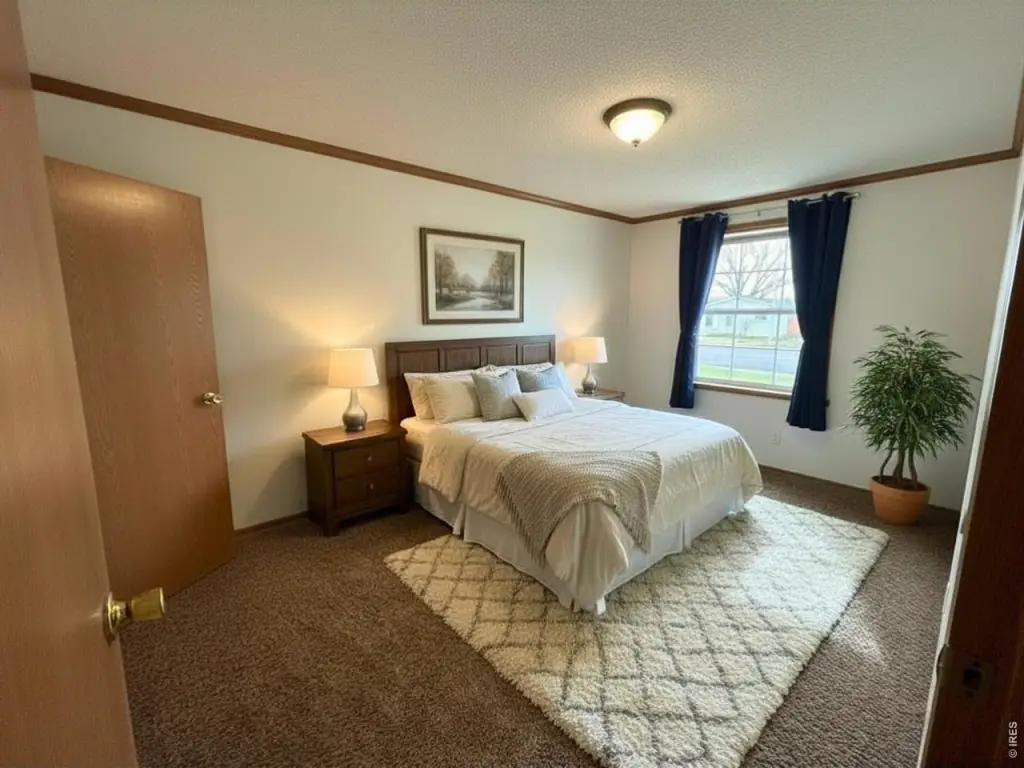
This 2002 half-duplex provides 2,280 square feet with three bedrooms, two full bathrooms, and a practical main-level layout. The primary suite includes a private bath, walk-in closet, and additional storage, while the eat-in kitchen, open floor plan, and second bathroom support everyday living. A full unfinished basement includes a bathroom rough-in for future customization. Planned granite countertop installation complements recent improvements that include a new roof, new windows, new living room and primary bedroom carpet, and select interior paint updates.
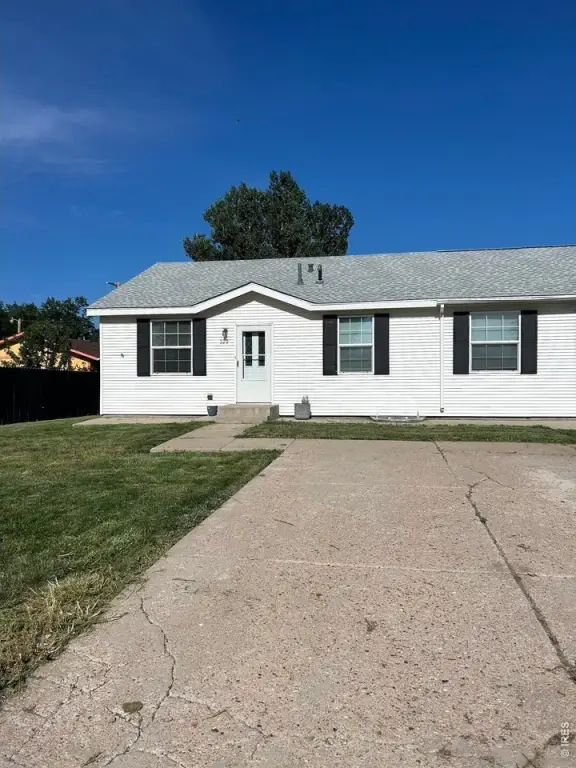
The 0.14-acre property includes a fully fenced backyard, sprinkler system, storage shed, and off-street parking with room for two vehicles in front of the home. Additional features include central air, forced-air heating, a composition roof, public sewer, and natural gas availability. The property is zoned Res and may serve as either a primary residence or an income-producing rental.
The 0.14-acre property includes a fully fenced backyard, sprinkler system, storage shed, and off-street parking with room for two vehicles in front of the home. Additional features include central air, forced-air heating, a composition roof, public sewer, and natural gas availability. The property is zoned Res and may serve as either a primary residence or an income-producing rental.
Key Highlights
- 2,280‑square‑foot half‑duplex built in 2002
- Three bedrooms and two full bathrooms with main‑floor living
- Full unfinished basement with bathroom rough‑in
Financial Insights
Estimated NOI and Cap Rate
NOI / Yr
$20,572
Cap Rate
7.76%
Suggested Prices Based on Cap Rates
Cap Rate 5%
$411,440
$411.4K
Cap Rate 7%
$293,886
$293.9K
Cap Rate 9%
$228,578
$228.6K
Market Conditions
NOI Build-Up for 2,280 SF
Gross rent
$40.2K $17.64/SF
− Vacancy
−$2.8K −$1.23/SF
EGI
$37.4K $16.41/SF
− OpEx
−$16.8K −$7.38/SF
NOI
$20.6K $9.02/SF
Area
Morgan County, CO
Vacancy
7.00%
Lease Rate
$17.64 /SF/Yr
Expense Ratio
45.00%
Simulate Cap Rate and NOI
Suggested Prices Based on Cap Rates
Cap Rate 5%
$411,440
Cap Rate 7%
$293,886
Cap Rate 9%
$228,578
Alternative Uses
Best Use
Apartment 5plus
$293.9K
$257.2K – $342.9K
NOI $20,572 @ 7.0% cap · market cap 7.76%
Second Best
—
—
no second resolved use
Theoretical Best
Office A
$667.6K
$584.1K – $778.9K
NOI $46,731 @ 7.0% cap · market cap 17.63%
Zoning and permitted uses should be independently verified with authorities.
How Realmo checks its estimates
Property Analytics
Unlock full access to Insights
Subscribe to Realmo Intelligence
Open Analytics
Current Use
Lease Details
1
Residential units
Location Intelligence
Trade Area within ½ mile
643
Businesses Nearby
Explore this area
Business Placement
Demographics for 80701, CO
16,101
Population
6,575
Households
2.4
Avg Household Size
35
Median Age
19%
College-Educated
84%
High-School Grad
616.5 sq mi
ZIP Area
26
Density / Sq Mi
$72,500
Median Household Income
$41,071
Median Earnings
$1,096
Median Rent
$318,100
Median Home Value
Check the figures for this property
Cap Rate, Value Estimation, Potential NOI and more
View Realmo Analytics





Frequently Asked Questions
What type of property is this?
Single family property - Three-bedroom half-duplex with main-floor living, a fenced yard, and flexible residential or rental use.
Where is this single family property located?
The property is located at 220 S Spruce St Fort Morgan, CO.
What is the asking price?
The asking price for this property is $265,000.
What are key features of this property?
This property features: 2,280‑square‑foot half‑duplex built in 2002; Three bedrooms and two full bathrooms with main‑floor living; Full unfinished basement with bathroom rough‑in


