Updated Two-Unit
For Sale
$539,000
Pending
219 Woodward Avenue, Buffalo, NY 14214
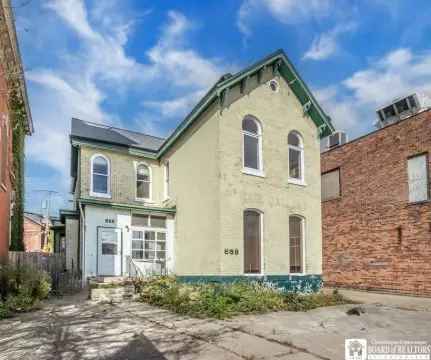
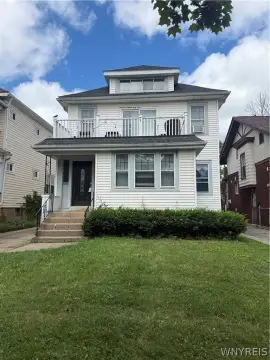
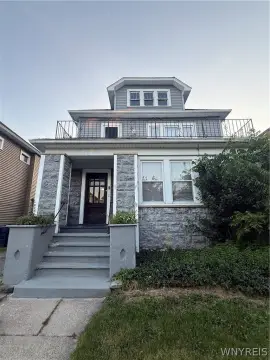
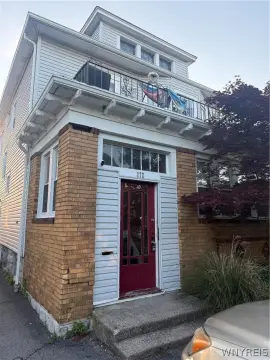
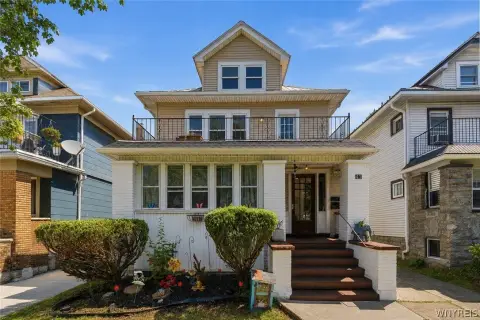
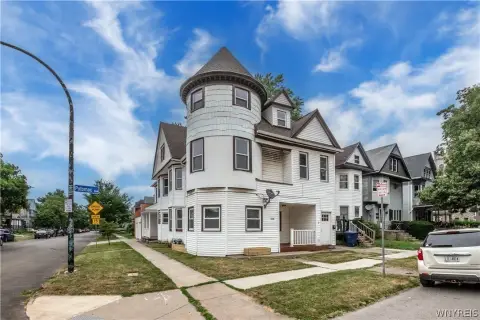
Vacant-at-closing duplex with renovated interiors, separate utilities, central air, and dedicated parking improvements.
Property Size2,950 SF
Days on Market66
Property Features for 219 Woodward Avenue
General Information
Standard status
Pending
Size
2,950 SF
Property subtype
Multi Family
Taxes and HOA fees
Annual Taxes
$4,799
Building Details
Building Size
2,950 SF
Year Built
1920
Listing Agency:
Gurney Becker & Bourne
Listed By:
Christian L Reitler · License #10401290363
(716) 435-0908
Source:
Highfallssir
Added: Aug 14
Changed: Oct 14
Last Checked: Oct 16 at 3:42PM
Displayed information is deemed reliable but is not guaranteed and should be independently verified. All listing content including descriptions, pricing, images are the copyrighted material of Gurney Becker & Bourne

Ask AI about this property
Review the available facts, identify missing information and prepare questions for the agent.
Investment Insights
Based on property information with market context.
Built in 1920, this two-family duplex contains two 3-bedroom units with high ceilings, leaded glass windows, and front porches. Both residences have open layouts, abundant natural light, updated kitchens with shaker cabinetry, tile backsplashes, stainless steel appliances, and granite or quartz countertops. Renovated bathrooms include ceramic tile walk-in showers, while luxury vinyl plank flooring and updated lighting continue throughout. The upper unit adds a kitchen island with a sink, dishwasher, and breakfast bar seating.
Recent property work includes new electric panels, updated wiring, plumbing improvements, glass block windows, a new main cast iron drain with PVC piping, and reinforced basement joists. Each unit has central air, laundry hookups, and separate utilities. The upper residence also has a new furnace, air conditioning system, and hot water tank. Exterior amenities include a two-car garage with an automatic opener and parking for two additional vehicles. Both units are scheduled to be vacant at closing.
Recent property work includes new electric panels, updated wiring, plumbing improvements, glass block windows, a new main cast iron drain with PVC piping, and reinforced basement joists. Each unit has central air, laundry hookups, and separate utilities. The upper residence also has a new furnace, air conditioning system, and hot water tank. Exterior amenities include a two-car garage with an automatic opener and parking for two additional vehicles. Both units are scheduled to be vacant at closing.
Key Highlights
- Two 3‑bedroom units with open layouts and abundant natural light
- Updated kitchens with stainless steel appliances and granite or quartz counters
- Renovated bathrooms with ceramic tile walk‑in showers
Financial Insights
Estimated NOI and Cap Rate
NOI / Yr
$29,271
Cap Rate
5.43%
Suggested Prices Based on Cap Rates
Cap Rate 5%
$585,420
$585.4K
Cap Rate 7%
$418,157
$418.2K
Cap Rate 9%
$325,233
$325.2K
Market Conditions
NOI Build-Up for 2,950 SF
Gross rent
$44.3K $15.00/SF
− Vacancy
−$2.4K −$0.83/SF
EGI
$41.8K $14.17/SF
− OpEx
−$12.5K −$4.25/SF
NOI
$29.3K $9.92/SF
Area
Buffalo, NY
Vacancy
5.50%
Lease Rate
$15.00 /SF/Yr
Expense Ratio
30.00%
Simulate Cap Rate and NOI
Suggested Prices Based on Cap Rates
Cap Rate 5%
$585,420
Cap Rate 7%
$418,157
Cap Rate 9%
$325,233
Alternative Uses
Best Use
Multifamily LT 5
$418.2K
$365.9K – $487.9K
NOI $29,271 @ 7.0% cap · market cap 5.43%
Second Best
Apartment 5plus
$385.2K
$337.0K – $449.4K
NOI $26,961 @ 7.0% cap · market cap 5.00%
Theoretical Best
Office A
$709.4K
$620.7K – $827.7K
NOI $49,659 @ 7.0% cap · market cap 9.21%
Zoning and permitted uses should be independently verified with authorities.
How Realmo checks its estimates
Property Analytics
Unlock full access to Insights
Subscribe to Realmo Intelligence
Open Analytics
Current Use
Location Intelligence
Trade Area within ½ mile
1,035
Businesses Nearby
Explore this area
Business Placement
Demographics for 14214, NY
20,732
Population
9,280
Households
2.2
Avg Household Size
32
Median Age
46%
College-Educated
90%
High-School Grad
3.3 sq mi
ZIP Area
6,282
Density / Sq Mi
$56,573
Median Household Income
$29,928
Median Earnings
$1,072
Median Rent
$234,600
Median Home Value
Check the figures for this property
Cap Rate, Value Estimation, Potential NOI and more
View Realmo Analytics
Market
Vacancy Rate% for Multifamily in Northeast region





Frequently Asked Questions
What type of property is this?
Duplex - Vacant-at-closing duplex with renovated interiors, separate utilities, central air, and dedicated parking improvements.
Where is this duplex located?
The property is located at 219 Woodward Avenue Buffalo, NY.
What is the asking price?
The asking price for this property is $539,000.
What are key features of this property?
This property features: Two 3‑bedroom units with open layouts and abundant natural light; Updated kitchens with stainless steel appliances and granite or quartz counters; Renovated bathrooms with ceramic tile walk‑in showers


