Duplex with Separate
For Sale
$169,900
214 /218 Charles St, Watertown, NY 13601
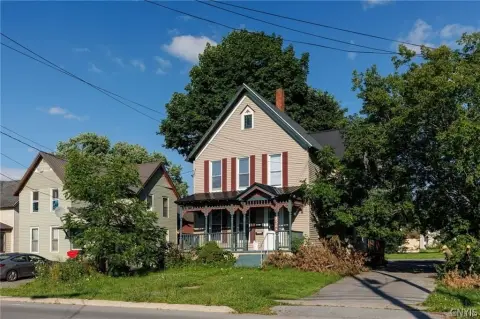
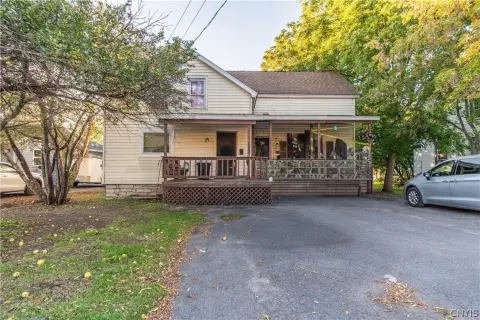
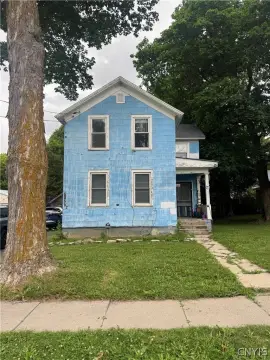
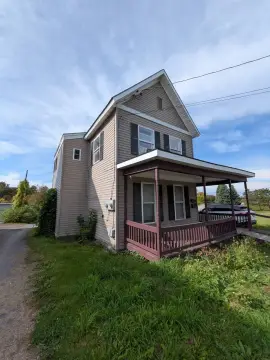
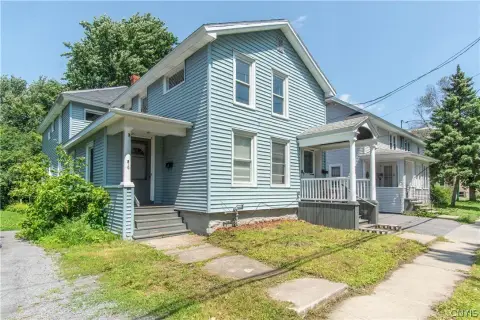
Side-by-side units include private entrances, dedicated yard areas, dry basements, and additional off-street parking.
Property Size1,694 SF
Price / SF$100.30
Days on Market54
Property Features for 214 /218 Charles St
General Information
Standard status
Active
Size
1,694 SF
Property subtype
Multi-Family
Site & Location
Road Access
Yes
Utilities to Site
Yes
Units
Unit Mix
2 x 2BR/1BA
Multifamily Units
2
Amenities
front porch
dedicated yard space
private dry basement
washer dryer hookups
attic crawl space
2 car garage
off-street parking
Building Details
Year Built
1919
Construction
craftsman
Listing Agency:
Bridgeview Real Estate
Listed By:
Chenoa Reynolds · License #10401341542
(315) 782-9292
Source:
Skinnercnyrealty
Added: Aug 22
Changed: Oct 14
Last Checked: Oct 7 at 3:50PM
Displayed information is deemed reliable but is not guaranteed and should be independently verified. All listing content including descriptions, pricing, images are the copyrighted material of Bridgeview Real Estate
Investment Insights
Based on property information with market context.
Built in 1919, this 1,694-square-foot duplex at 214 /218 Charles St features two side-by-side units with matching two-level layouts. Each residence includes living, dining, and kitchen areas on the main floor, with two bedrooms and one bathroom upstairs. Private front and rear entrances, individual porches, dedicated yard space, dry basements with washer and dryer hookups, attic crawl-space access, and separate utilities serve each unit.
The 218 unit has been refreshed and is nearing occupancy readiness, while improvements underway in 214 include new sheetrock and a tub surround. Materials included with the sale include a bathroom sink and vanity, toilet, refrigerator, sink, gas range, washer, dryer, and laundry sink. Original hardwood flooring remains through much of the property, along with updates to portions of the electrical, plumbing, and windows. A new metal roof covers the duplex, and the detached two-car garage also has a new roof. Shared driveway access is double-wide, with additional dedicated parking at the rear and side.
The 218 unit has been refreshed and is nearing occupancy readiness, while improvements underway in 214 include new sheetrock and a tub surround. Materials included with the sale include a bathroom sink and vanity, toilet, refrigerator, sink, gas range, washer, dryer, and laundry sink. Original hardwood flooring remains through much of the property, along with updates to portions of the electrical, plumbing, and windows. A new metal roof covers the duplex, and the detached two-car garage also has a new roof. Shared driveway access is double-wide, with additional dedicated parking at the rear and side.
Key Highlights
- 1,694‑square‑foot duplex built in 1919
- Two side‑by‑side units, each with 2 bedrooms and 1 bathroom
- Separate utilities with 150 amp service for each unit
Financial Insights
Estimated NOI and Cap Rate
NOI / Yr
$13,947
Cap Rate
8.21%
Suggested Prices Based on Cap Rates
Cap Rate 5%
$278,940
$278.9K
Cap Rate 7%
$199,243
$199.2K
Cap Rate 9%
$154,967
$155.0K
Market Conditions
NOI Build-Up for 1,694 SF
Gross rent
$21.3K $12.60/SF
− Vacancy
−$1.4K −$0.84/SF
EGI
$19.9K $11.76/SF
− OpEx
−$6.0K −$3.53/SF
NOI
$13.9K $8.23/SF
Area
Jefferson County, NY
Vacancy
6.65%
Lease Rate
$12.60 /SF/Yr
Expense Ratio
30.00%
Simulate Cap Rate and NOI
Suggested Prices Based on Cap Rates
Cap Rate 5%
$278,940
Cap Rate 7%
$199,243
Cap Rate 9%
$154,967
Alternative Uses
Best Use
Multifamily LT 5
$199.2K
$174.3K – $232.5K
NOI $13,947 @ 7.0% cap · market cap 8.21%
Second Best
Apartment 5plus
$178.2K
$156.0K – $208.0K
NOI $12,477 @ 7.0% cap · market cap 7.34%
Theoretical Best
Office A
$467.0K
$408.6K – $544.8K
NOI $32,687 @ 7.0% cap · market cap 19.24%
Zoning and permitted uses should be independently verified with authorities.
How Realmo checks its estimates
Property Analytics
Unlock full access to Insights
Subscribe to Realmo Intelligence
Open Analytics
Current Use
Lease Details
2
Residential units
Yes
Paved road access
Yes
Utilities to site
Location Intelligence
Trade Area within ½ mile
696
Businesses Nearby
Explore this area
Business Placement
Demographics for 13601, NY
37,287
Population
18,653
Households
2
Avg Household Size
37
Median Age
25%
College-Educated
90%
High-School Grad
140.8 sq mi
ZIP Area
265
Density / Sq Mi
$57,503
Median Household Income
$37,061
Median Earnings
$974
Median Rent
$170,100
Median Home Value
Check the figures for this property
Cap Rate, Value Estimation, Potential NOI and more
View Realmo Analytics
Market
Vacancy Rate% for Multifamily in Northeast region

Questions? Ask Rey
Realmo’s AI knows this listing — price, zoning, demand, history. Ask anything.






Frequently Asked Questions
What type of property is this?
Duplex - Side-by-side units include private entrances, dedicated yard areas, dry basements, and additional off-street parking.
Where is this duplex located?
The property is located at 214 /218 Charles St Watertown, NY.
What is the asking price?
The asking price for this property is $169,900.
What are key features of this property?
This property features: 1,694‑square‑foot duplex built in 1919; Two side‑by‑side units, each with 2 bedrooms and 1 bathroom; Separate utilities with 150 amp service for each unit


