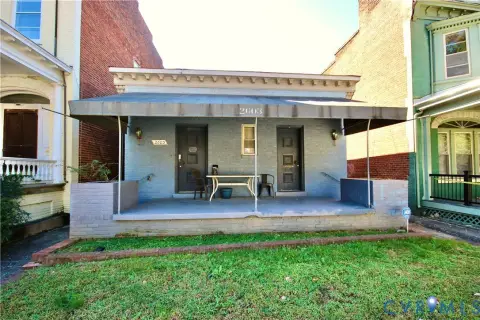
Renovated Mixed-Use Storefront
For Sale
$775,000
2523 W Main St, Richmond, VA 23220
Commercial frontage and a two-bedroom apartment combine in a renovated building within Richmond’s Historic Fan District.
Property Size2,394 SF
Price / SF$323.73
Days on Market48
Property Features for 2523 W Main St
General Information
Standard status
Active
Size
2,394 SF
Property subtype
Multi-Family
Site & Location
Neighborhood
Fan
Building Details
Year Built
1920
Year Renovated
2020
Buildings
1
Tenancy
Multi
Listing Agency:
Lake Anna Island Realty
(540) 894-4400
Listed By:
The Elliott Real Estate Team
(804) 404-5566
Source:
Elliottreteam
Added: Sep 9
Changed: Oct 23
Last Checked: Oct 24 at 4:22PM
Displayed information is deemed reliable but is not guaranteed and should be independently verified. All listing content including descriptions, pricing, images are the copyrighted material of Lake Anna Island Realty

Ask AI about this property
Review the available facts, identify missing information and prepare questions for the agent.
Investment Insights
Based on property information with market context.
This 2,394-square-foot mixed-use building combines a commercial storefront with a second-floor two-bedroom apartment. Constructed in 1920 and extensively updated in 2020, the property includes a 5-ton HVAC unit, refreshed interior paint, refinished hardwood floors, a new kitchen, and replacement windows.
The commercial portion is leased to Cocky Rooster through March 10, 2030, with one additional five-year option. The commercial occupant pays its share of taxes, insurance, utilities, and maintenance. The property is positioned along W Main St in Richmond’s Historic Fan District, within walking distance of Carytown, Byrd Park, Robinson St, Main Street, and the Virginia Museum of Fine Arts.
The commercial portion is leased to Cocky Rooster through March 10, 2030, with one additional five-year option. The commercial occupant pays its share of taxes, insurance, utilities, and maintenance. The property is positioned along W Main St in Richmond’s Historic Fan District, within walking distance of Carytown, Byrd Park, Robinson St, Main Street, and the Virginia Museum of Fine Arts.
Key Highlights
- 2,394‑square‑foot mixed‑use building with commercial storefront and second‑floor apartment
- Two‑bedroom residential unit located on the second floor
- Commercial lease with Cocky Rooster runs through March 10, 2030
Financial Insights
Estimated NOI and Cap Rate
NOI / Yr
$31,059
Cap Rate
4.01%
Suggested Prices Based on Cap Rates
Cap Rate 5%
$621,180
$621.2K
Cap Rate 7%
$443,700
$443.7K
Cap Rate 9%
$345,100
$345.1K
Market Conditions
NOI Build-Up for 2,394 SF
Gross rent
$44.5K $18.60/SF
− Vacancy
−$3.1K −$1.30/SF
EGI
$41.4K $17.30/SF
− OpEx
−$10.4K −$4.32/SF
NOI
$31.1K $12.97/SF
Area
Richmond, VA
Vacancy
7.00%
Lease Rate
$18.60 /SF/Yr
Expense Ratio
25.00%
Simulate Cap Rate and NOI
Suggested Prices Based on Cap Rates
Cap Rate 5%
$621,180
Cap Rate 7%
$443,700
Cap Rate 9%
$345,100
Alternative Uses
Best Use
Specialty Retail
$443.7K
$388.2K – $517.7K
NOI $31,059 @ 7.0% cap · market cap 4.01%
Second Best
Mixed Use
$427.1K
$373.7K – $498.3K
NOI $29,895 @ 7.0% cap · market cap 3.86%
Theoretical Best
Office A
$553.1K
$484.0K – $645.3K
NOI $38,717 @ 7.0% cap · market cap 5.00%
Zoning and permitted uses should be independently verified with authorities.
How Realmo checks its estimates
Property Analytics
Unlock full access to Insights
Subscribe to Realmo Intelligence
Open Analytics
Current Use
Lease Details
Multi-tenant
Tenancy
Location Intelligence
Trade Area within ½ mile
1,901
Businesses Nearby
Explore this area
Business Placement
Demographics for 23220, VA
36,942
Population
16,561
Households
2.2
Avg Household Size
27
Median Age
59%
College-Educated
94%
High-School Grad
4.8 sq mi
ZIP Area
7,696
Density / Sq Mi
$56,681
Median Household Income
$33,249
Median Earnings
$1,354
Median Rent
$468,900
Median Home Value
Check the figures for this property
Cap Rate, Value Estimation, Potential NOI and more
View Realmo Analytics
Market
Vacancy Rate% for Retail in Richmond, VA




Frequently Asked Questions
What type of property is this?
Mixed-use property - Commercial frontage and a two-bedroom apartment combine in a renovated building within Richmond’s Historic Fan District.
Where is this mixed-use property located?
The property is located at 2523 W Main St Richmond, VA.
What is the asking price?
The asking price for this property is $775,000.
What are key features of this property?
This property features: 2,394‑square‑foot mixed‑use building with commercial storefront and second‑floor apartment; Two‑bedroom residential unit located on the second floor; Commercial lease with Cocky Rooster runs through March 10, 2030


