Remodeled Residential Income
For Sale
$445,000
2122 Ronda Granada, Laguna Woods, CA 92637
Laguna Woods, CA
Property Size1,009 SF
Lot Size0.02 Acres
Price / SF$441.03
Days on Market143

Ask AI about this property
Review the available facts, identify missing information and prepare questions for the agent.
Property Features for 2122 Ronda Granada
General Information
Property type
Residential Multi Family
Property subtype
Other
Property condition
Under Construction
Bedrooms
2
Bathrooms
2
Rooms
Bathroom 1, Bathroom 2, Bedroom 2, Bedroom 1, Laundry Room, Kitchen
Parking
1
Parking features
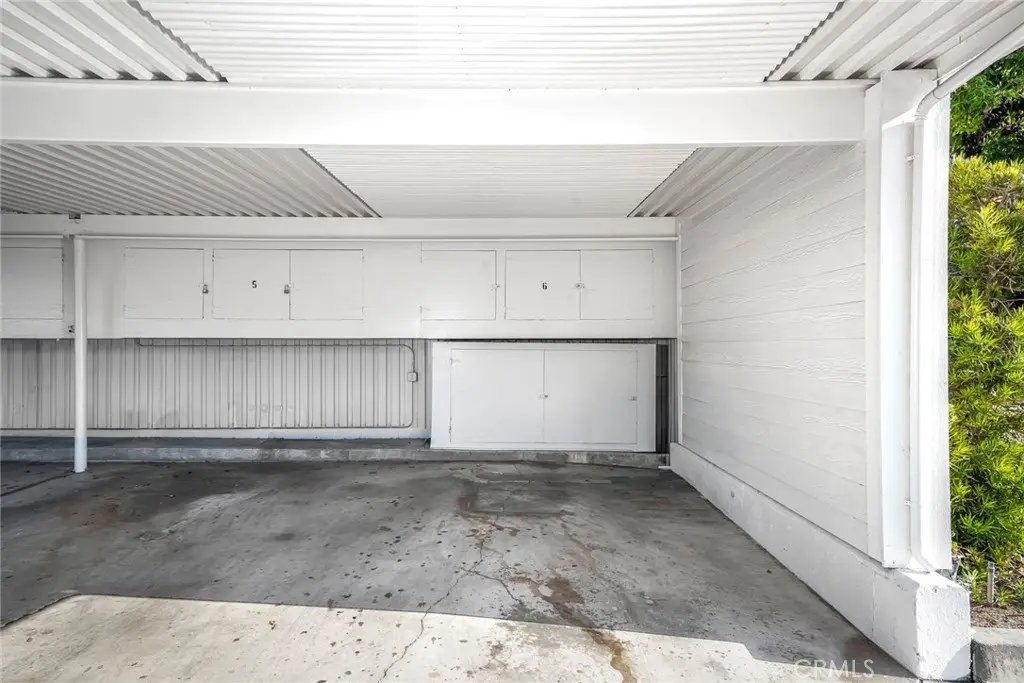
Carport, Covered, Guest, Assigned
Spa
1
Window features
Plantation Shutters, Skylight(s), Double Pane Windows, Screens
Patio and Porch features
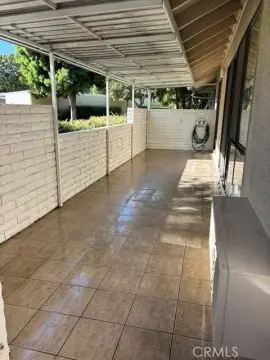
Patio
Interior features
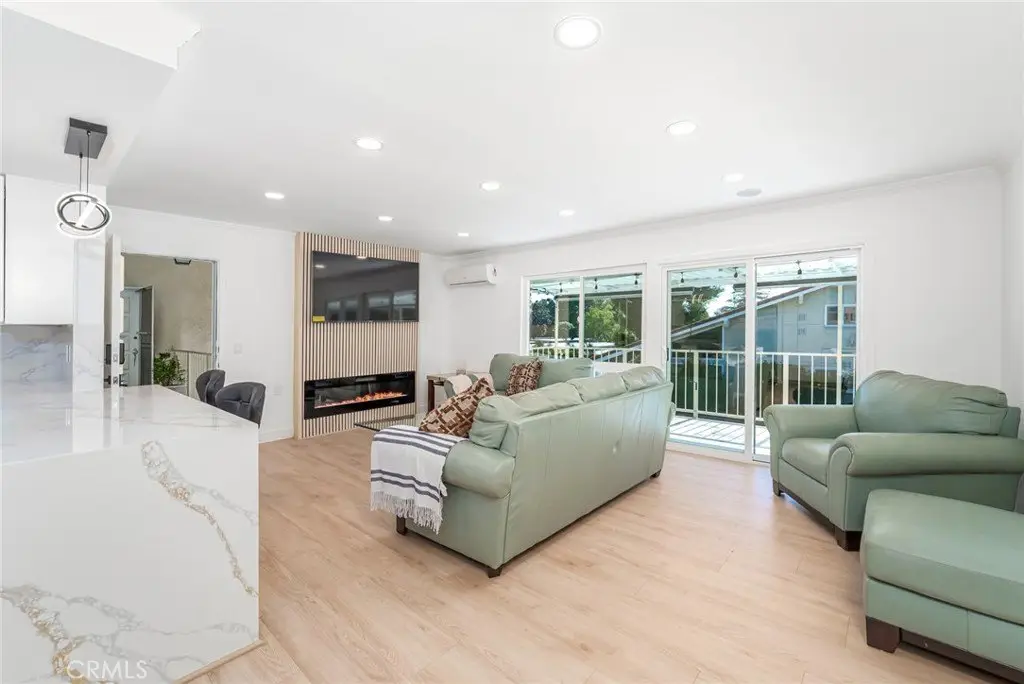
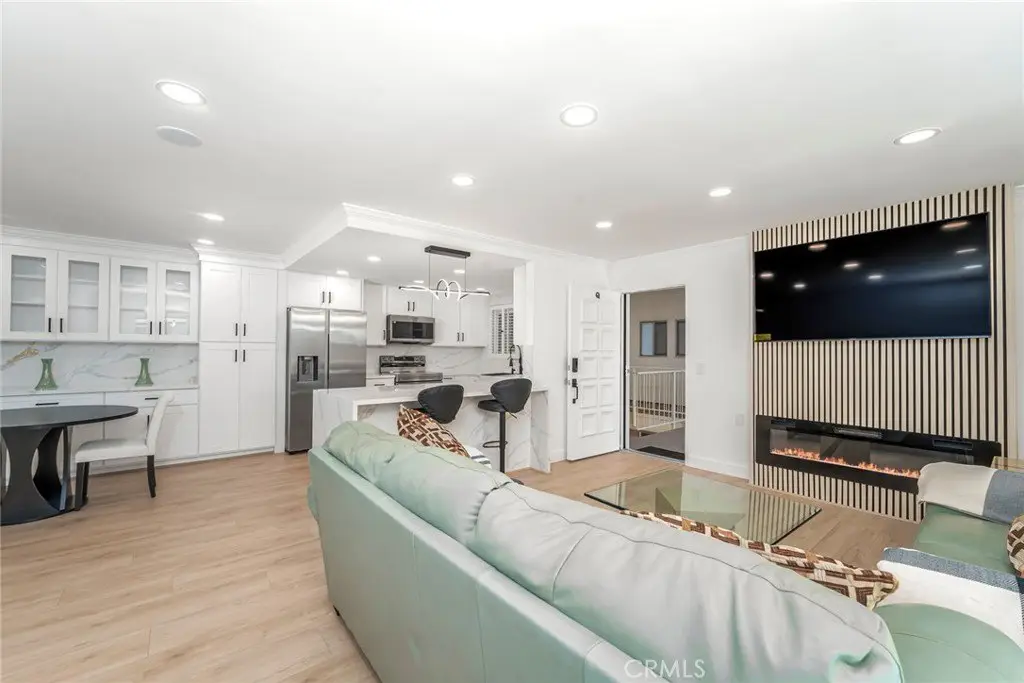
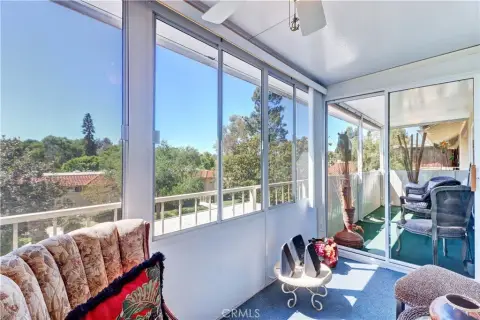
Crown Molding, Balcony, Quartz Counters, Built-in Features, Living Room Balcony, Ceiling Fan(s), Recessed Lighting, Open Floorplan, Wired for Sound
Fireplace
1
Appliances
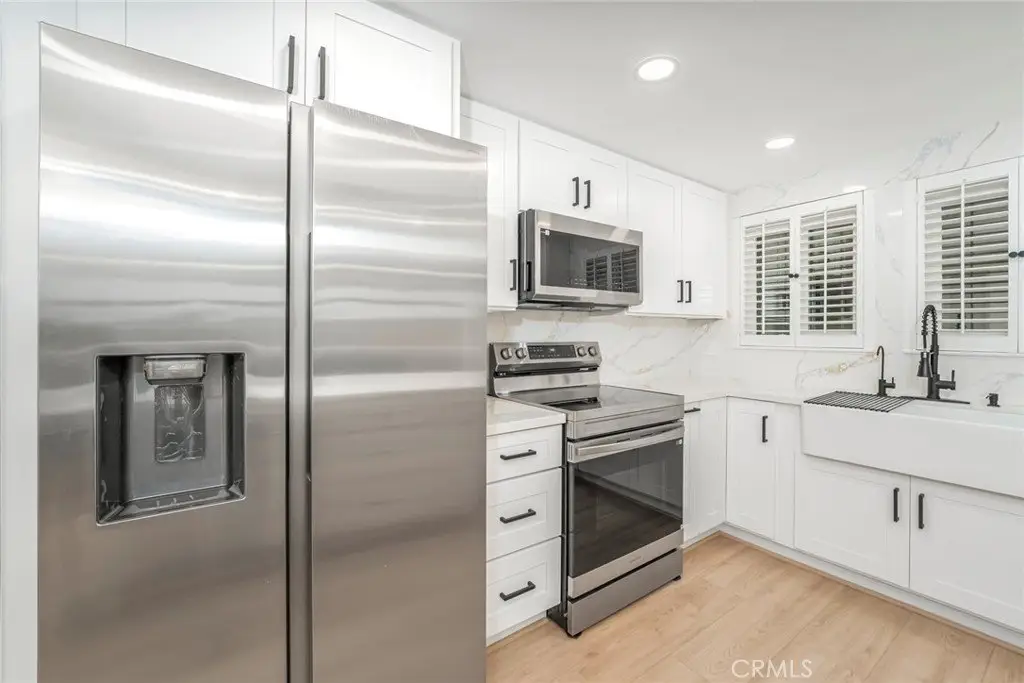
Electric Oven, Electric Water Heater, Electric Cooktop, Water Purifier, Water Line to Refrigerator, Ice Maker, Built-In Range, Self Cleaning Oven, Refrigerator, Electric Range, Disposal, Dishwasher, Microwave, Water Heater
Subdivision
Leisure World (LW)
Lot features
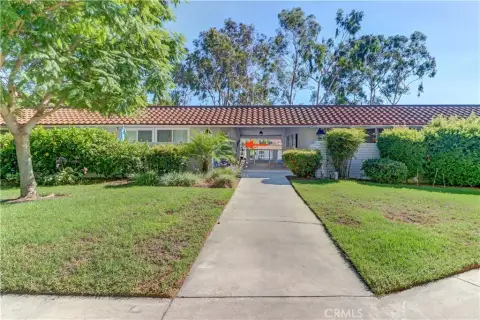
Cul-De-Sac
View
Park
Elementary school district
Saddleback Valley Unified
Middle school district
Saddleback Valley Unified
High school district
Saddleback Valley Unified
Directions
Enter gate 5 to Via Mariposa, turn right to Ronda Granada, Turn right to Cul de sac 209, turn left, follow to the back parking area
Standard status
Active
APN
61605112
Size
1,009 SF
Lot size
0.02 Acres
Taxes and HOA fees
HOA Fee
$827 Monthly
Utilities
Utilities
Cable Available
Sewer type
Public Sewer
Heating system
Space Heater, Electric (Heating), Ductless (Heating), Zoned
Cooling system
Ductless, Electric, Zoned
Water source
Public
Amenities
electric fireplace
Bluetooth speakers
split-system AC
dual-pane windows
sliding glass doors
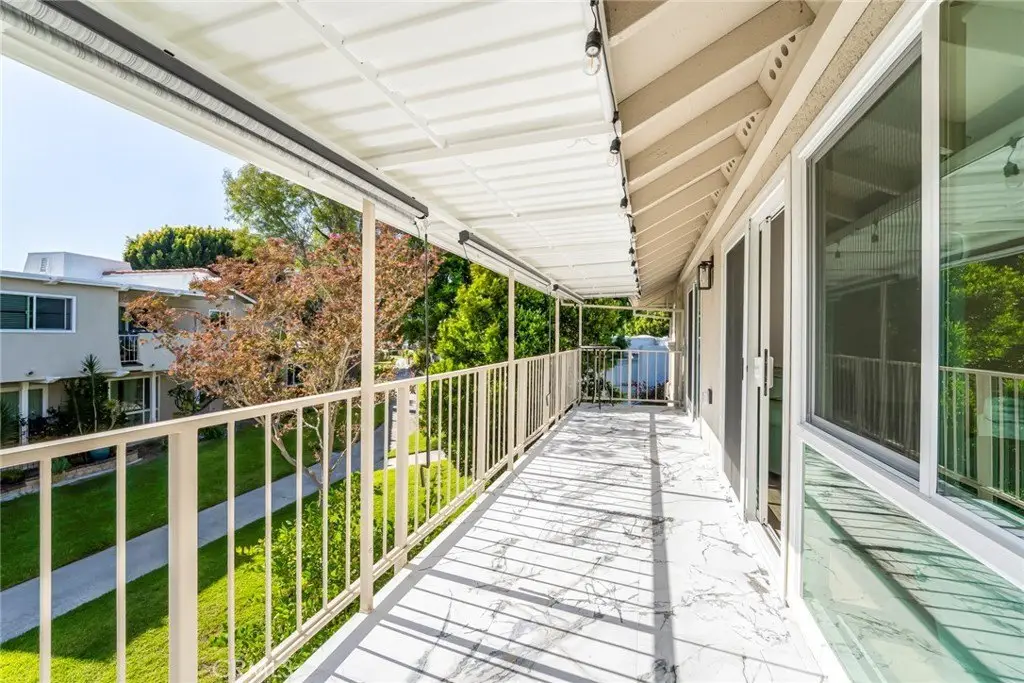
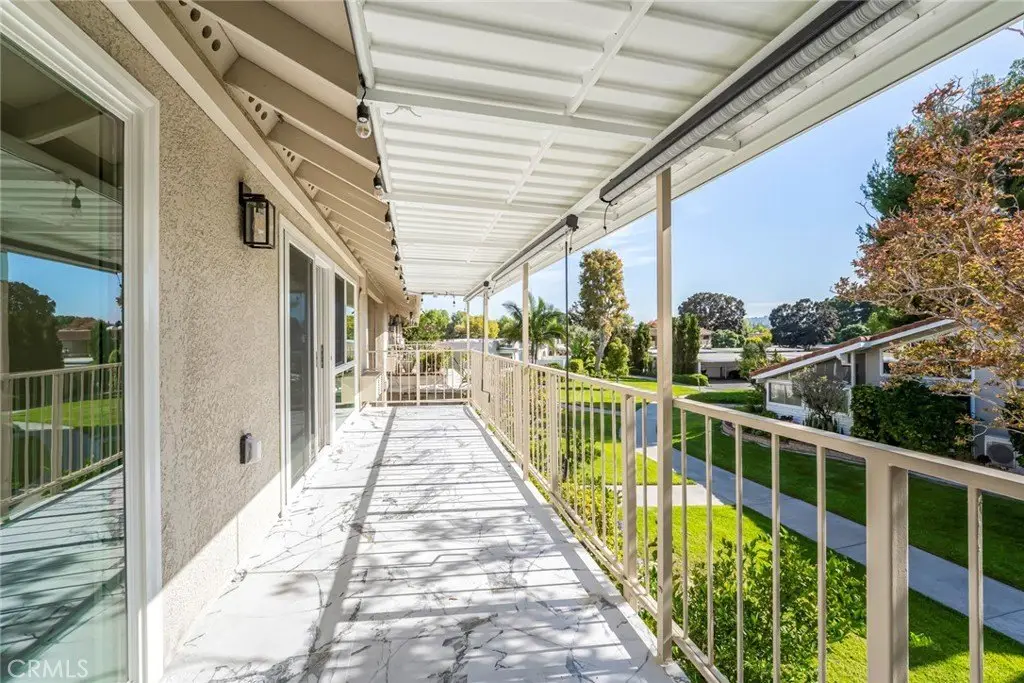
covered balcony
designer kitchen
stainless steel appliances
wine cooler
plantation shutters
washer/dryer
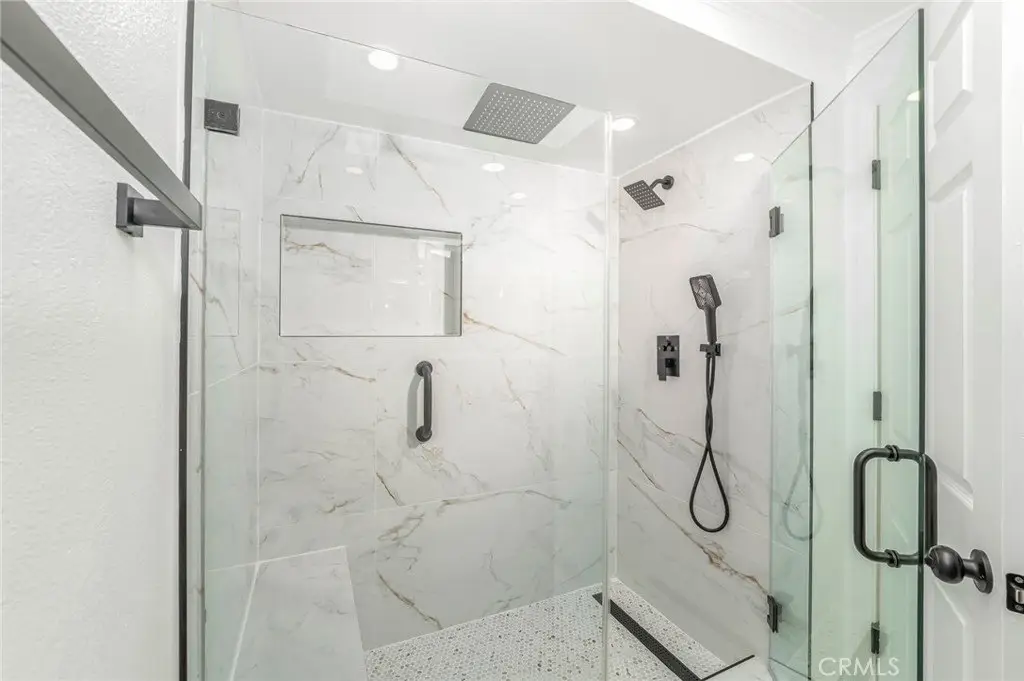
walk-in shower
rainfall showerhead
LED-lit mirrors
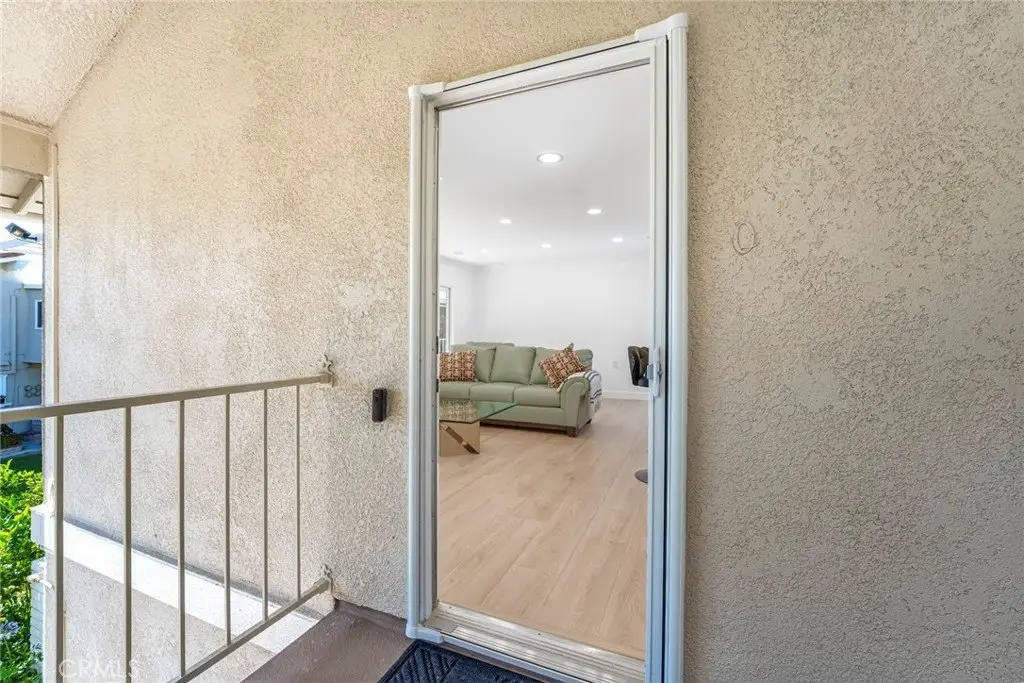
invisible-screen front door
ceiling fan
TV
Building Details
Year built
1965
Floors in Building
1
Number of units
8
Flooring type
Vinyl
Roof type
Flat
Architectural style
Modern
Listing Agency:
Laguna Premier Realty Inc.
(949) 900-6930
Listed By:
Bob DePew · License #02057870
(714) 350-6565
Added: May 26
Changed: Oct 13
Last Checked: Oct 15 at 6:06PM
MLS# OC26121402
Copyright © 2026 California Regional Multiple Listing Service, Inc. All rights reserved. All information provided by the listing agent/broker is deemed reliable but is not guaranteed and should be independently verified.
Investment Insights
Based on property information with market context.
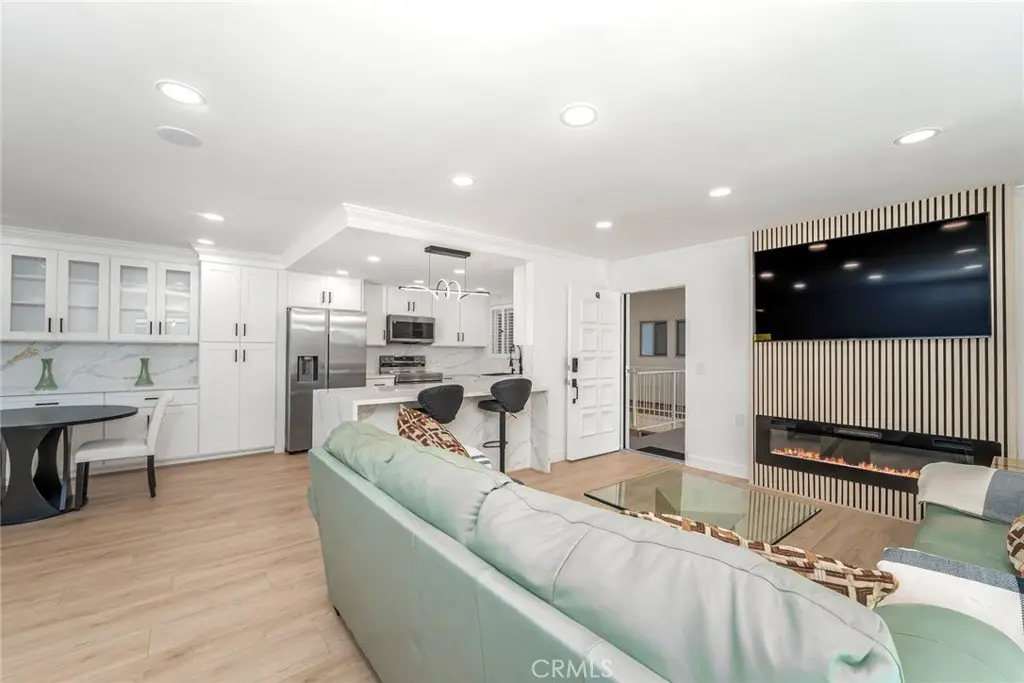
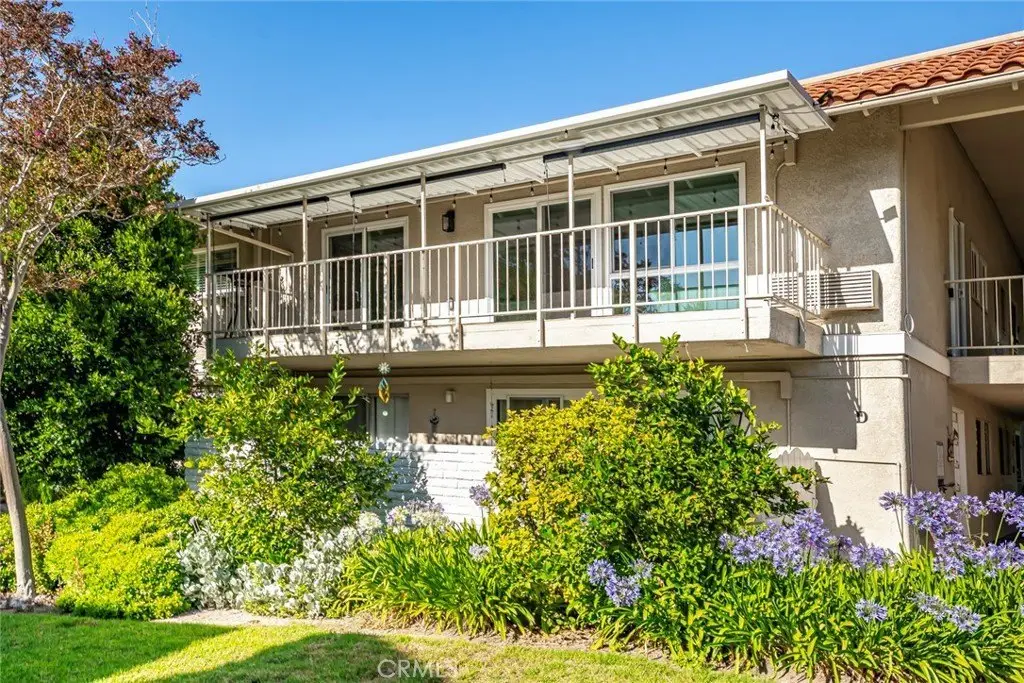
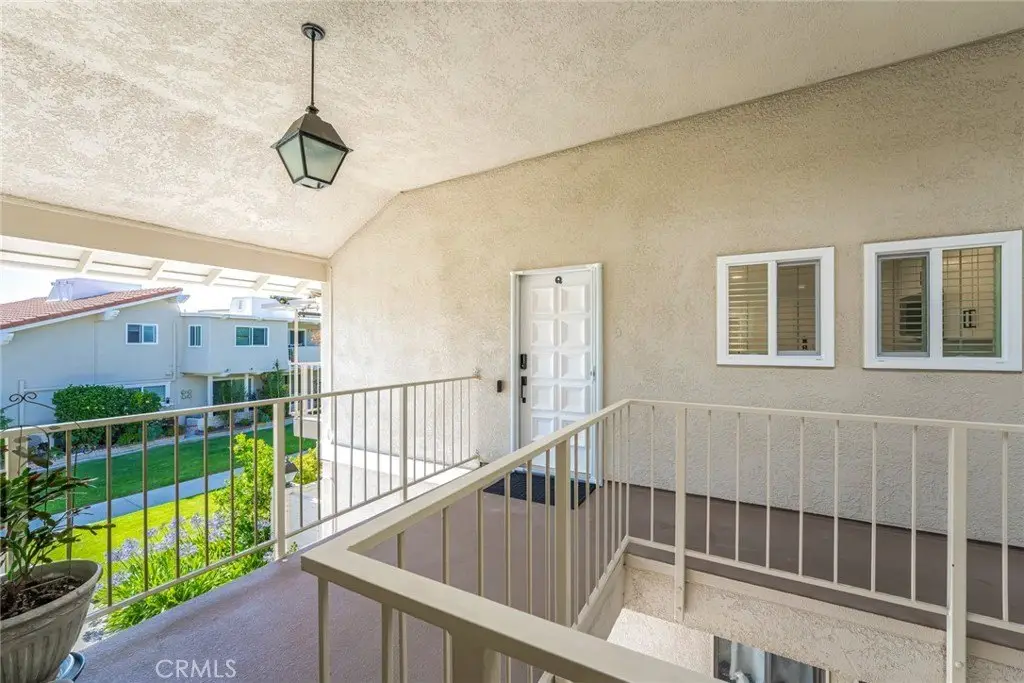
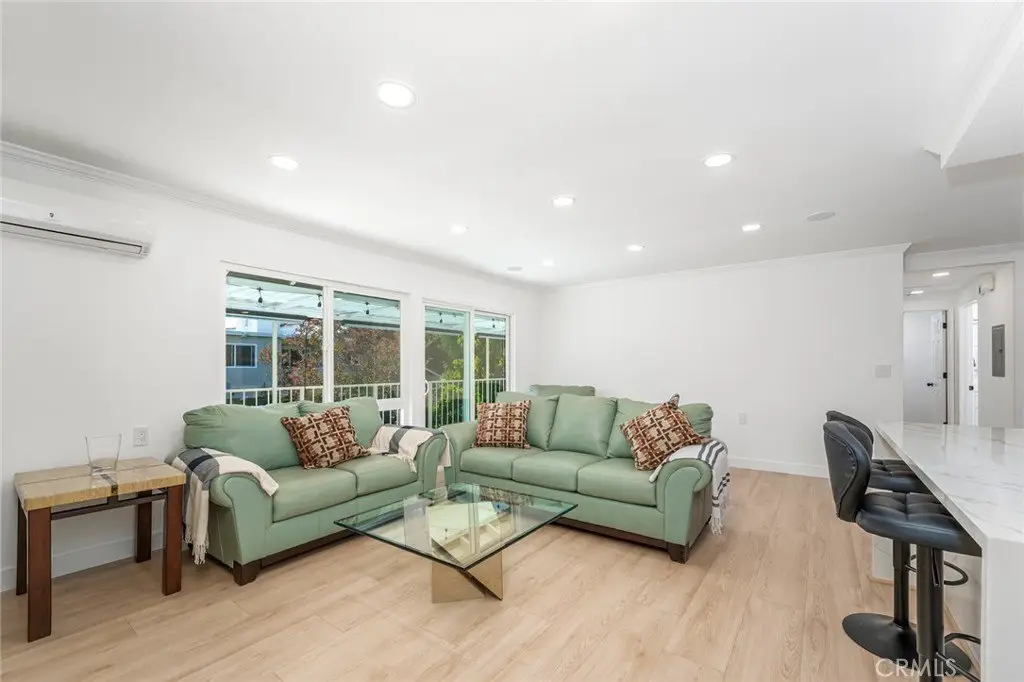
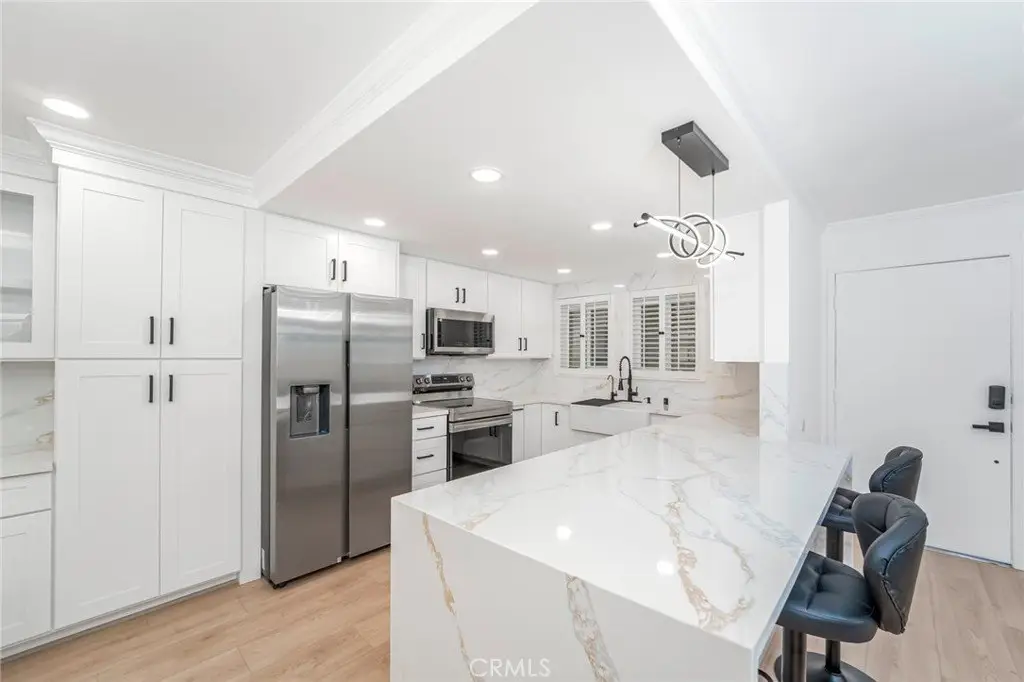
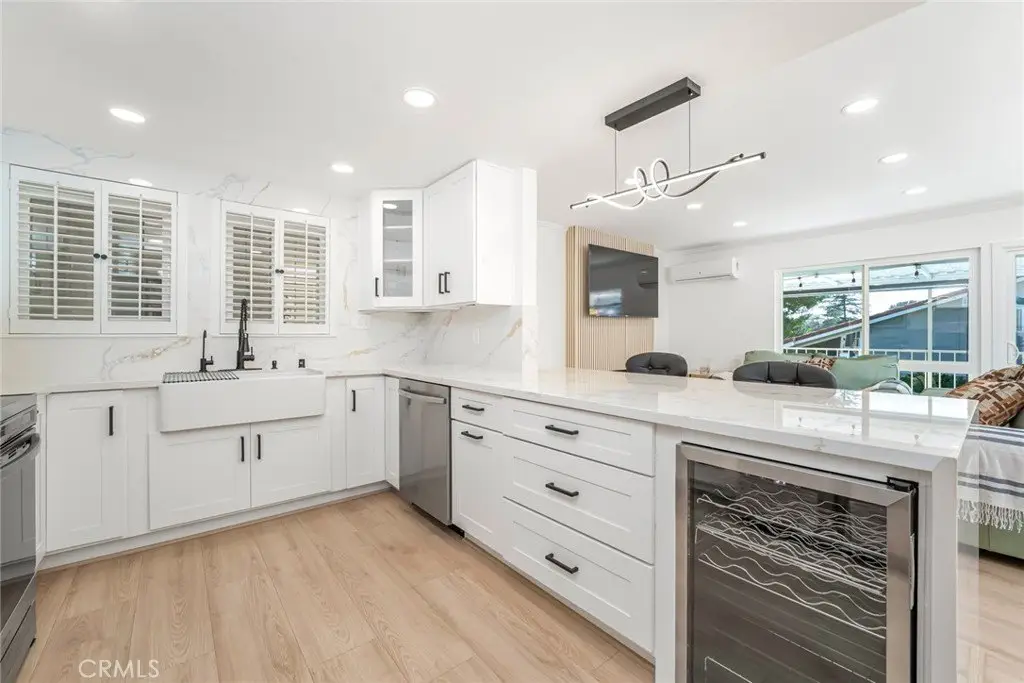
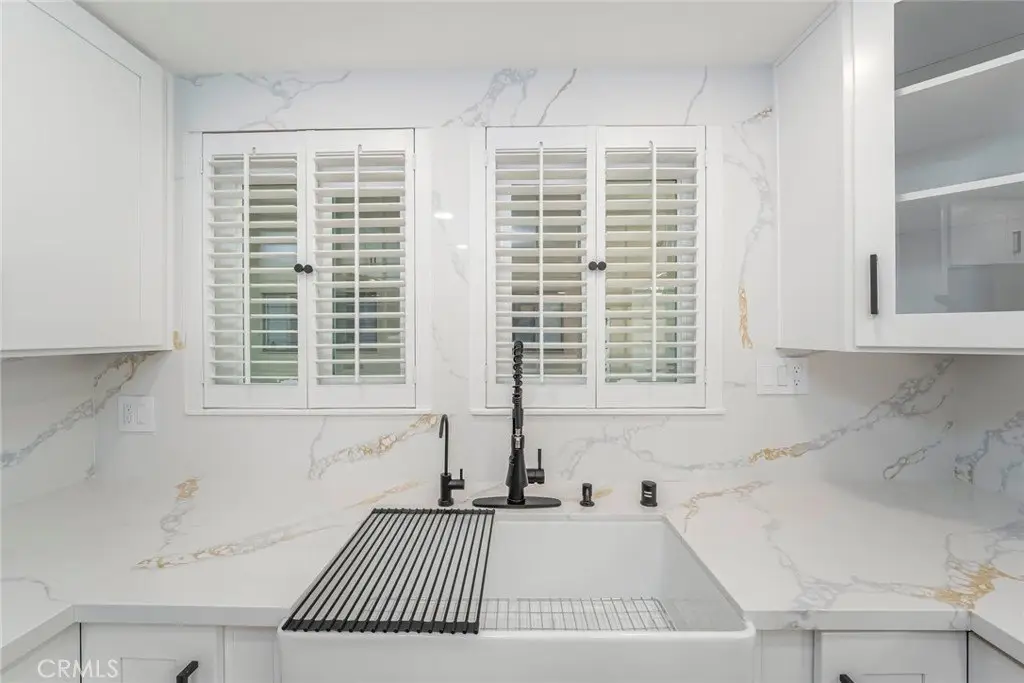
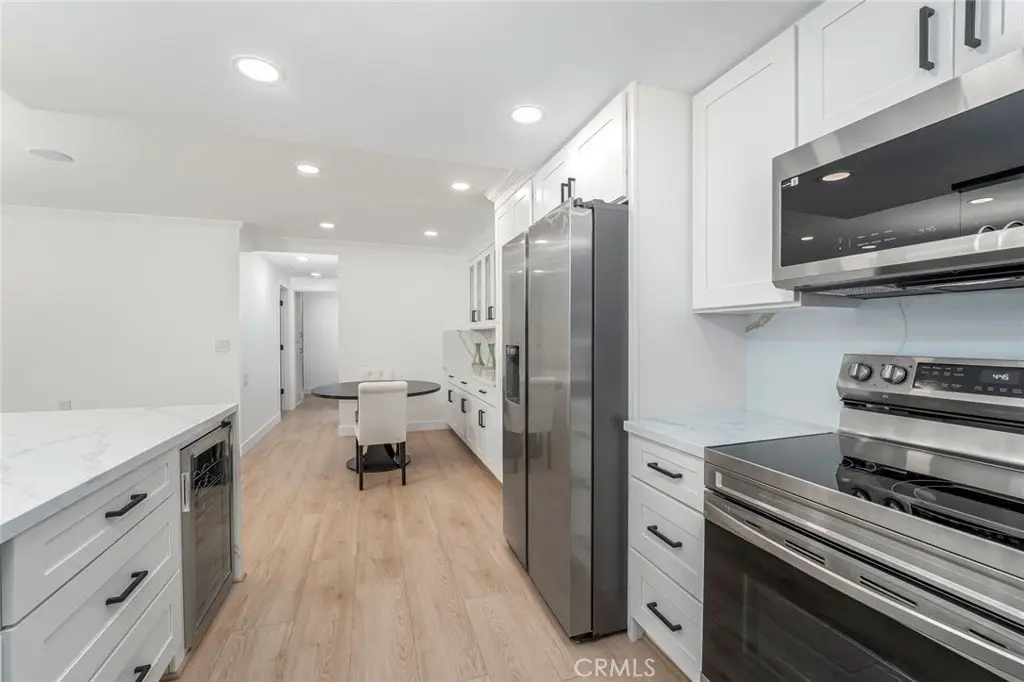
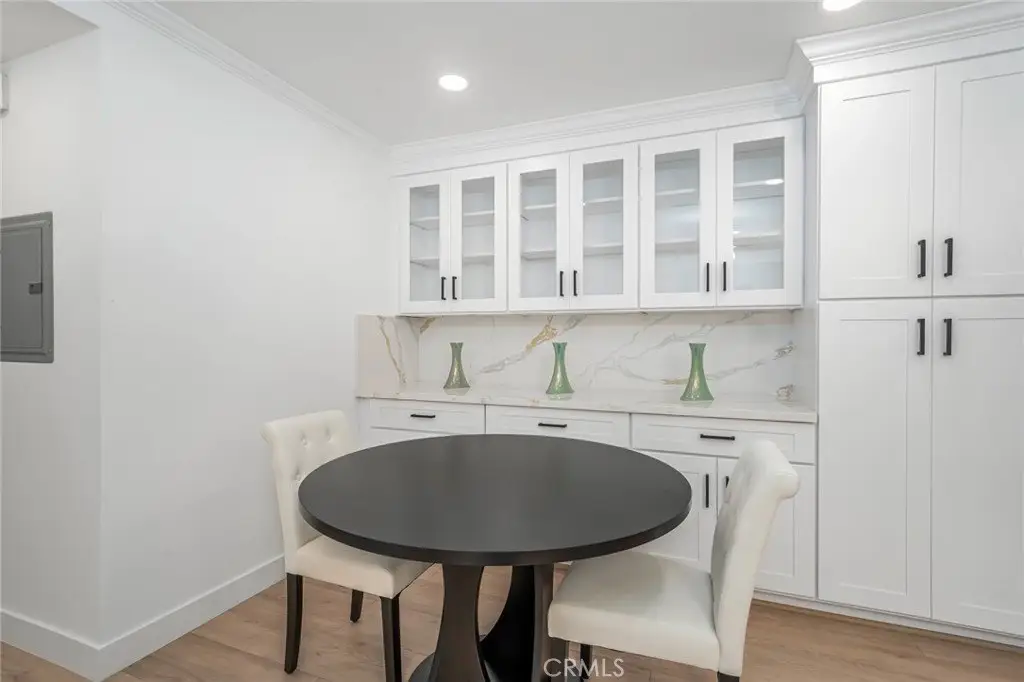
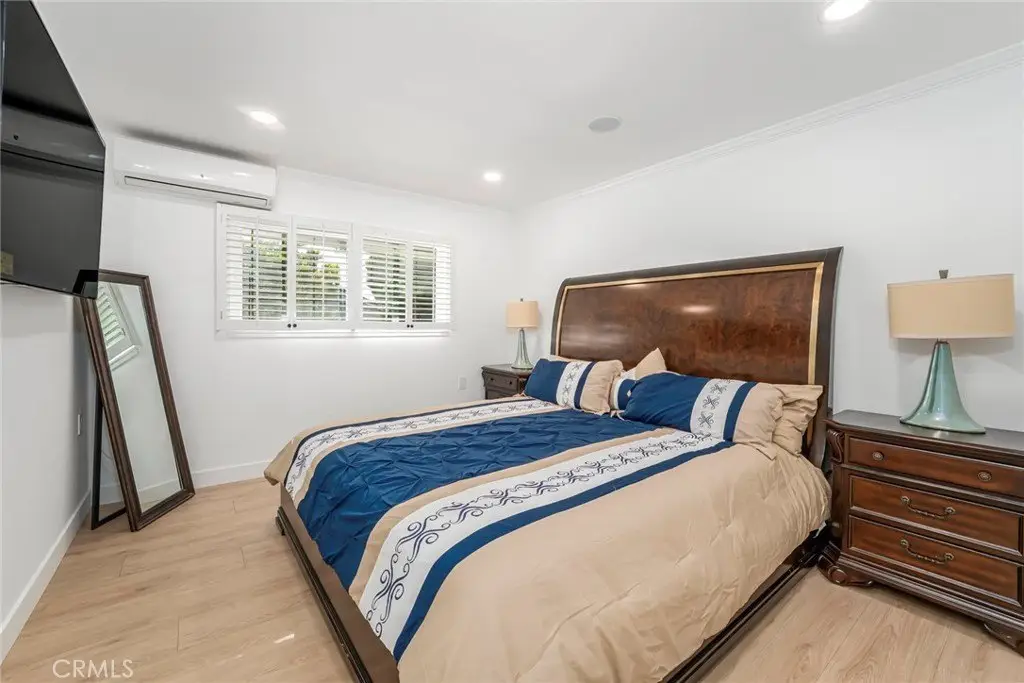
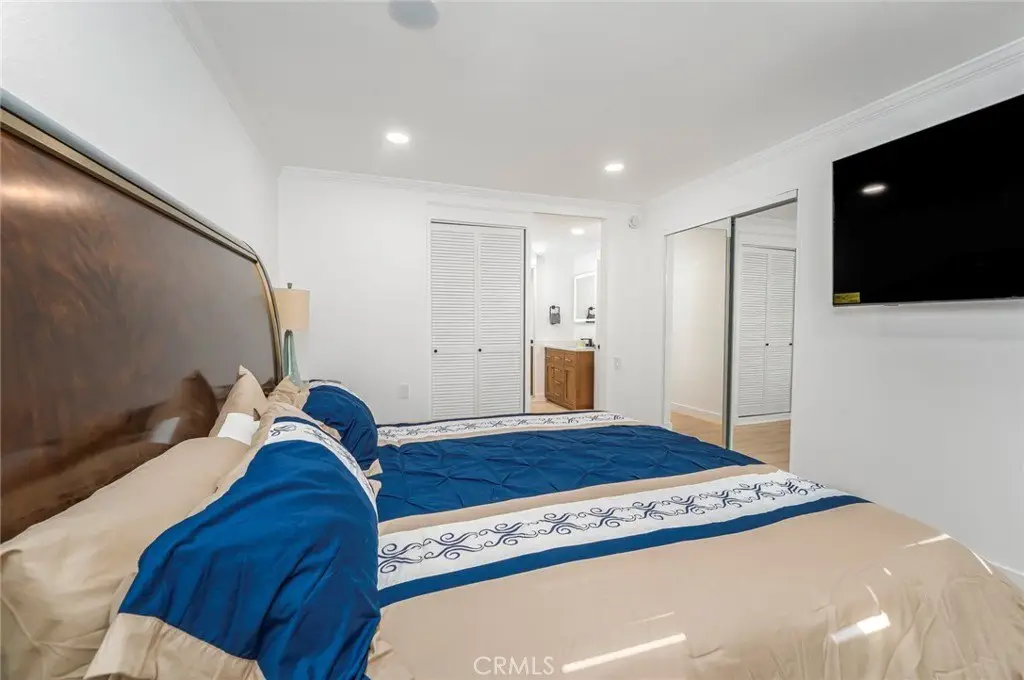
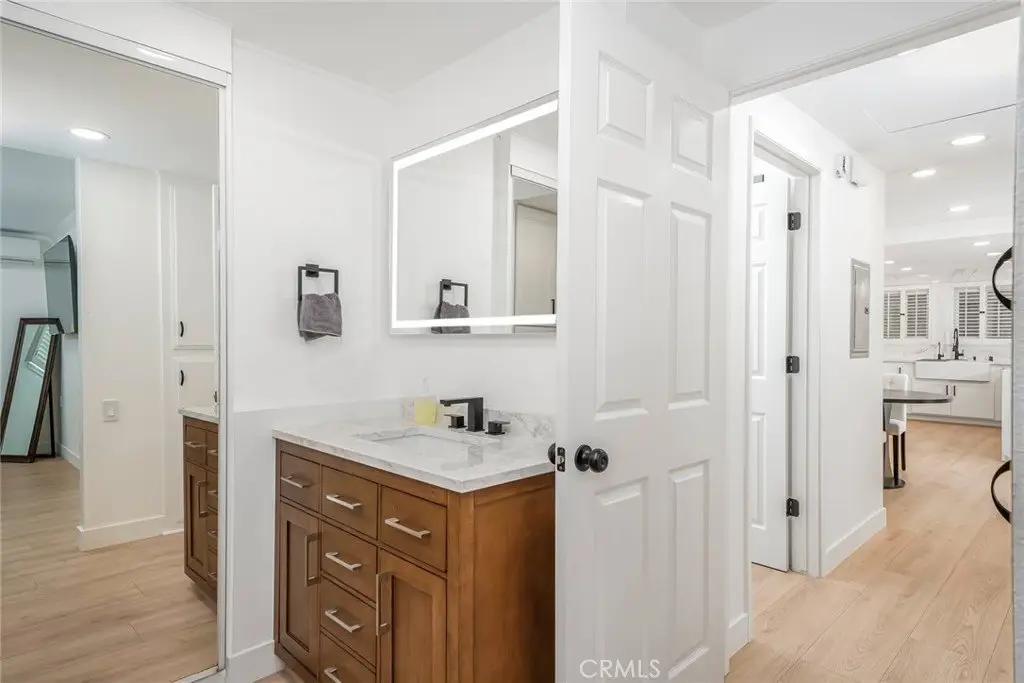
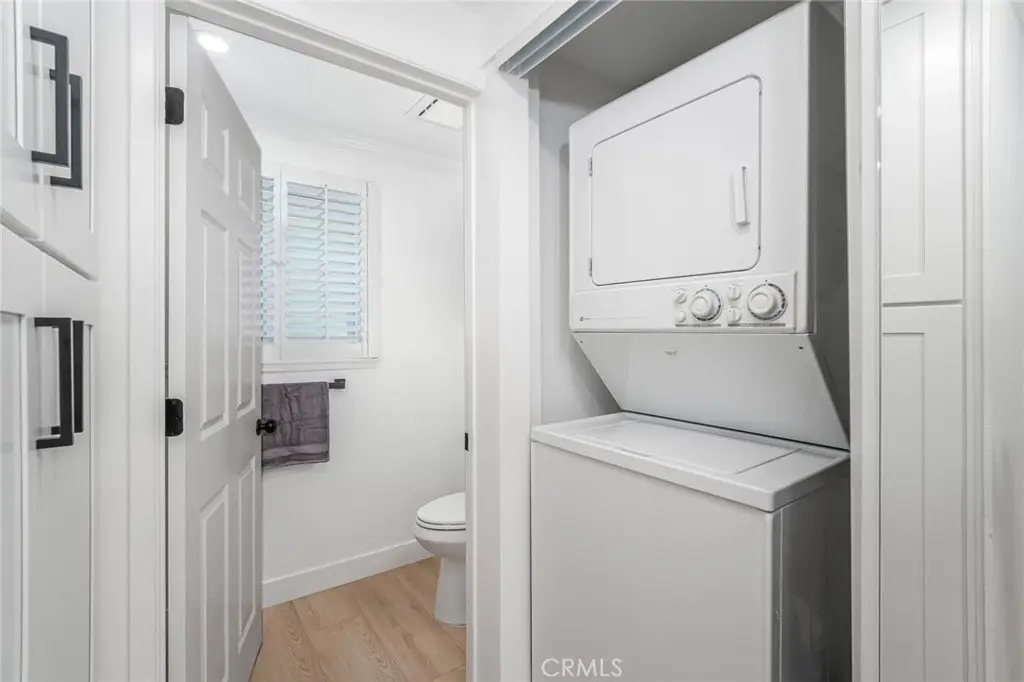
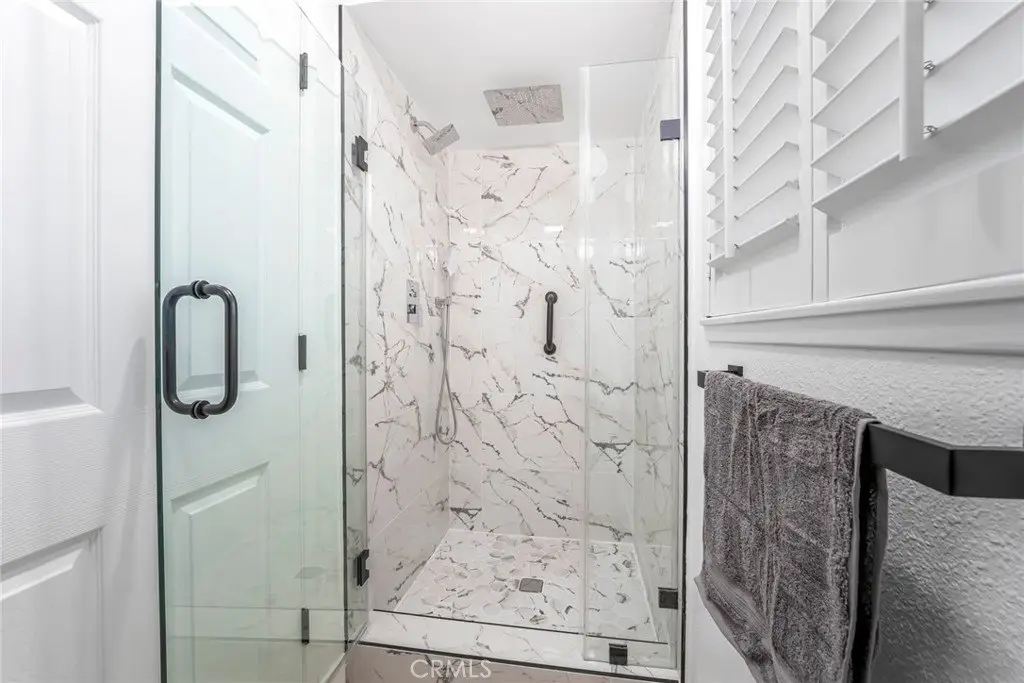
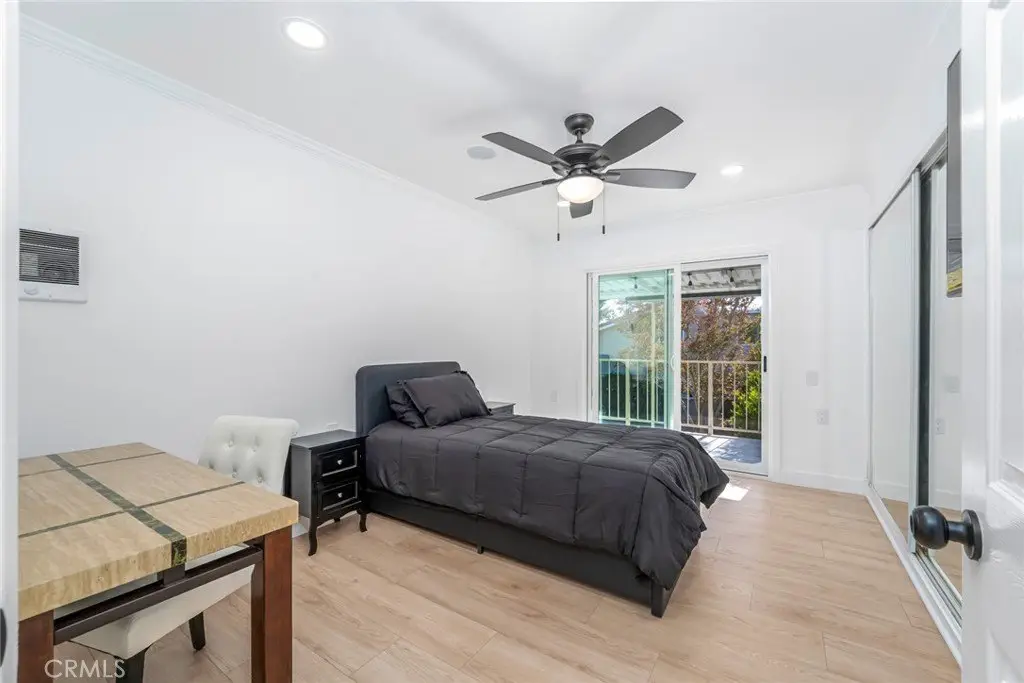
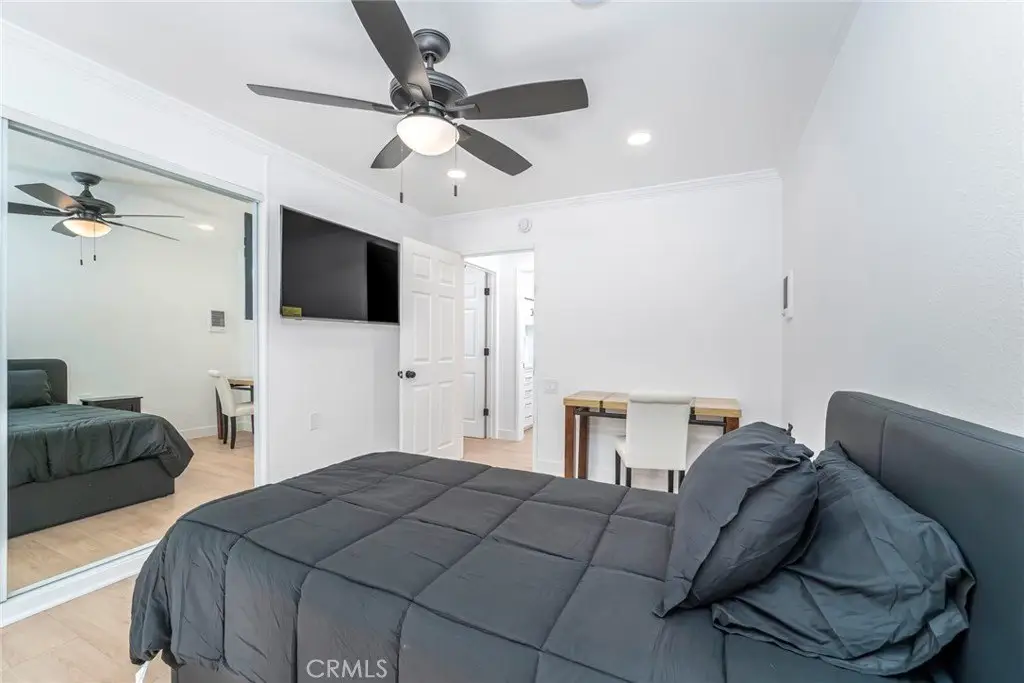
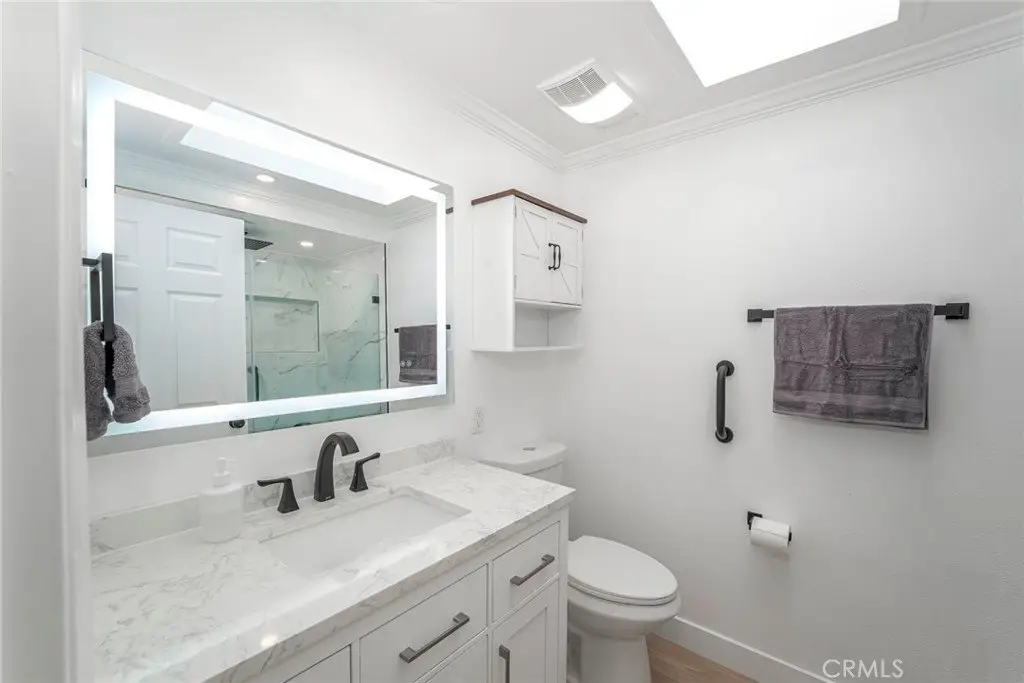
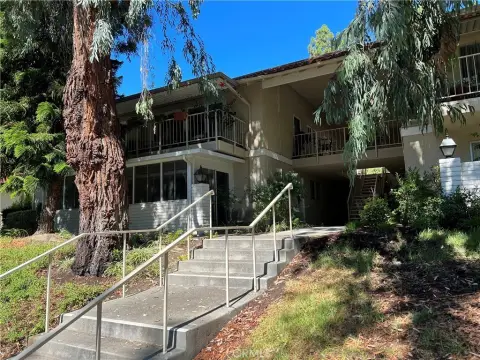
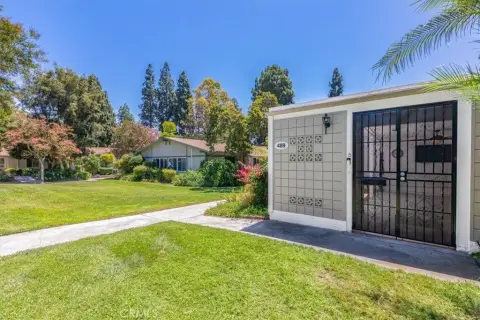
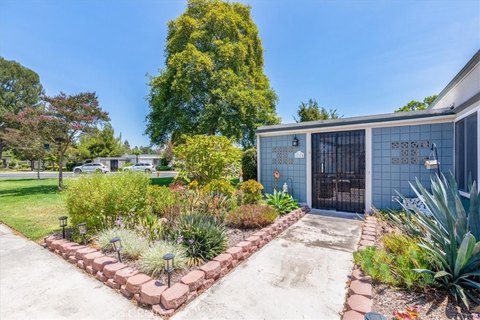
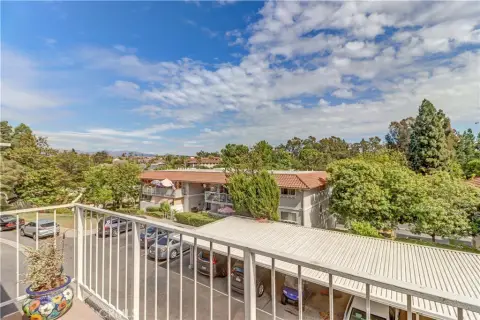
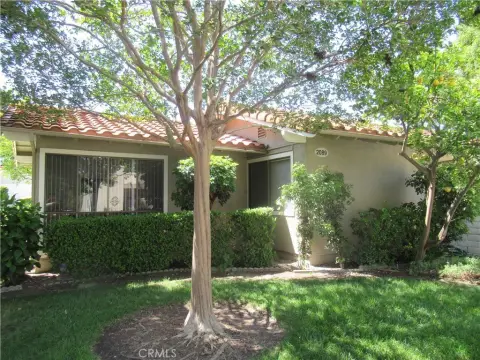
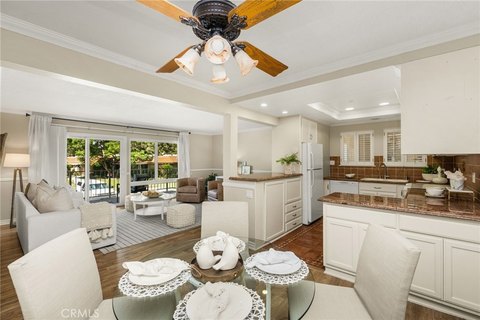
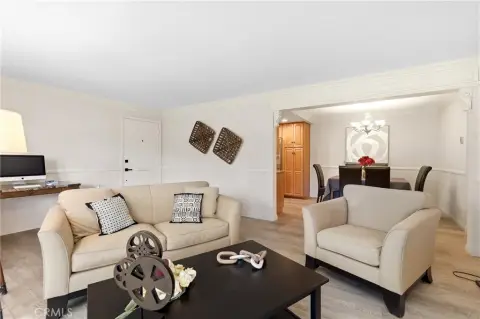
This upper-level residential property offers 1,009 square feet with two bedrooms and two bathrooms in a modern, extensively renovated configuration. The open living area includes luxury vinyl flooring, recessed LED lighting, a textured media wall, electric fireplace, Bluetooth speakers, split-system AC, and access to a covered balcony. The kitchen combines white shaker cabinetry, quartz counters and backsplash, a waterfall peninsula, stainless steel appliances, a farmhouse sink, pantry storage, and a wine cooler. Both bathrooms feature quartz vanities and upgraded walk-in showers with large-format tile; the primary suite also includes two closets and dual-pane windows. A stacked Maytag washer and dryer, upgraded doors and hardware, a new electrical panel, plantation shutters, and balcony shades add to the improvements.
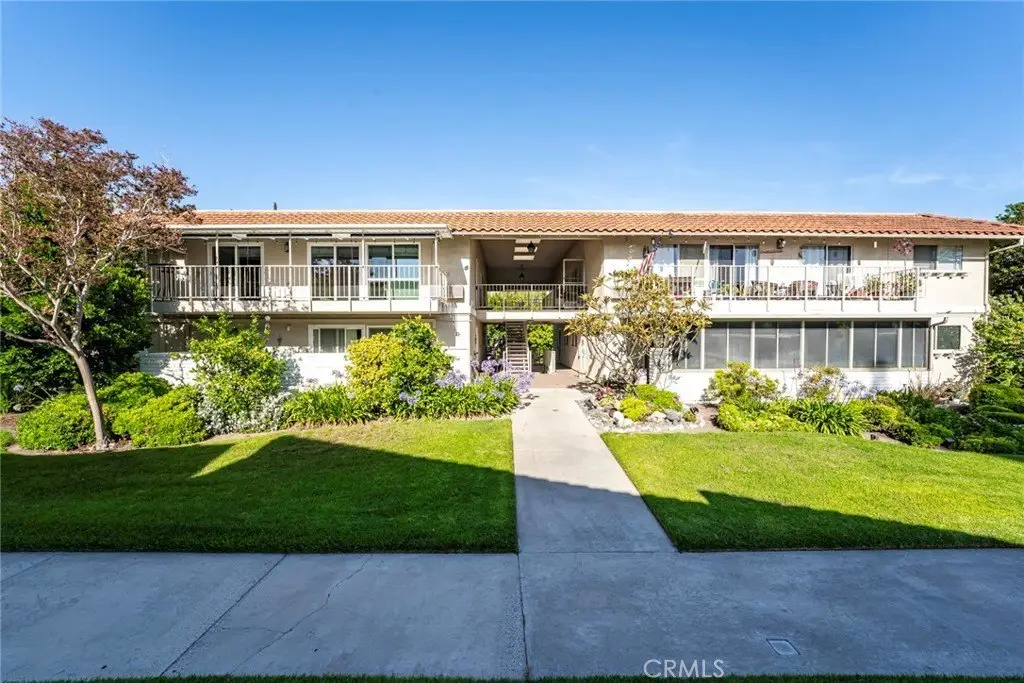
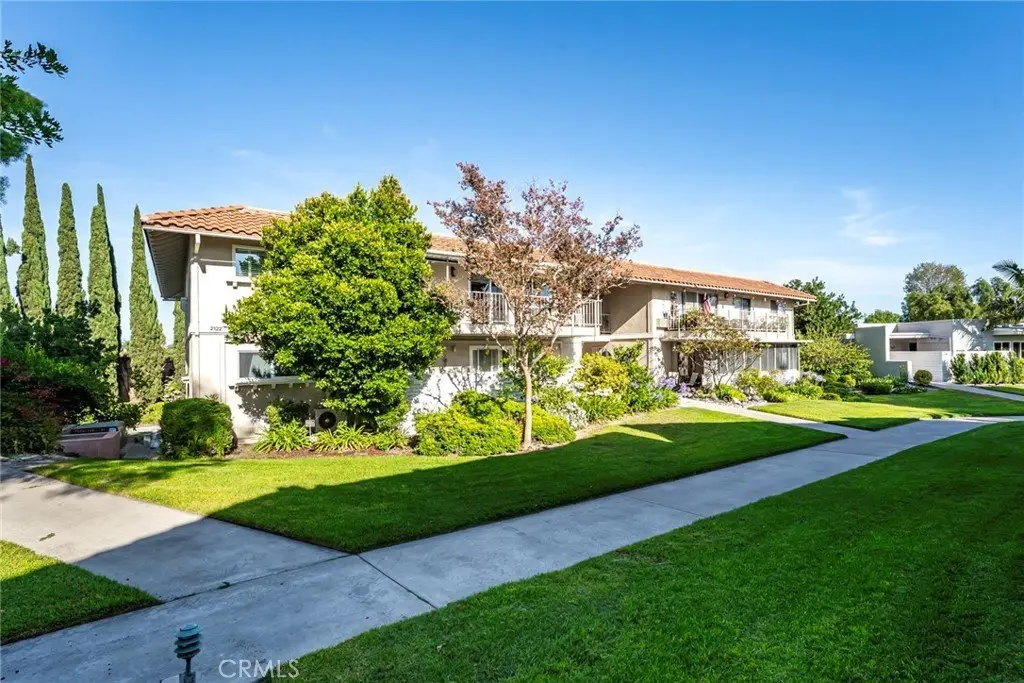
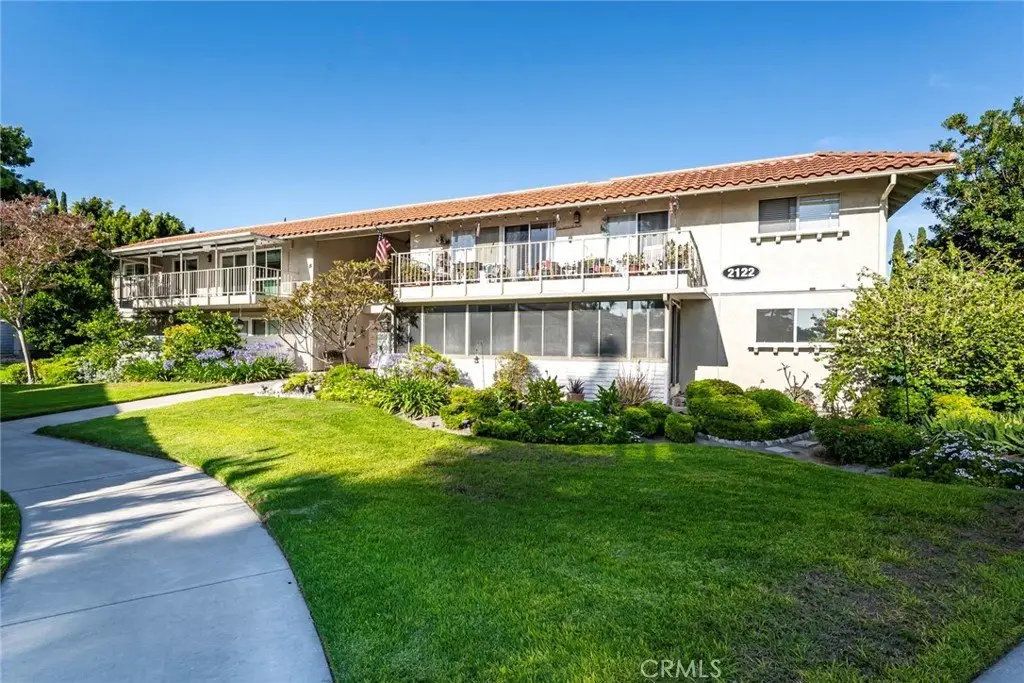
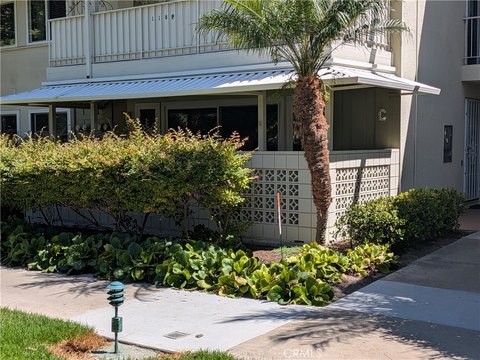
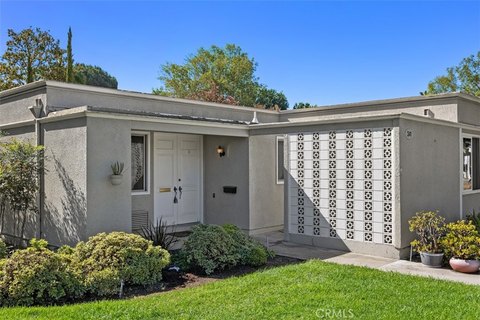
The property is located within Laguna Woods Village, a 55+ active-adult community. Additional features include assigned covered parking, guest parking, public water, public sewer, and cable availability. The home was built in 1965 and has a flat roof, ductless zoned heating, and ductless zoned cooling.
The property is located within Laguna Woods Village, a 55+ active-adult community. Additional features include assigned covered parking, guest parking, public water, public sewer, and cable availability. The home was built in 1965 and has a flat roof, ductless zoned heating, and ductless zoned cooling.
Key Highlights
- 1,009‑square‑foot upper‑level home with 2 bedrooms and 2 bathrooms
- Extensively renovated kitchen with quartz waterfall peninsula and stainless steel appliances
- Both bathrooms include upgraded walk‑in showers with large‑format tile
Financial Insights
Estimated NOI and Cap Rate
NOI / Yr
$19,259
Cap Rate
4.33%
Suggested Prices Based on Cap Rates
Cap Rate 5%
$385,180
$385.2K
Cap Rate 7%
$275,129
$275.1K
Cap Rate 9%
$213,989
$214.0K
Market Conditions
NOI Build-Up for 1,009 SF
Gross rent
$36.3K $36.00/SF
− Vacancy
−$1.3K −$1.30/SF
EGI
$35.0K $34.70/SF
− OpEx
−$15.8K −$15.62/SF
NOI
$19.3K $19.09/SF
Area
Orange County, CA
Vacancy
3.60%
Lease Rate
$36.00 /SF/Yr
Expense Ratio
45.00%
Simulate Cap Rate and NOI
Suggested Prices Based on Cap Rates
Cap Rate 5%
$385,180
Cap Rate 7%
$275,129
Cap Rate 9%
$213,989
Alternative Uses
Best Use
Apartment 5plus
$275.1K
$240.7K – $321.0K
NOI $19,259 @ 7.0% cap · market cap 4.33%
Second Best
—
—
no second resolved use
Theoretical Best
Office A
$338.9K
$296.5K – $395.4K
NOI $23,723 @ 7.0% cap · market cap 5.33%
Zoning and permitted uses should be independently verified with authorities.
How Realmo checks its estimates
Property Analytics
Unlock full access to Insights
Subscribe to Realmo Intelligence
Open Analytics
Current Use
Lease Details
1
Residential units
Location Intelligence
Trade Area within ½ mile
2,560
Businesses Nearby
Explore this area
Business Placement
Demographics for 92637, CA
17,644
Population
13,494
Households
1.3
Avg Household Size
75
Median Age
52%
College-Educated
97%
High-School Grad
3.0 sq mi
ZIP Area
5,881
Density / Sq Mi
$60,235
Median Household Income
$40,375
Median Earnings
$2,232
Median Rent
$364,900
Median Home Value
Check the figures for this property
Cap Rate, Value Estimation, Potential NOI and more
View Realmo Analytics
Frequently Asked Questions
What type of property is this?
Residential income property - Upper-level home in a 55+ active-adult community with a covered balcony, upgraded kitchen, and two renovated bathrooms.
Where is this residential income property located?
The property is located at 2122 Ronda Granada Laguna Woods, CA.
What is the asking price?
The asking price for this property is $445,000.
What are key features of this property?
This property features: 1,009‑square‑foot upper‑level home with 2 bedrooms and 2 bathrooms; Extensively renovated kitchen with quartz waterfall peninsula and stainless steel appliances; Both bathrooms include upgraded walk‑in showers with large‑format tile


