Corner Retail Storefront
For Sale
$750,000
2122 Cosgrove Ave, North Charleston, SC 29405
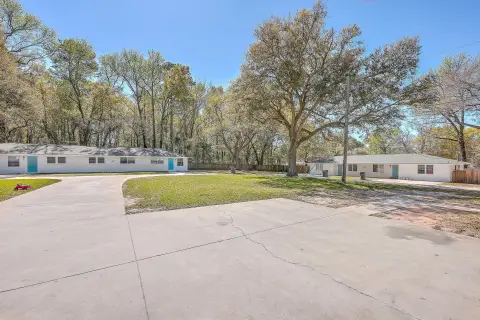
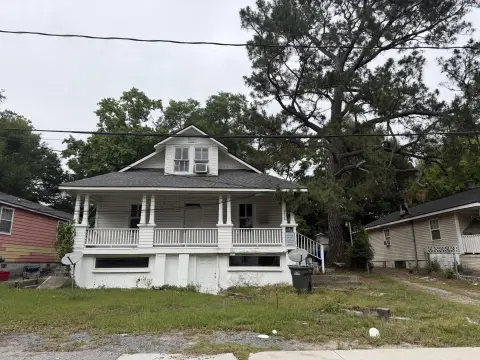
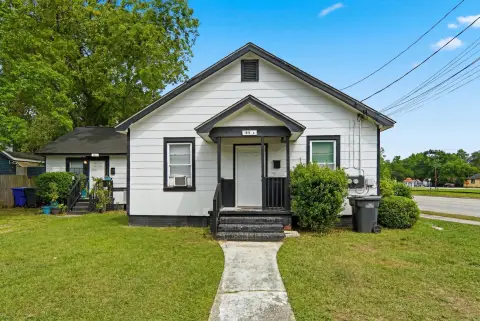
Corner retail site along Cosgrove Avenue with B-1 zoning supporting office, retail, restaurant, and neighborhood service uses.
Property SizeContact for details
Days on Market98
Property Features for 2122 Cosgrove Ave
General Information
Standard status
Active
Property subtype
Land
Listing Agency:
NAI Charleston
Listed By:
Will Sherrod, CCIM · License #79410
(843) 364-3796
Source:
Naicharleston
Added: Jun 22
Changed: Sep 11
Last Checked: Sep 26 at 4:16AM
Displayed information is deemed reliable but is not guaranteed and should be independently verified. All listing content including descriptions, pricing, images are the copyrighted material of NAI Charleston
Investment Insights
Based on property information with market context.
This corner retail storefront totals 2,084 square feet and is offered for sale as a flexible use property within North Charleston. The listing describes the site as positioned for visibility along the Cosgrove Avenue corridor, with exposure enhanced by its corner configuration. Zoning is B-1 Limited Business, which permits a variety of office, retail, restaurant, and neighborhood service uses, giving an owner-user or investor multiple operating paths.
The property is located along the rapidly evolving Cosgrove Avenue corridor, steps from Rivers Avenue. The remarks indicate the site is surrounded by new construction and by significant nearby investments exceeding $2 million, consistent with an area that is actively changing.
For tenants, the B-1 Limited Business designation supports a mix of neighborhood-oriented concepts, including retail and food service, as well as office and neighborhood service operations. For buyers, the combination of a corner retail frontage and a broad zoning range can make the property workable for an owner-operator seeking a straightforward conversion path within the permitted use categories stated in the listing.
The property is located along the rapidly evolving Cosgrove Avenue corridor, steps from Rivers Avenue. The remarks indicate the site is surrounded by new construction and by significant nearby investments exceeding $2 million, consistent with an area that is actively changing.
For tenants, the B-1 Limited Business designation supports a mix of neighborhood-oriented concepts, including retail and food service, as well as office and neighborhood service operations. For buyers, the combination of a corner retail frontage and a broad zoning range can make the property workable for an owner-operator seeking a straightforward conversion path within the permitted use categories stated in the listing.
Key Highlights
- Corner retail site along Cosgrove Avenue in North Charleston
- B‑1 Limited Business zoning allows office, retail, restaurant, and neighborhood service uses
- Located just steps from Rivers Avenue
Property Analytics
Unlock full access to Insights
Subscribe to Realmo Intelligence
Open Analytics
Current Use
Location Intelligence
Trade Area within ½ mile
867
Businesses Nearby
55k
Monthly Visits Nearby
Explore this area
Business Placement
Foot Traffic Nearby
Dining 44%
Shops & Services 36%
Groceries 18%
Electronics 2%
McDonald's
Dining
15,830 visits/mo
0.4 miles
Restaurant Depot
Groceries
9,682 visits/mo
0.4 miles
Family Dollar
Shops & Services
8,151 visits/mo
0.2 miles
Exxon
Shops & Services
6,026 visits/mo
0.4 miles
Church's Chicken
Dining
5,839 visits/mo
0.2 miles
Demographics for 29405, SC
25,620
Population
13,058
Households
2
Avg Household Size
37
Median Age
27%
College-Educated
84%
High-School Grad
14.7 sq mi
ZIP Area
1,743
Density / Sq Mi
$54,566
Median Household Income
$35,887
Median Earnings
$1,196
Median Rent
$266,200
Median Home Value
Check the figures for this property
Cap Rate, Value Estimation, Potential NOI and more
View Realmo Analytics
Market
Vacancy Rate% for Retail in South region

Questions? Ask Rey
Realmo’s AI knows this listing — price, zoning, demand, history. Ask anything.






Frequently Asked Questions
What type of property is this?
Retail space - Corner retail site along Cosgrove Avenue with B-1 zoning supporting office, retail, restaurant, and neighborhood service uses.
Where is this retail space located?
The property is located at 2122 Cosgrove Ave North Charleston, SC.
What is the asking price?
The asking price for this property is $750,000.
What are key features of this property?
This property features: Corner retail site along Cosgrove Avenue in North Charleston; B‑1 Limited Business zoning allows office, retail, restaurant, and neighborhood service uses; Located just steps from Rivers Avenue



