Mixed-Use Building with
For Sale
$350,000
2121 Madison Ave, Indianapolis, IN 46225
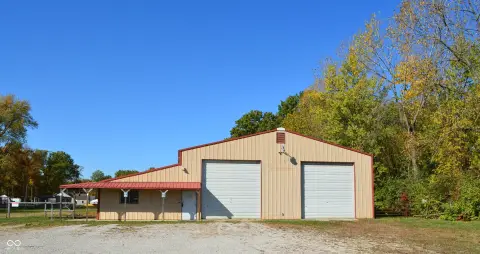
Two-story owner-user property combines office, warehouse, and renovated residential space in a four-parcel configuration.
Property Size4,380 SF
Lot Size0.36 Acres
Price / SF$79.91
Days on Market75
Property Features for 2121 Madison Ave
General Information
Standard status
Active
Size
4,380 SF
Lot size
0.36 Acres
Additional Details
Highway Access
Yes
Drive-In Doors
1
Building Details
Year Built
1944
Buildings
1
Stories
2
Building Size
4,380 SF
Listing Agency:
Mark Dietel Realty, LLC
Listed By:
Connor Jones · License #RB22001638
(317) 654-2593
Source:
Eveloteam
Added: Jul 30
Changed: Oct 6
Last Checked: Oct 7 at 4:46PM
Displayed information is deemed reliable but is not guaranteed and should be independently verified. All listing content including descriptions, pricing, images are the copyrighted material of Mark Dietel Realty, LLC
Investment Insights
Based on property information with market context.
The property includes four contiguous, separately platted parcels totaling 0.36 acres, or 15,682 SF, with a 4,380 SF two-story building constructed in 1944. The ground floor contains office space and a rear warehouse with a drive-in door measuring 10' W x 9' H. A renovated upper-level apartment provides 2 bedrooms and 1 bathroom, supporting live-work occupancy or separate residential use. Heating is served by a boiler-and-radiator system.
Three parcels are vacant, creating options for additional parking, expansion, or future redevelopment. Newer roofing covers the front office and residential sections, while the rear warehouse has an older flat roof. The property is delivered vacant and offers interstate access within the near-south Indianapolis corridor, with downtown, Fountain Square, and Bates-Hendricks nearby.
Three parcels are vacant, creating options for additional parking, expansion, or future redevelopment. Newer roofing covers the front office and residential sections, while the rear warehouse has an older flat roof. The property is delivered vacant and offers interstate access within the near-south Indianapolis corridor, with downtown, Fountain Square, and Bates-Hendricks nearby.
Key Highlights
- Four contiguous, separately platted parcels totaling 0.36 acres (15,682 SF)
- 4,380 SF two‑story mixed‑use building constructed in 1944
- Ground‑floor office and rear warehouse with 10' W x 9' H drive‑in door
Financial Insights
Estimated NOI and Cap Rate
NOI / Yr
$26,513
Cap Rate
7.58%
Suggested Prices Based on Cap Rates
Cap Rate 5%
$530,260
$530.3K
Cap Rate 7%
$378,757
$378.8K
Cap Rate 9%
$294,589
$294.6K
Market Conditions
NOI Build-Up for 4,380 SF
Gross rent
$34.2K $7.80/SF
− Vacancy
−$3.0K −$0.68/SF
EGI
$31.2K $7.12/SF
− OpEx
−$4.7K −$1.07/SF
NOI
$26.5K $6.05/SF
Area
Indianapolis, IN
Vacancy
8.70%
Lease Rate
$7.80 /SF/Yr
Expense Ratio
15.00%
Simulate Cap Rate and NOI
Suggested Prices Based on Cap Rates
Cap Rate 5%
$530,260
Cap Rate 7%
$378,757
Cap Rate 9%
$294,589
Alternative Uses
Best Use
Office B
$826.1K
$722.9K – $963.8K
NOI $57,829 @ 7.0% cap · market cap 16.52%
Second Best
Mixed Use
$760.2K
$665.2K – $887.0K
NOI $53,217 @ 7.0% cap · market cap 15.20%
Theoretical Best
Office A
$1.09M
$954.0K – $1.27M
NOI $76,317 @ 7.0% cap · market cap 21.80%
Zoning and permitted uses should be independently verified with authorities.
How Realmo checks its estimates
Property Analytics
Unlock full access to Insights
Subscribe to Realmo Intelligence
Open Analytics
Current Use
Lease Details
1
Drive-in doors
Yes
Highway access
Location Intelligence
Trade Area within ½ mile
338
Businesses Nearby
Explore this area
Business Placement
Demographics for 46225, IN
6,503
Population
3,056
Households
2.1
Avg Household Size
35
Median Age
29%
College-Educated
81%
High-School Grad
4.0 sq mi
ZIP Area
1,626
Density / Sq Mi
$47,917
Median Household Income
$36,132
Median Earnings
$1,104
Median Rent
$123,600
Median Home Value
Check the figures for this property
Cap Rate, Value Estimation, Potential NOI and more
View Realmo Analytics
Market
Vacancy Rate% for Office in Indianapolis, IN

Questions? Ask Rey
Realmo’s AI knows this listing — price, zoning, demand, history. Ask anything.




Frequently Asked Questions
What type of property is this?
Mixed-use property - Two-story owner-user property combines office, warehouse, and renovated residential space in a four-parcel configuration.
Where is this mixed-use property located?
The property is located at 2121 Madison Ave Indianapolis, IN.
What is the asking price?
The asking price for this property is $350,000.
What are key features of this property?
This property features: Four contiguous, separately platted parcels totaling 0.36 acres (15,682 SF); 4,380 SF two‑story mixed‑use building constructed in 1944; Ground‑floor office and rear warehouse with 10' W x 9' H drive‑in door


