Leased Manufacturing
For Sale
$3,900,000
2121 Hillside Avenue, Indianapolis, IN 46218
Commercial Sale, Indianapolis, IN
Property Size40,000 SF
Lot Size5.50 Acres
Price / SF$97.50
Days on Market850
Property Features for 2121 Hillside Avenue
General Information
Property type
Commercial Sale
Property subtype
Other
Zoning
I3
Parking features
Open
Fencing
Chain Link
Elementary school district
Indianapolis Public Schools
Middle school district
Indianapolis Public Schools
High school district
Indianapolis Public Schools
Directions
GPS Friendly
Subdivision
4910 - Marion - Center
Standard status
Active
APN
490731188243000101
Lot size
5.50 Acres
Taxes and HOA fees
Tax Year
2023
Tax Description
A E I Fletchers Oak Hill L66 Thru L69 Ex Tri Tr Nwcor 174Ft Wl X 270Ft Nl
Tax Annual Amount
21964
Legal Description
A E I Fletchers Oak Hill L66 Thru L69 Ex Tri Tr Nwcor 174Ft Wl X 270Ft Nl
Utilities
Utilities
Cable Available
Heating system
Natural Gas
Building Details
Year built
1973
Floors in Building
2
Roof type
Rubber
Listing Agency:
United Real Estate Indpls
(317) 216-8800
Listed By:
Randall Reichmann · License #RB17001517
(317) 255-7285
Added: Jun 17, 2024
Changed: Oct 8
Last Checked: Oct 14 at 12:06PM
MLS# 21984523
Copyright © 2026 Broker Listing Cooperative®. All rights reserved. All information provided by the listing agent/broker is deemed reliable but is not guaranteed and should be independently verified.
Investment Insights
Based on property information with market context.
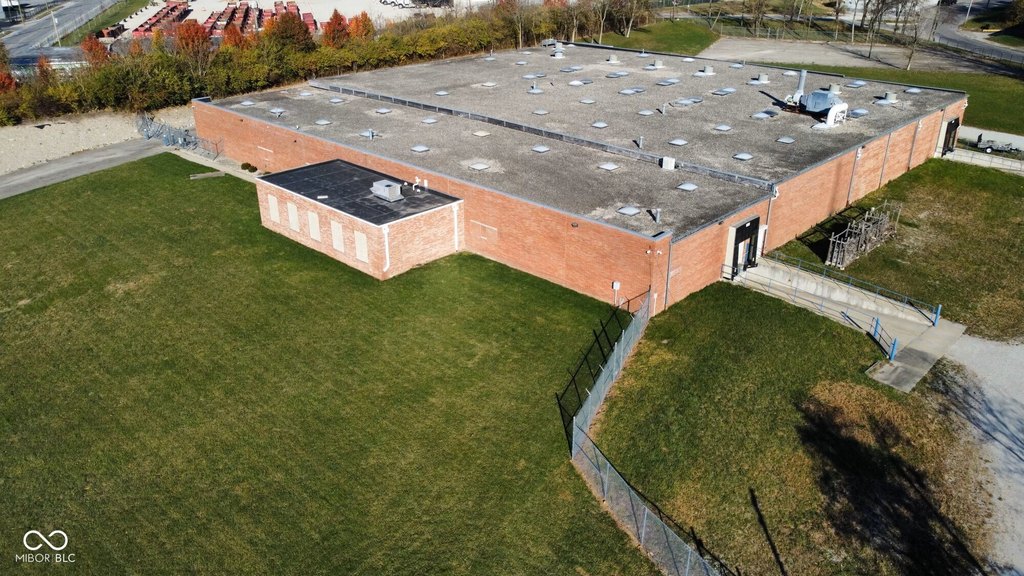
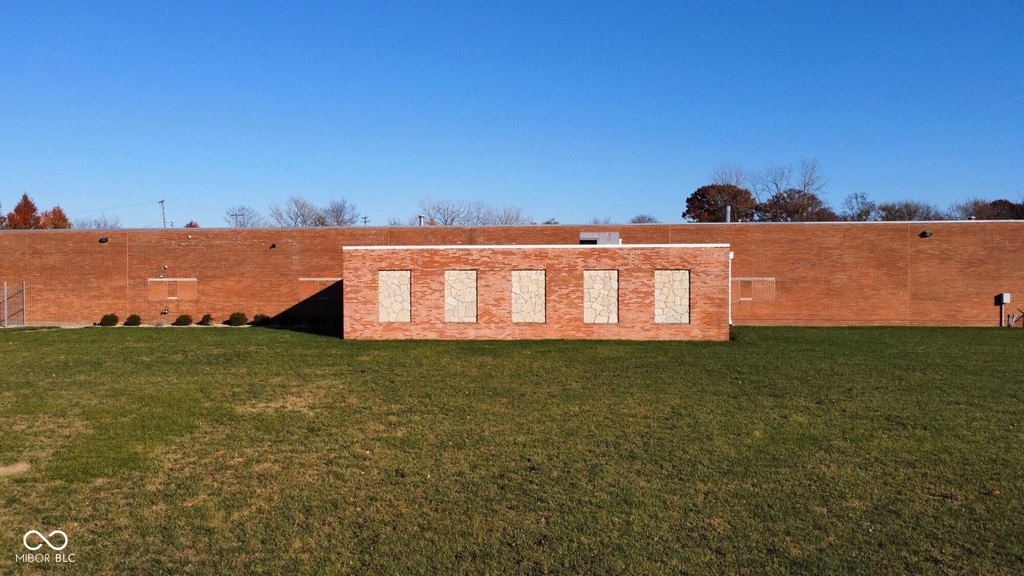
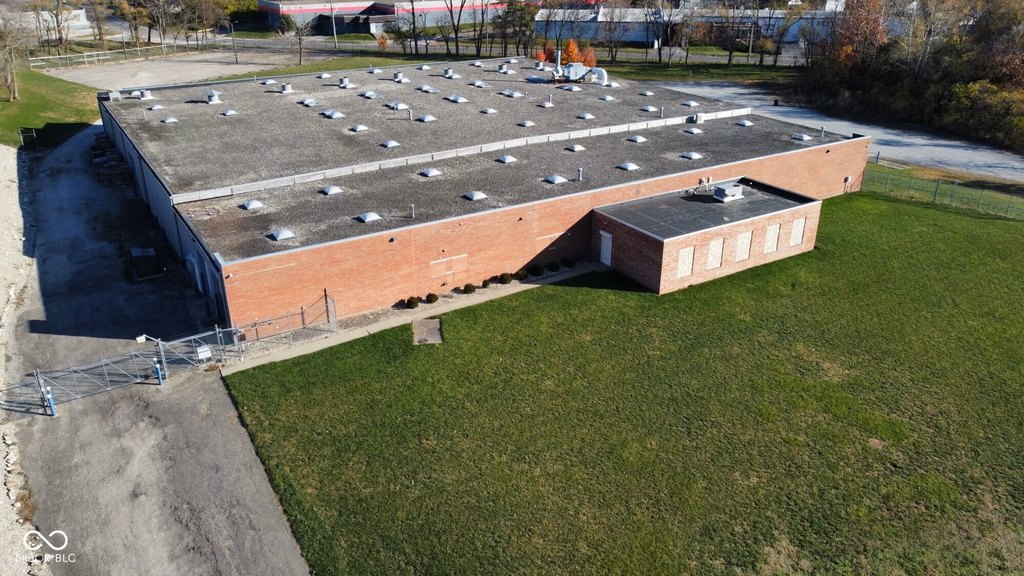
This 40,000-square-foot manufacturing facility occupies 5.5 acres at 2121 Hillside Avenue in Indianapolis. Built in 1973, the property includes more than 1,200 square feet of heated and cooled office space with separate bathrooms, open parking, a rubber roof, natural gas heat, cable availability, and a chain-link perimeter fence. The site is classified I3 and is maintained under a lease covering the entire property with a five-year extension option. The tenant is a manufacturing company, and the lease assigns insurance responsibility to the tenant while the landlord remains responsible for the roof and taxes.
The property was formerly used as an industrial dry-cleaning facility from the 1960s through 2003 and is classified as a Brownfield Site. A Sub-Slab Depressurization system remains in place; on July 24, 2020, IDEM indicated that all corrective action was complete. The property is located in Indianapolis, Marion County, near downtown.
The property was formerly used as an industrial dry-cleaning facility from the 1960s through 2003 and is classified as a Brownfield Site. A Sub-Slab Depressurization system remains in place; on July 24, 2020, IDEM indicated that all corrective action was complete. The property is located in Indianapolis, Marion County, near downtown.
Key Highlights
- 40,000‑square‑foot manufacturing building on 5.5 acres
- I3 zoning with a chain‑link fence enclosing the property
- More than 1,200 square feet of heated and cooled office space
Financial Insights
Estimated NOI and Cap Rate
NOI / Yr
$199,399
Cap Rate
5.11%
Suggested Prices Based on Cap Rates
Cap Rate 5%
$3,987,980
$4.0M
Cap Rate 7%
$2,848,557
$2.8M
Cap Rate 9%
$2,215,544
$2.2M
Market Conditions
NOI Build-Up for 40,000 SF
Gross rent
$312.0K $7.80/SF
− Vacancy
−$27.1K −$0.68/SF
EGI
$284.9K $7.12/SF
− OpEx
−$85.5K −$2.14/SF
NOI
$199.4K $4.98/SF
Area
Indianapolis, IN
Vacancy
8.70%
Lease Rate
$7.80 /SF/Yr
Expense Ratio
30.00%
Simulate Cap Rate and NOI
Suggested Prices Based on Cap Rates
Cap Rate 5%
$3,987,980
Cap Rate 7%
$2,848,557
Cap Rate 9%
$2,215,544
Alternative Uses
Best Use
Industrial
$2.85M
$2.49M – $3.32M
NOI $199,399 @ 7.0% cap · market cap 5.11%
Second Best
—
—
no second resolved use
Theoretical Best
Office A
$9.96M
$8.71M – $11.62M
NOI $696,960 @ 7.0% cap · market cap 17.87%
Zoning and permitted uses should be independently verified with authorities.
How Realmo checks its estimates
Property Analytics
Unlock full access to Insights
Subscribe to Realmo Intelligence
Open Analytics
Current Use
Lease Details
100%
Occupancy
Single-tenant
Tenancy
Yes
Fenced yard
Location Intelligence
Trade Area within ½ mile
434
Businesses Nearby
Explore this area
Business Placement
Demographics for 46218, IN
30,400
Population
15,343
Households
2
Avg Household Size
36
Median Age
11%
College-Educated
80%
High-School Grad
9.5 sq mi
ZIP Area
3,200
Density / Sq Mi
$34,635
Median Household Income
$29,745
Median Earnings
$1,056
Median Rent
$90,200
Median Home Value
Check the figures for this property
Cap Rate, Value Estimation, Potential NOI and more
View Realmo Analytics
Market
Vacancy Rate% for Industrial in Indianapolis, IN

Questions? Ask Rey
Realmo’s AI knows this listing — price, zoning, demand, history. Ask anything.




Frequently Asked Questions
What type of property is this?
Manufacturing property - I3-zoned industrial property with fenced grounds and dedicated office space.
Where is this manufacturing property located?
The property is located at 2121 Hillside Avenue Indianapolis, IN.
What is the asking price?
The asking price for this property is $3,900,000.
What are key features of this property?
This property features: 40,000‑square‑foot manufacturing building on 5.5 acres; I3 zoning with a chain‑link fence enclosing the property; More than 1,200 square feet of heated and cooled office space


