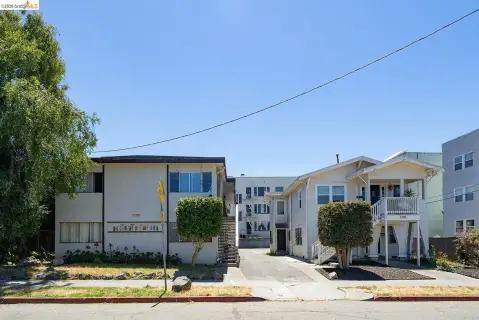
Berkeley Mixed-Use Investment
For Sale
$2,100,000
Pending
2110 Ashby Ave, Berkeley, CA 94705
Mixed-use commercial building in Berkeley's Elmwood neighborhood.
Property Size6,600 SF
Days on Market381
Property Features for 2110 Ashby Ave
General Information
Standard status
Pending
Size
6,600 SF
Property subtype
Residential Income
Listing Agency:
BHG Reliance Partners
Listed By:
Derek Han · License #01738860
(510) 868-1400
Source:
Exprealty
Added: Oct 6, 2025
Changed: Oct 5
Last Checked: Oct 21 at 2:05AM
Displayed information is deemed reliable but is not guaranteed and should be independently verified. All listing content including descriptions, pricing, images are the copyrighted material of BHG Reliance Partners

Ask AI about this property
Review the available facts, identify missing information and prepare questions for the agent.
Investment Insights
Based on property information with market context.
Located in Berkeley's Elmwood neighborhood, this mixed-use commercial building presents an investment opportunity with potential for income and long-term tenants. The property is fully occupied and most units are well-maintained. On-site laundry and garden areas contribute to tenant satisfaction. Seismic upgrades and dual-pane windows have been implemented. A detached storage unit offers versatile usage options and potential for conversion into an Accessory Dwelling Unit (ADU), further increasing income potential. The property is near the Ashby BART station and offers easy freeway access. Proximity to Berkeley Bowl, Whole Foods, local shops, dining, and UC Berkeley ensures a steady flow of potential tenants and business clients. The current actual cap rate is 5.9%. The property size is 6,600 square feet.
Key Highlights
- Prime location in Berkeley's Elmwood neighborhood, near Ashby BART, freeway access, Berkeley Bowl, Whole Foods, local shops/dining, and UC Berkeley.
- Current actual cap rate of 5.9% with upside potential and stable income from long‑term tenants.
- Mix‑used commercial building that is fully occupied with well‑maintained units.
Financial Insights
Estimated NOI and Cap Rate
NOI / Yr
$131,181
Cap Rate
6.25%
Suggested Prices Based on Cap Rates
Cap Rate 5%
$2,623,620
$2.6M
Cap Rate 7%
$1,874,014
$1.9M
Cap Rate 9%
$1,457,567
$1.5M
Market Conditions
NOI Build-Up for 6,600 SF
Gross rent
$251.1K $38.04/SF
− Vacancy
−$12.6K −$1.90/SF
EGI
$238.5K $36.14/SF
− OpEx
−$107.3K −$16.26/SF
NOI
$131.2K $19.88/SF
Area
Berkeley, CA
Vacancy
5.00%
Lease Rate
$38.04 /SF/Yr
Expense Ratio
45.00%
Simulate Cap Rate and NOI
Suggested Prices Based on Cap Rates
Cap Rate 5%
$2,623,620
Cap Rate 7%
$1,874,014
Cap Rate 9%
$1,457,567
Alternative Uses
Best Use
Apartment 5plus
$1.87M
$1.64M – $2.19M
NOI $131,181 @ 7.0% cap · market cap 6.25%
Second Best
Mixed Use
$1.76M
$1.54M – $2.05M
NOI $122,958 @ 7.0% cap · market cap 5.86%
Theoretical Best
Specialty Retail
$2.55M
$2.23M – $2.98M
NOI $178,675 @ 7.0% cap · market cap 8.51%
Zoning and permitted uses should be independently verified with authorities.
How Realmo checks its estimates
Property Analytics
Unlock full access to Insights
Subscribe to Realmo Intelligence
Open Analytics
Current Use
Location Intelligence
Trade Area within ½ mile
4,070
Businesses Nearby
Explore this area
Business Placement
Demographics for 94705, CA
13,591
Population
6,335
Households
2.1
Avg Household Size
42
Median Age
79%
College-Educated
98%
High-School Grad
3.4 sq mi
ZIP Area
3,997
Density / Sq Mi
$163,254
Median Household Income
$75,864
Median Earnings
$2,330
Median Rent
$1,892,300
Median Home Value
Check the figures for this property
Cap Rate, Value Estimation, Potential NOI and more
View Realmo Analytics
Market
Vacancy Rate% for Multifamily in West region



Frequently Asked Questions
What type of property is this?
Mixed-use property - Mixed-use commercial building in Berkeley's Elmwood neighborhood.
Where is this mixed-use property located?
The property is located at 2110 Ashby Ave Berkeley, CA.
What is the asking price?
The asking price for this property is $2,100,000.
What are key features of this property?
This property features: Prime location in Berkeley's Elmwood neighborhood, near Ashby BART, freeway access, Berkeley Bowl, Whole Foods, local shops/dining, and UC Berkeley.; Current actual cap rate of 5.9% with upside potential and stable income from long‑term tenants.; Mix‑used commercial building that is fully occupied with well‑maintained units.