Highway Flex Space with
For Sale
$499,000
20921 Us Highway 69 S, Tyler, TX 75703
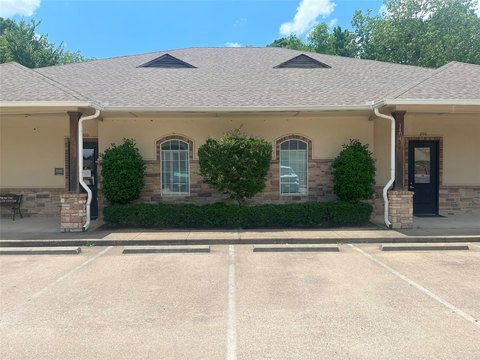
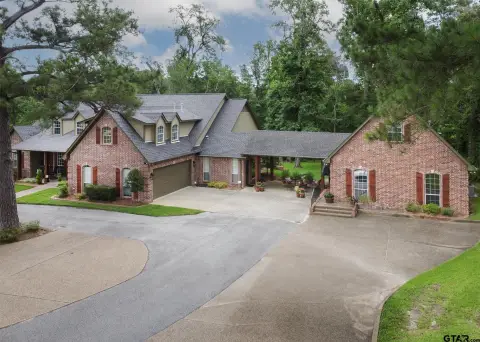
Owner-occupied commercial property combines office rooms, a private flex area, and a heated, cooled metal shop.
Property Size2,700 SF
Price / SF$184.81
Days on Market83
Property Features for 20921 Us Highway 69 S
General Information
Standard status
Active
Size
2,700 SF
Occupancy
100%
Site & Location
Highway Access
Yes
Road Access
Yes
Additional Details
Conditioned Warehouse
Yes
Amenities
full kitchen
walk-in shower
private exterior entrance
Building Details
Year Built
2020
Buildings
2
Tenancy
Single
Owner Occupied
Yes
Abandoned
No
Listing Agency:
Jane Byrd Properties International LLC
Listed By:
Lisa Tate · License #0655763
(214) 550-2887
Source:
Minteerteam
Added: Jul 25
Changed: Oct 12
Last Checked: Oct 7 at 12:54PM
Displayed information is deemed reliable but is not guaranteed and should be independently verified. All listing content including descriptions, pricing, images are the copyrighted material of Jane Byrd Properties International LLC
Investment Insights
Based on property information with market context.
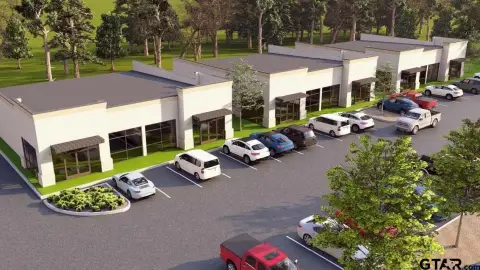
Located at 20921 US Highway 69 S, this 2,700-square-foot flex property was built in 2020 and includes two private office rooms. The rear area features a full kitchen, walk-in shower, and separate exterior entry, creating a flexible interior configuration for business and personal use. A metal shop added in 2023 provides spray foam insulation, heating and cooling, and a large overhead door. The property also includes a concrete drive, ample parking, and space for signage.
The site contains over half an acre with approximately 258 feet of frontage on Highway 69, just over 2 miles south of Bullard and across from a golf course. The property is currently occupied by the owner; only the real estate is included in the sale, and the existing business is excluded.
The site contains over half an acre with approximately 258 feet of frontage on Highway 69, just over 2 miles south of Bullard and across from a golf course. The property is currently occupied by the owner; only the real estate is included in the sale, and the existing business is excluded.
Key Highlights
- 2,700‑square‑foot flex property built in 2020
- Over half an acre with approximately 258 feet of Highway 69 frontage
- Metal shop added in 2023 with spray foam insulation, heating, and cooling
Financial Insights
Estimated NOI and Cap Rate
NOI / Yr
$32,608
Cap Rate
6.53%
Suggested Prices Based on Cap Rates
Cap Rate 5%
$652,160
$652.2K
Cap Rate 7%
$465,829
$465.8K
Cap Rate 9%
$362,311
$362.3K
Market Conditions
NOI Build-Up for 2,700 SF
Gross rent
$46.0K $17.04/SF
− Vacancy
−$2.5K −$0.94/SF
EGI
$43.5K $16.10/SF
− OpEx
−$10.9K −$4.03/SF
NOI
$32.6K $12.08/SF
Area
Tyler, TX
Vacancy
5.50%
Lease Rate
$17.04 /SF/Yr
Expense Ratio
25.00%
Simulate Cap Rate and NOI
Suggested Prices Based on Cap Rates
Cap Rate 5%
$652,160
Cap Rate 7%
$465,829
Cap Rate 9%
$362,311
Alternative Uses
Best Use
Office B
$465.8K
$407.6K – $543.5K
NOI $32,608 @ 7.0% cap · market cap 6.53%
Second Best
Industrial
$165.0K
$144.4K – $192.5K
NOI $11,551 @ 7.0% cap · market cap 2.31%
Theoretical Best
Office A
$602.6K
$527.3K – $703.1K
NOI $42,184 @ 7.0% cap · market cap 8.45%
Zoning and permitted uses should be independently verified with authorities.
How Realmo checks its estimates
Property Analytics
Unlock full access to Insights
Subscribe to Realmo Intelligence
Open Analytics
Current Use
Lease Details
100%
Occupancy
Single-tenant
Tenancy
Yes
Highway access
Yes
Paved road access
Location Intelligence
Trade Area within ½ mile
28
Businesses Nearby
Well-served
Demand for This Use
Explore this area
Business Placement
Demographics for 75703, TX
44,428
Population
20,045
Households
2.2
Avg Household Size
39
Median Age
43%
College-Educated
96%
High-School Grad
55.1 sq mi
ZIP Area
806
Density / Sq Mi
$76,347
Median Household Income
$45,301
Median Earnings
$1,262
Median Rent
$310,500
Median Home Value
Check the figures for this property
Cap Rate, Value Estimation, Potential NOI and more
View Realmo Analytics
Market
Vacancy Rate% for Office in South region

Questions? Ask Rey
Realmo’s AI knows this listing — price, zoning, demand, history. Ask anything.



Frequently Asked Questions
What type of property is this?
Flex space - Owner-occupied commercial property combines office rooms, a private flex area, and a heated, cooled metal shop.
Where is this flex space located?
The property is located at 20921 Us Highway 69 S Tyler, TX.
What is the asking price?
The asking price for this property is $499,000.
What are key features of this property?
This property features: 2,700‑square‑foot flex property built in 2020; Over half an acre with approximately 258 feet of Highway 69 frontage; Metal shop added in 2023 with spray foam insulation, heating, and cooling