Garden-Style Apartment
For Sale
$3,600,000
20607 Congress Way, Castro Valley, CA 94546
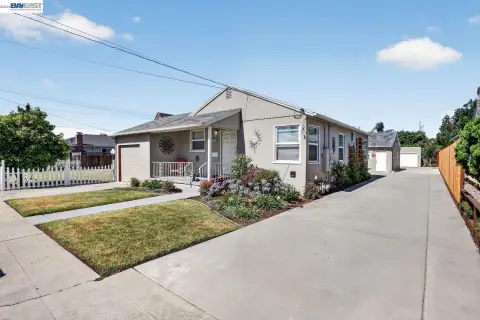
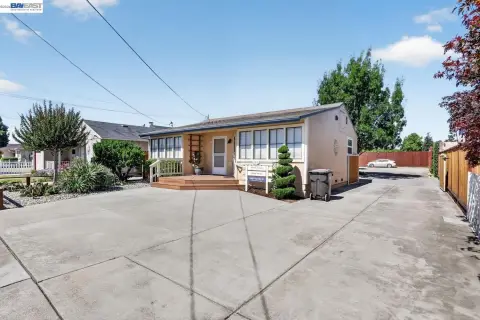
Well-maintained low-rise building with upgraded electrical for a 15-unit residential income portfolio.
Property Size8,238 SF
Days on Market139
Property Features for 20607 Congress Way
General Information
Standard status
Active
Size
8,238 SF
Property subtype
Multifamily
Additional Details
Multifamily Units
15
Building Details
Building Size
8,238 SF
Year Built
1956
Tenancy
Multi
Listing Agency:
NAI Northern California
Listed By:
Grant Chappell · License #CalDRE #01700439
(415) 246-4314
Source:
Naiglobal
Added: Jun 3
Changed: Oct 12
Last Checked: Oct 19 at 4:00AM
Displayed information is deemed reliable but is not guaranteed and should be independently verified. All listing content including descriptions, pricing, images are the copyrighted material of NAI Northern California

Ask AI about this property
Review the available facts, identify missing information and prepare questions for the agent.
Investment Insights
Based on property information with market context.
Built in 1956, this well-maintained low-rise/garden-style apartment building offers a residential income configuration consisting of 15 units. The property includes upgraded electrical, supporting day-to-day operations and ongoing building maintenance.
Located in the Castro Valley area, the asset is presented as a long-term holding option for garden investors seeking a straightforward multifamily structure. The marketing materials emphasize the building’s condition and its fit for investors focused on steady, income-oriented ownership.
For prospective buyers, the combination of a 15-unit setup and upgraded electrical can be a practical starting point for underwriting and acquisition planning. The property is positioned for investors looking for a managed apartment asset in the Castro Valley area, with a focus on retaining a well-kept existing building as part of a broader portfolio strategy.
Located in the Castro Valley area, the asset is presented as a long-term holding option for garden investors seeking a straightforward multifamily structure. The marketing materials emphasize the building’s condition and its fit for investors focused on steady, income-oriented ownership.
For prospective buyers, the combination of a 15-unit setup and upgraded electrical can be a practical starting point for underwriting and acquisition planning. The property is positioned for investors looking for a managed apartment asset in the Castro Valley area, with a focus on retaining a well-kept existing building as part of a broader portfolio strategy.
Key Highlights
- Well‑maintained low‑rise building built in 1956
- 15‑unit residential income property
- Upgraded electrical for the 15 units
Financial Insights
Estimated NOI and Cap Rate
NOI / Yr
$119,336
Cap Rate
3.31%
Suggested Prices Based on Cap Rates
Cap Rate 5%
$2,386,720
$2.4M
Cap Rate 7%
$1,704,800
$1.7M
Cap Rate 9%
$1,325,956
$1.3M
Market Conditions
NOI Build-Up for 8,238 SF
Gross rent
$230.3K $27.96/SF
− Vacancy
−$13.4K −$1.62/SF
EGI
$217.0K $26.34/SF
− OpEx
−$97.6K −$11.85/SF
NOI
$119.3K $14.49/SF
Area
Alameda County, CA
Vacancy
5.80%
Lease Rate
$27.96 /SF/Yr
Expense Ratio
45.00%
Simulate Cap Rate and NOI
Suggested Prices Based on Cap Rates
Cap Rate 5%
$2,386,720
Cap Rate 7%
$1,704,800
Cap Rate 9%
$1,325,956
Alternative Uses
Best Use
Apartment 5plus
$1.70M
$1.49M – $1.99M
NOI $119,336 @ 7.0% cap · market cap 3.31%
Second Best
—
—
no second resolved use
Theoretical Best
Retail
$37.56M
$32.86M – $43.82M
NOI $2,628,964 @ 7.0% cap · market cap 73.03%
Zoning and permitted uses should be independently verified with authorities.
How Realmo checks its estimates
Property Analytics
Unlock full access to Insights
Subscribe to Realmo Intelligence
Open Analytics
Current Use
Lease Details
15
Residential units
Multi-tenant
Tenancy
Location Intelligence
Trade Area within ½ mile
1,897
Businesses Nearby
Explore this area
Business Placement
Demographics for 94546, CA
46,687
Population
16,398
Households
2.8
Avg Household Size
40
Median Age
41%
College-Educated
90%
High-School Grad
16.0 sq mi
ZIP Area
2,918
Density / Sq Mi
$125,780
Median Household Income
$66,737
Median Earnings
$2,506
Median Rent
$976,300
Median Home Value
Check the figures for this property
Cap Rate, Value Estimation, Potential NOI and more
View Realmo Analytics
Market
Vacancy Rate% for Multifamily in West region





Frequently Asked Questions
What type of property is this?
Apartment building - Well-maintained low-rise building with upgraded electrical for a 15-unit residential income portfolio.
Where is this apartment building located?
The property is located at 20607 Congress Way Castro Valley, CA.
What is the asking price?
The asking price for this property is $3,600,000.
What are key features of this property?
This property features: Well‑maintained low‑rise building built in 1956; 15‑unit residential income property; Upgraded electrical for the 15 units


