Modern Two-Unit
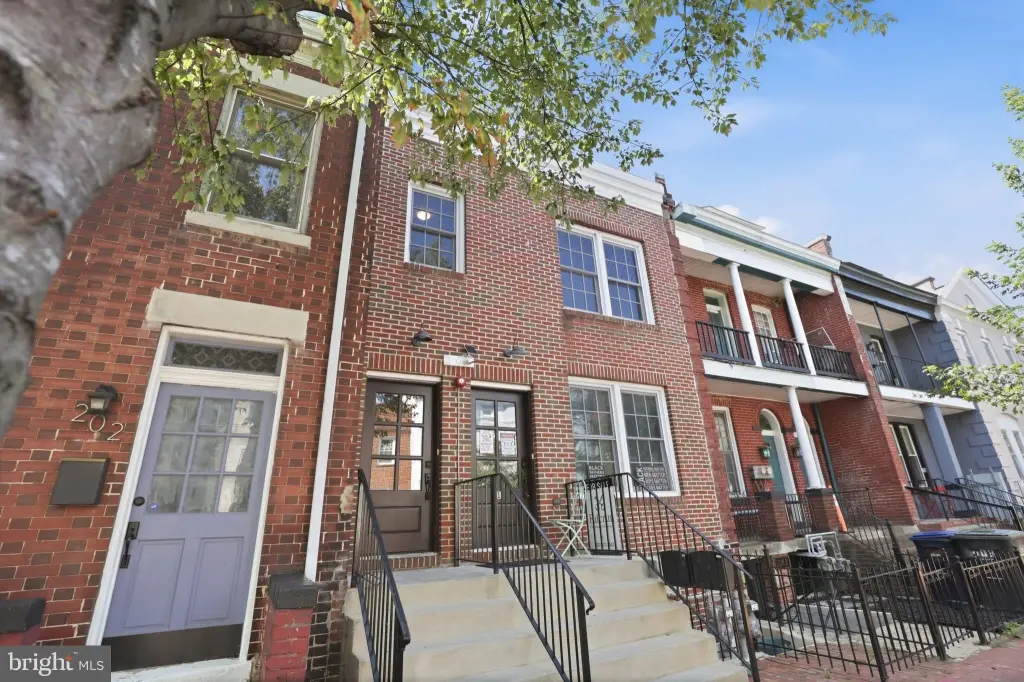
For Sale
$1,499,900
206 MORGAN Street NW, Washington, DC 20001
Multi-Family, WASHINGTON, DC
Property Size3,584 SF
Lot Size0.05 Acres
Price / SF$418.50
Days on Market49
Property Features for 206 MORGAN Street NW
General Information
Property type
Residential Multi Family
Property subtype
Duplex
Rooms
Dining Room, Basement
Parking features
Off Street, On Street, Driveway, Fenced
Interior features
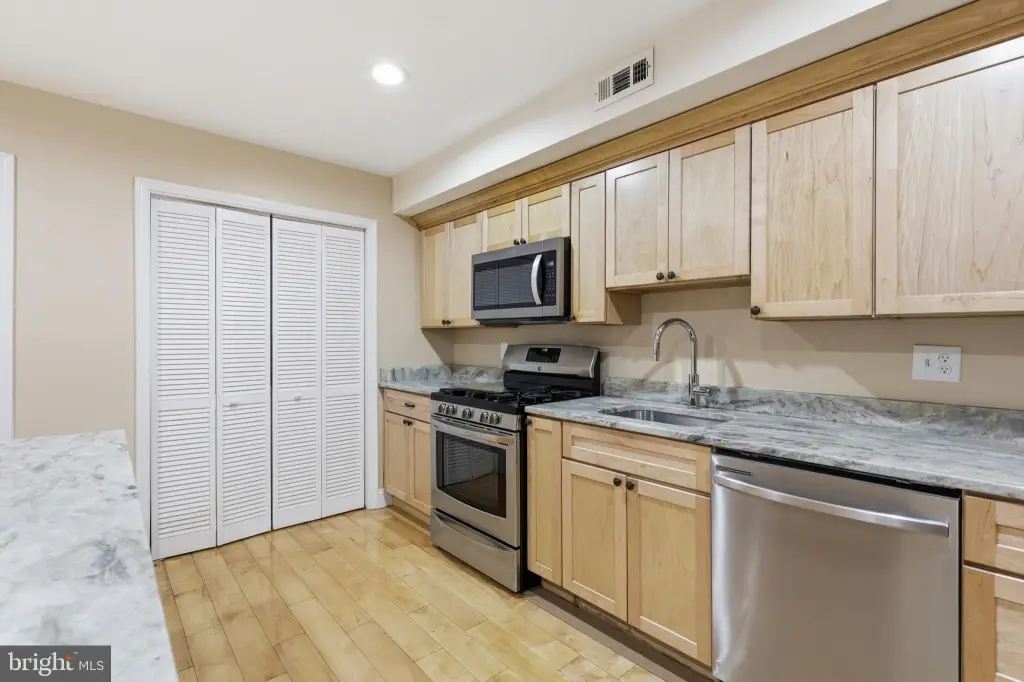
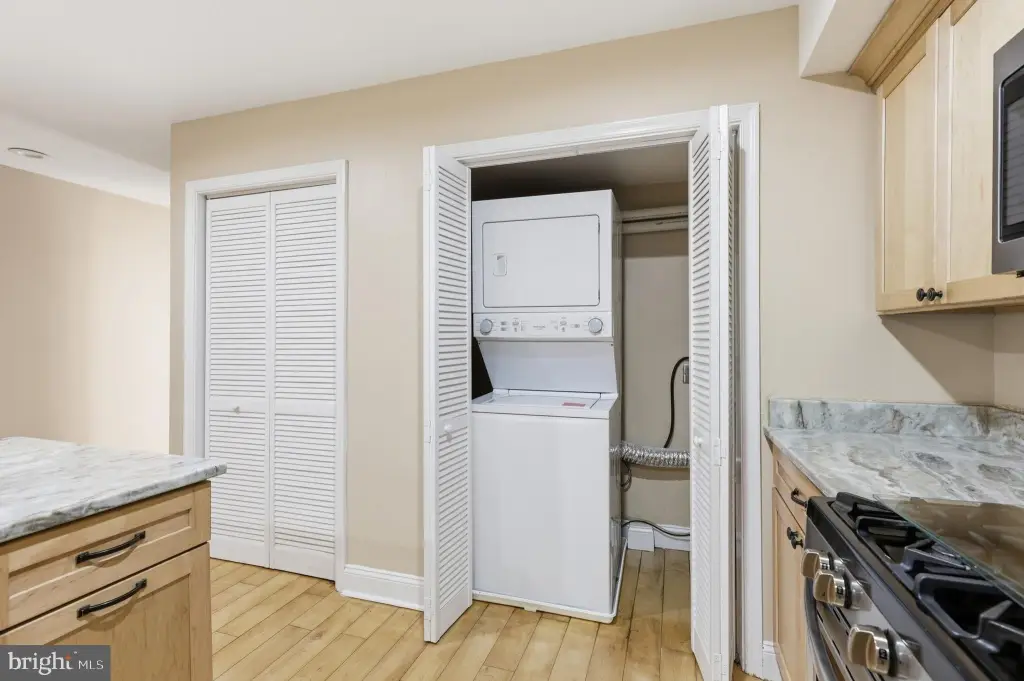
2nd Kitchen, Combination Kitchen/Dining, Floor Plan - Open, Kitchen - Island, Recessed Lighting, Upgraded Countertops, Wood Floors, Sprinkler System
Appliances
Built-In Microwave, Dishwasher, Disposal, Refrigerator, Stove
Subdivision
MOUNT VERNON
High school
DUNBAR
Elementary school district
DISTRICT OF COLUMBIA PUBLIC SCHOOLS
Middle school district
DISTRICT OF COLUMBIA PUBLIC SCHOOLS
High school district
DISTRICT OF COLUMBIA PUBLIC SCHOOLS
Standard status
Active
Size
3,584 SF
Lot size
0.05 Acres
Taxes and HOA fees
Tax Annual Amount
13493
Utilities
Heating system
Central
Cooling system
Central Air
Amenities
balconies
Building Details
Year built
2020
Number of units
2
Building materials
Brick
Architectural style
Other
Listing Agency:
Keller Williams Capital Properties · Keller Williams Realty
(202) 243-7700
Listed By:
Tom J Kavanagh
(703) 966-8466
Added: Aug 28
Changed: Sep 28
Last Checked: Oct 15 at 12:06PM
MLS# DCDC2280610
Copyright © 2026 Bright MLS. All rights reserved. All information provided by the listing agent/broker is deemed reliable but is not guaranteed and should be independently verified.
Investment Insights
Based on property information with market context.
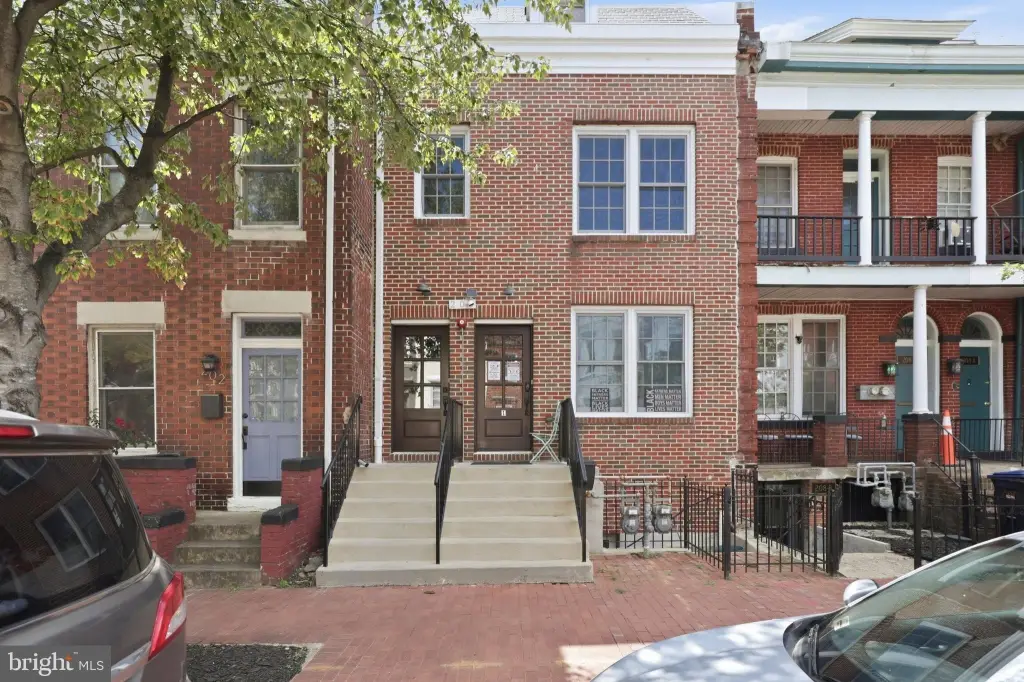
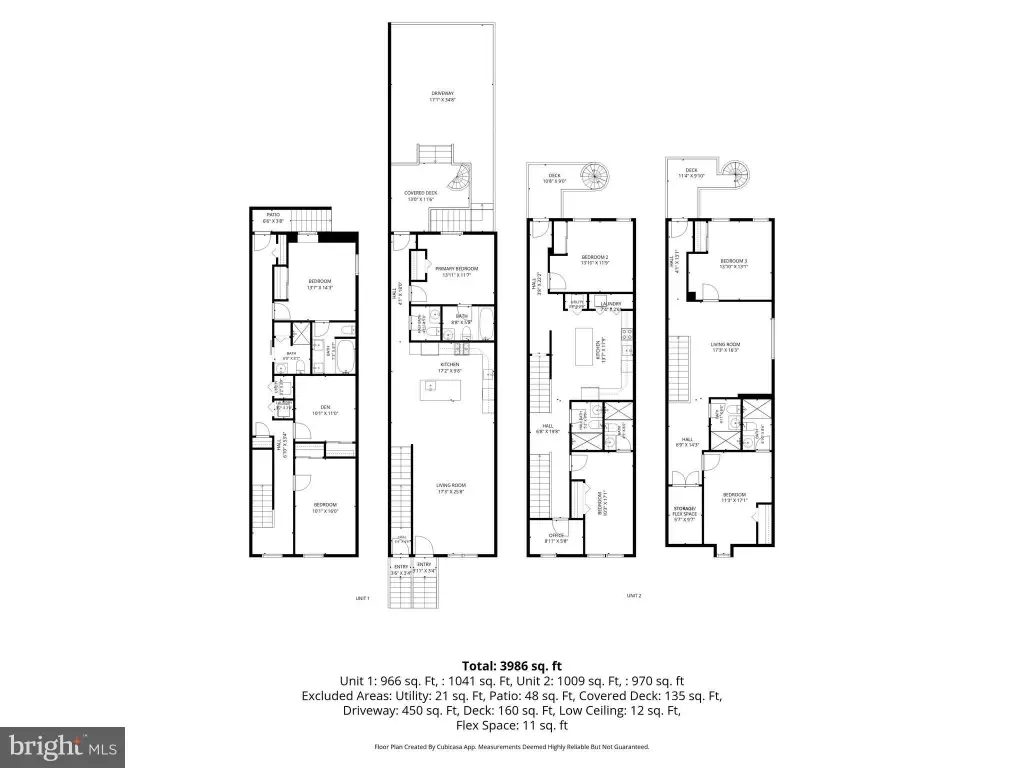
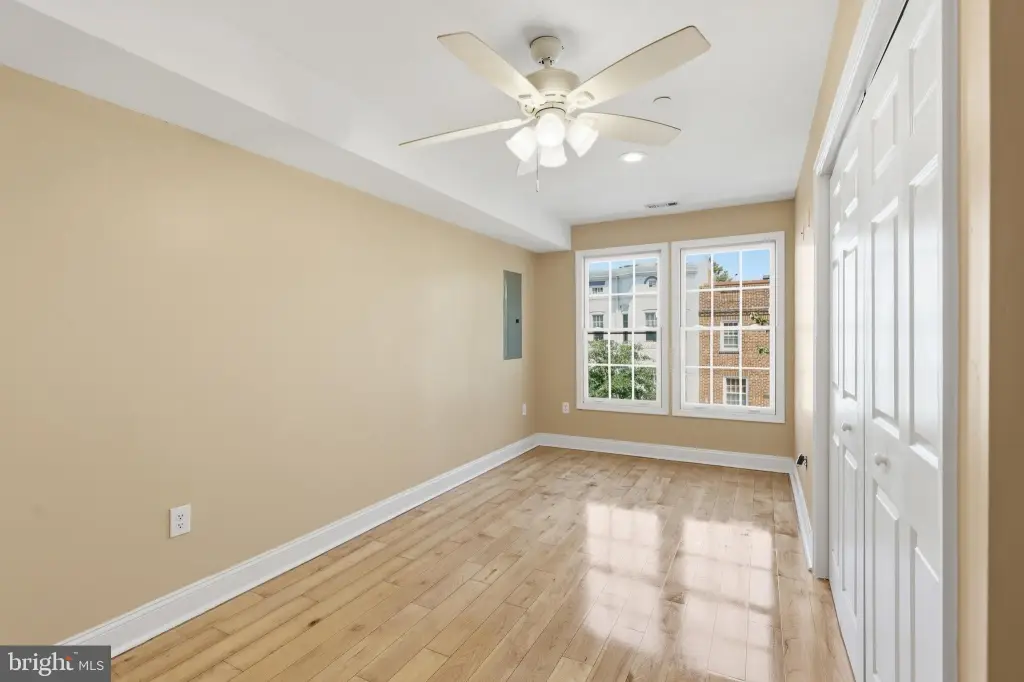
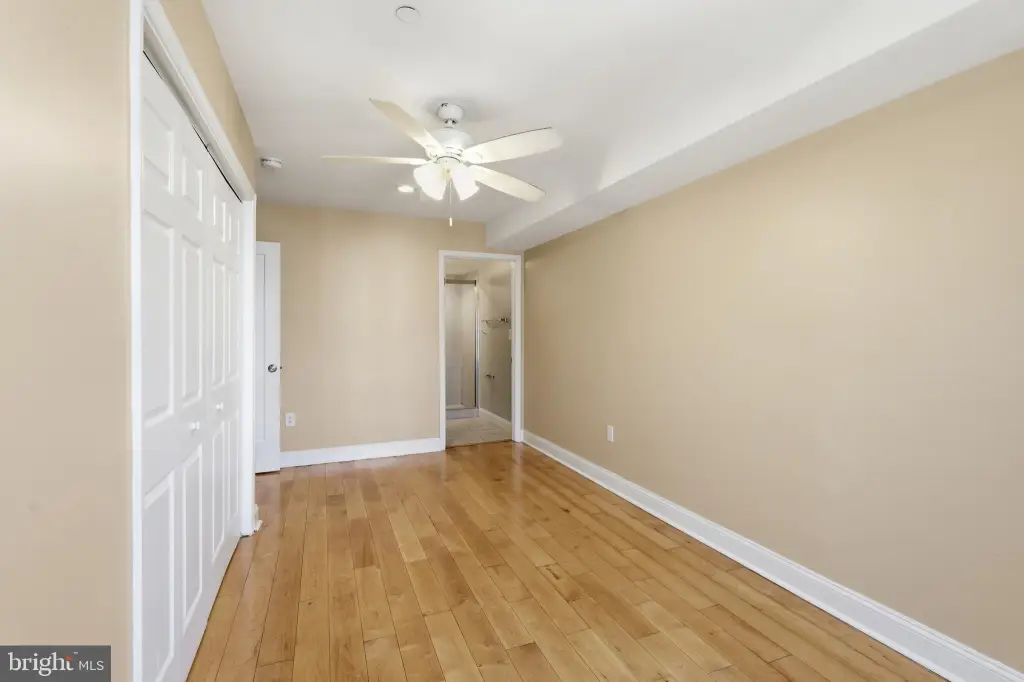
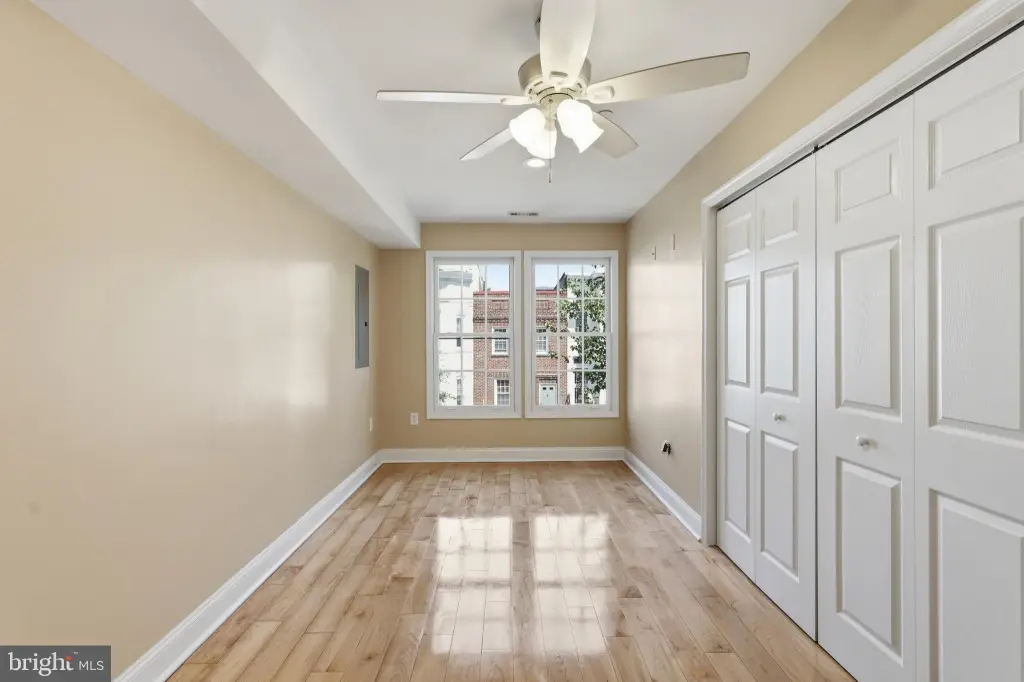
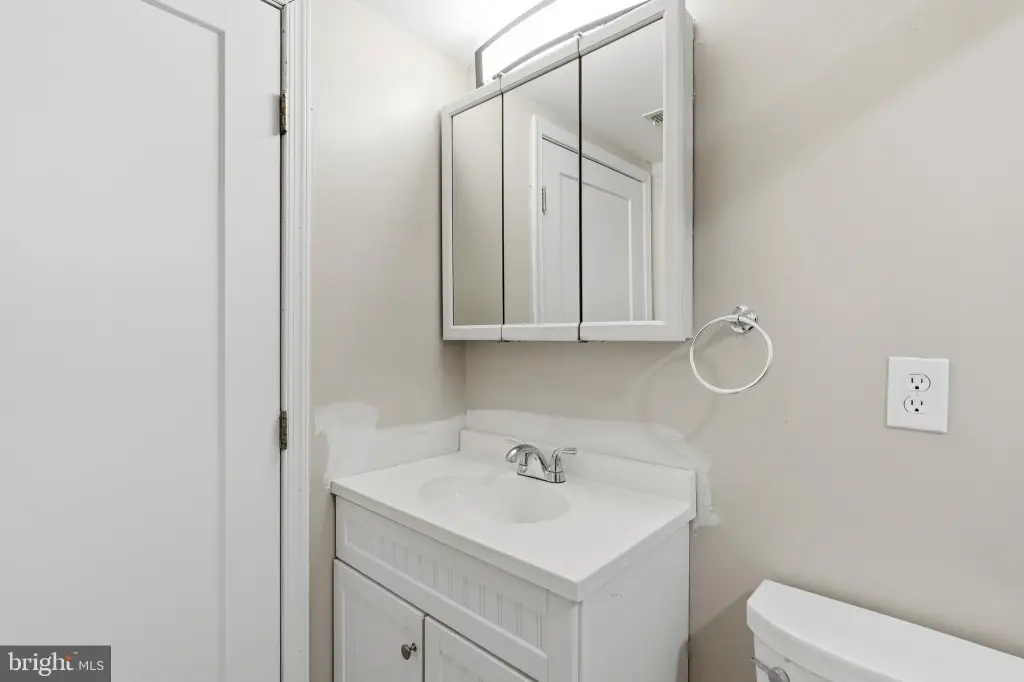
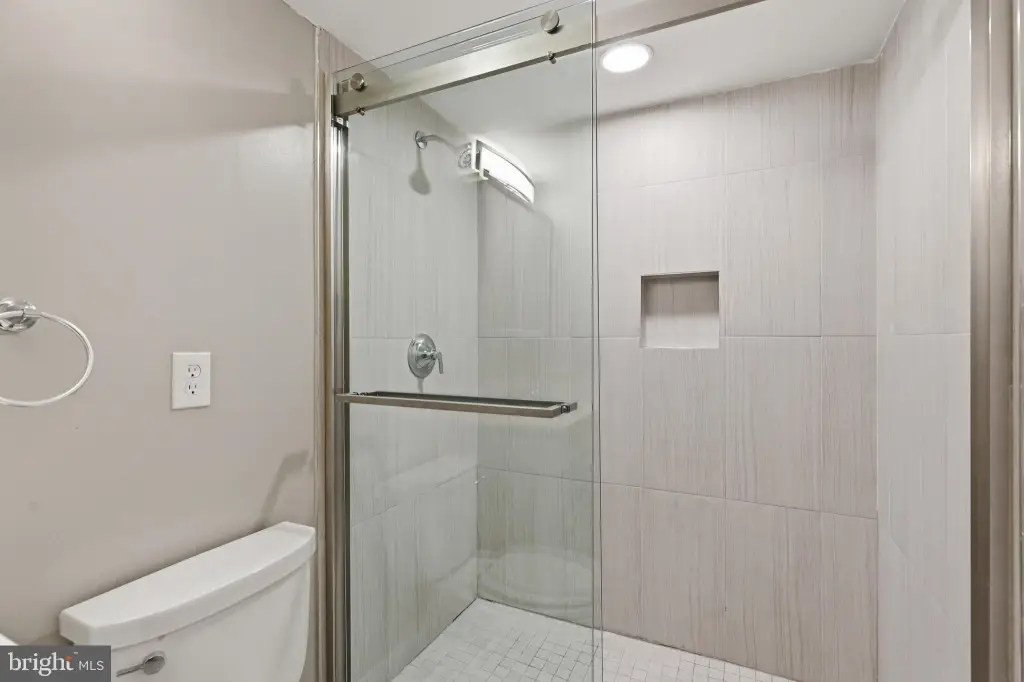
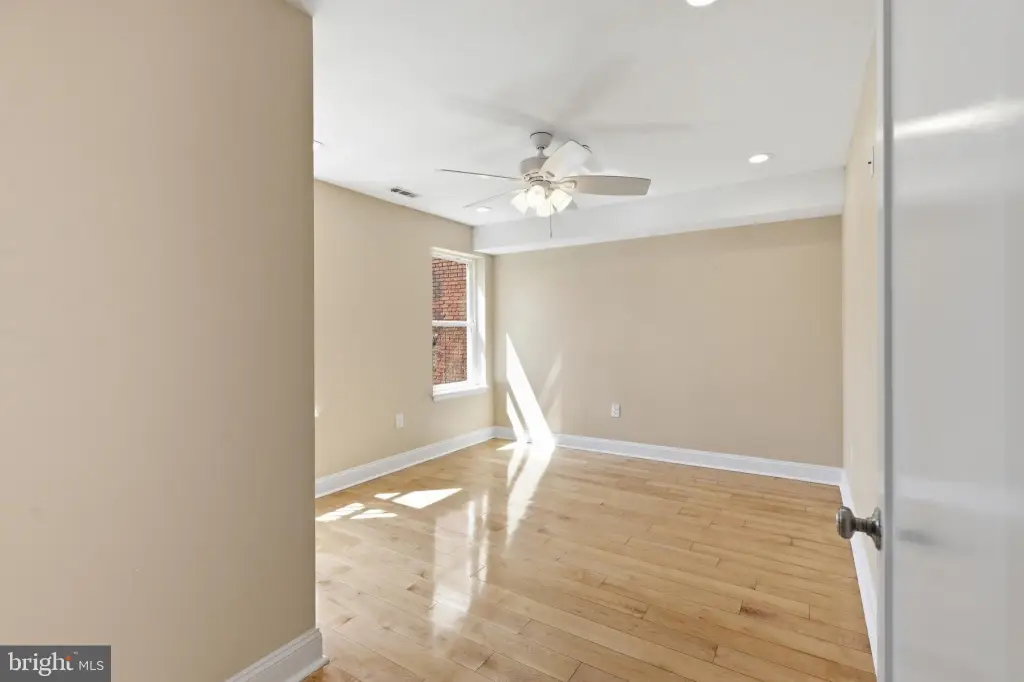
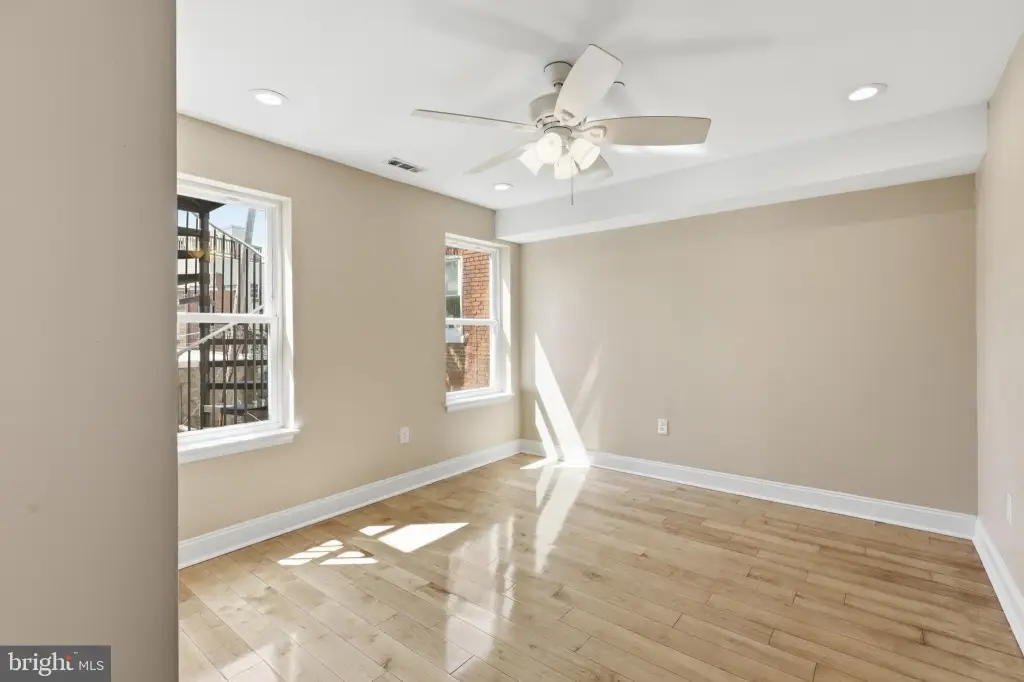
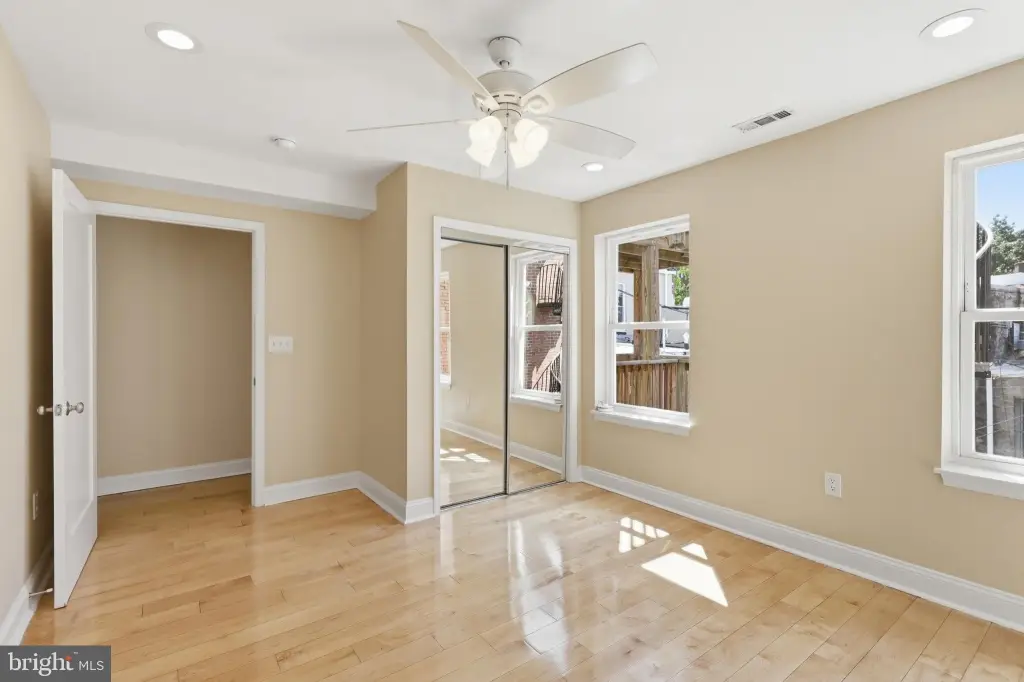
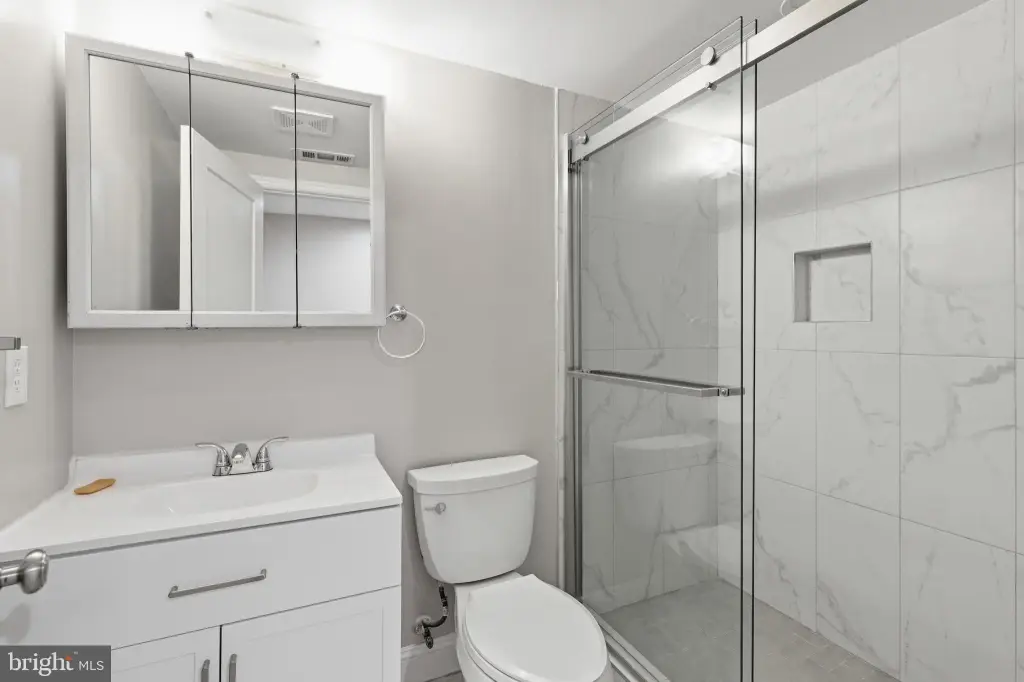
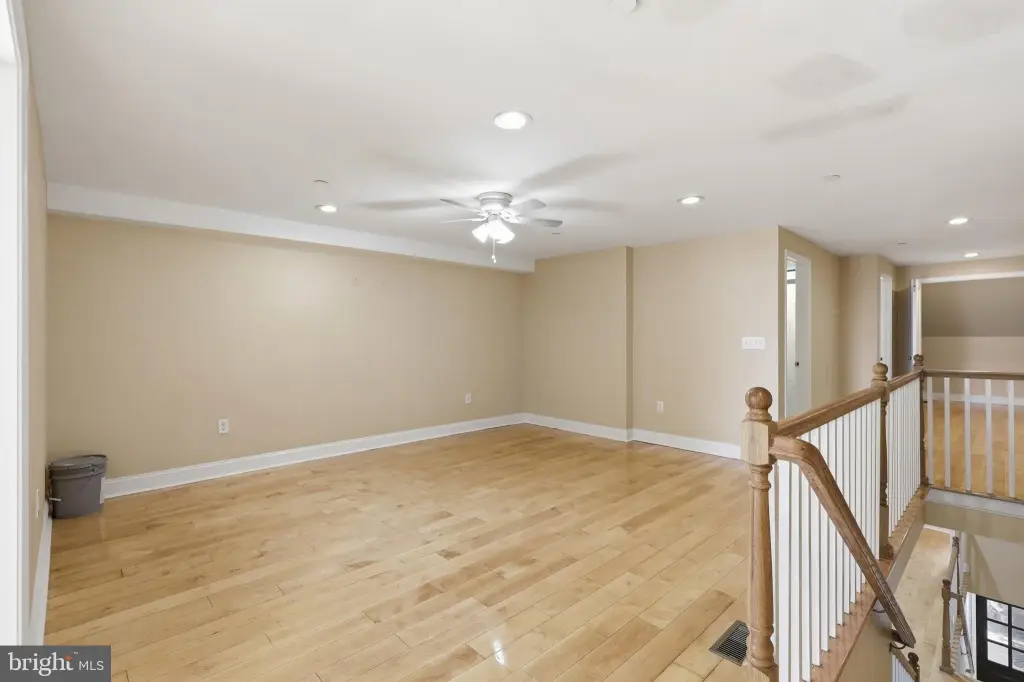
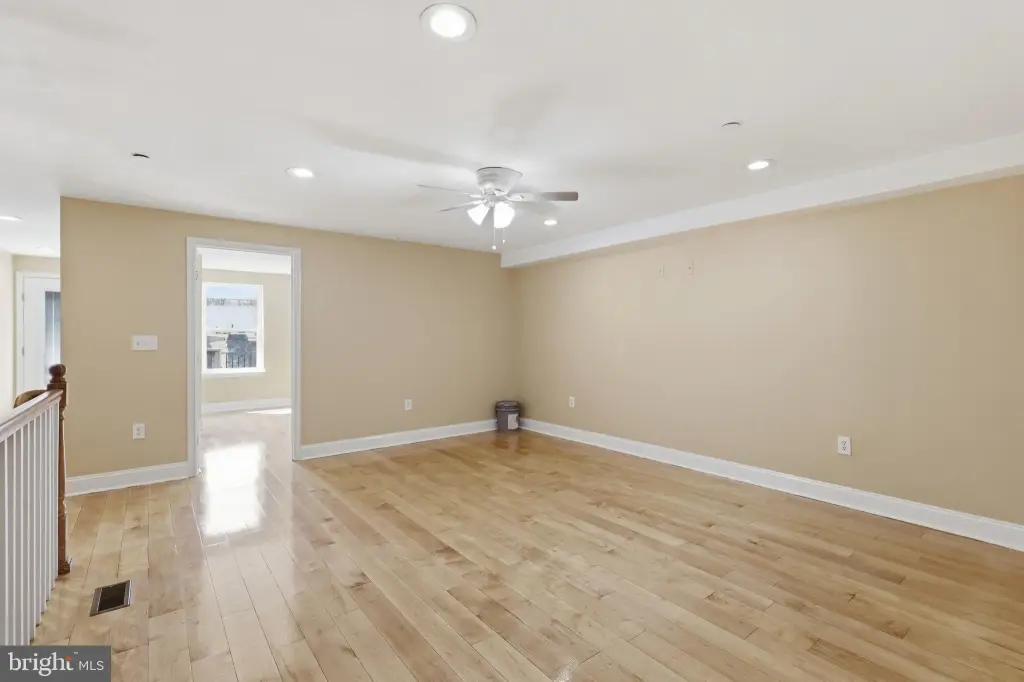
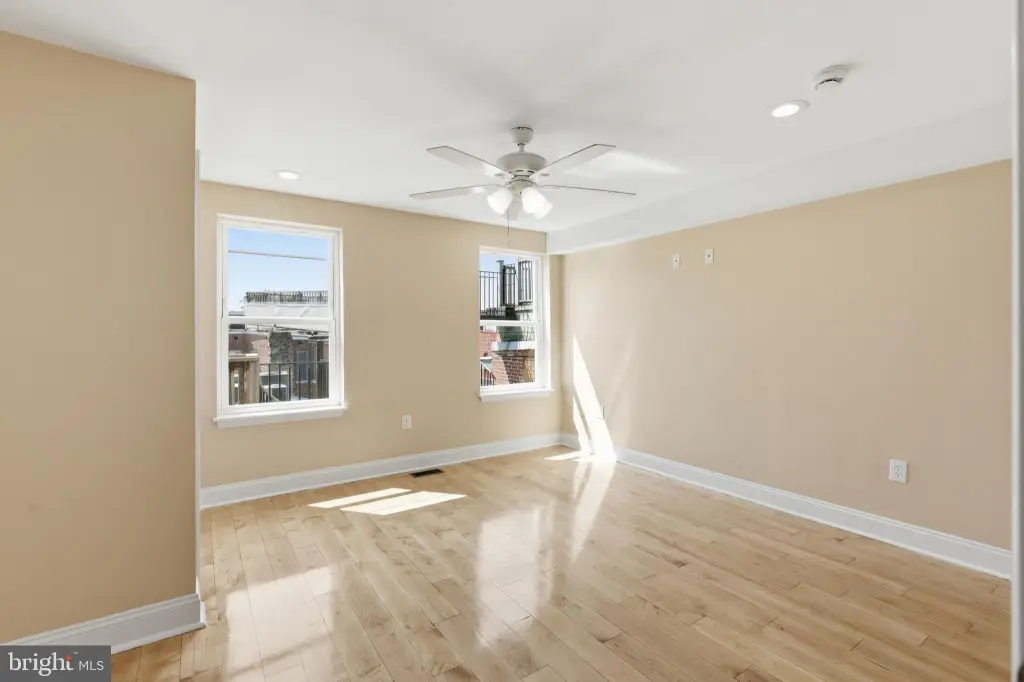
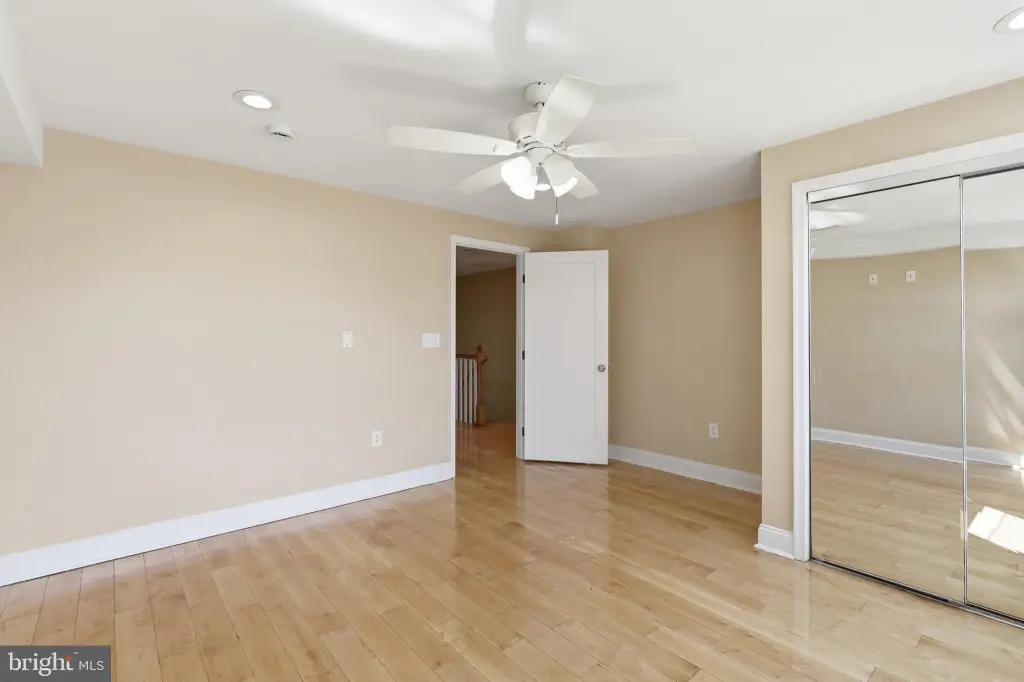
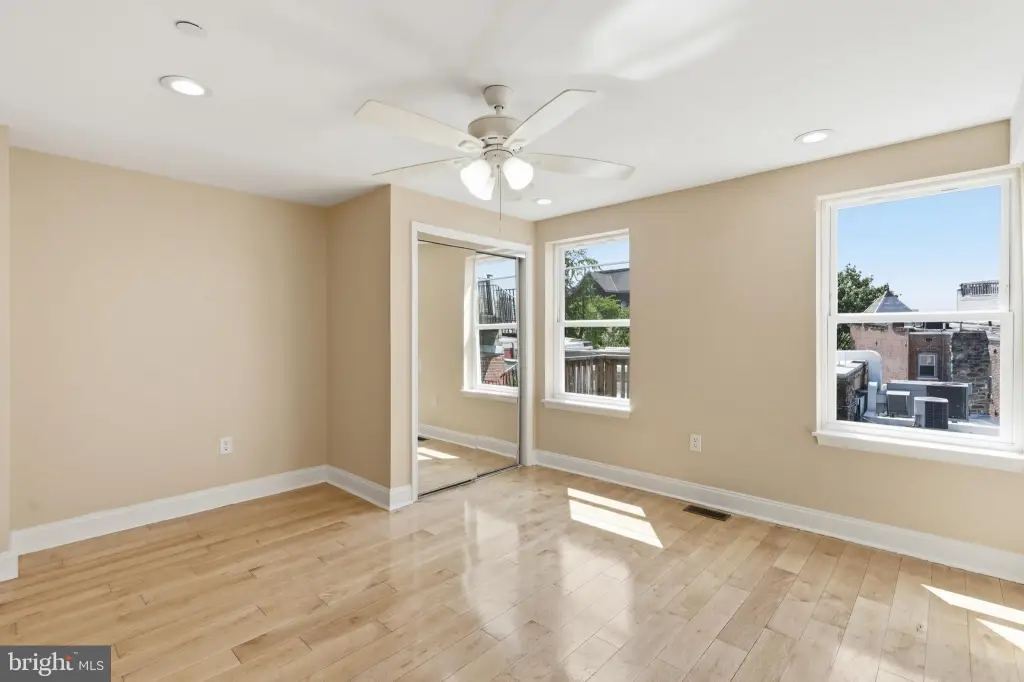
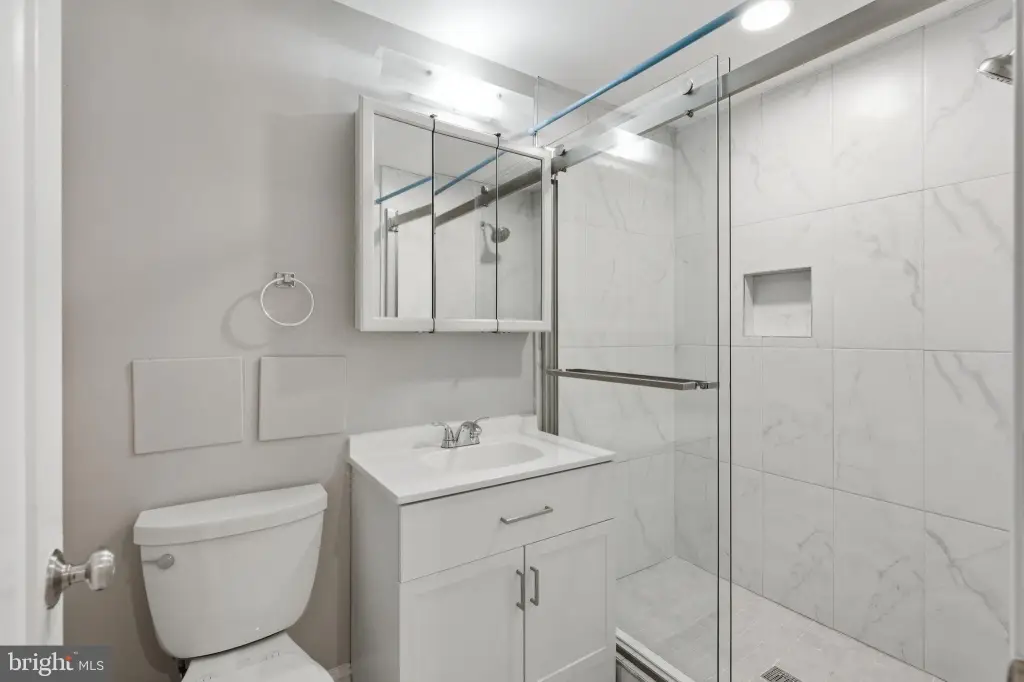
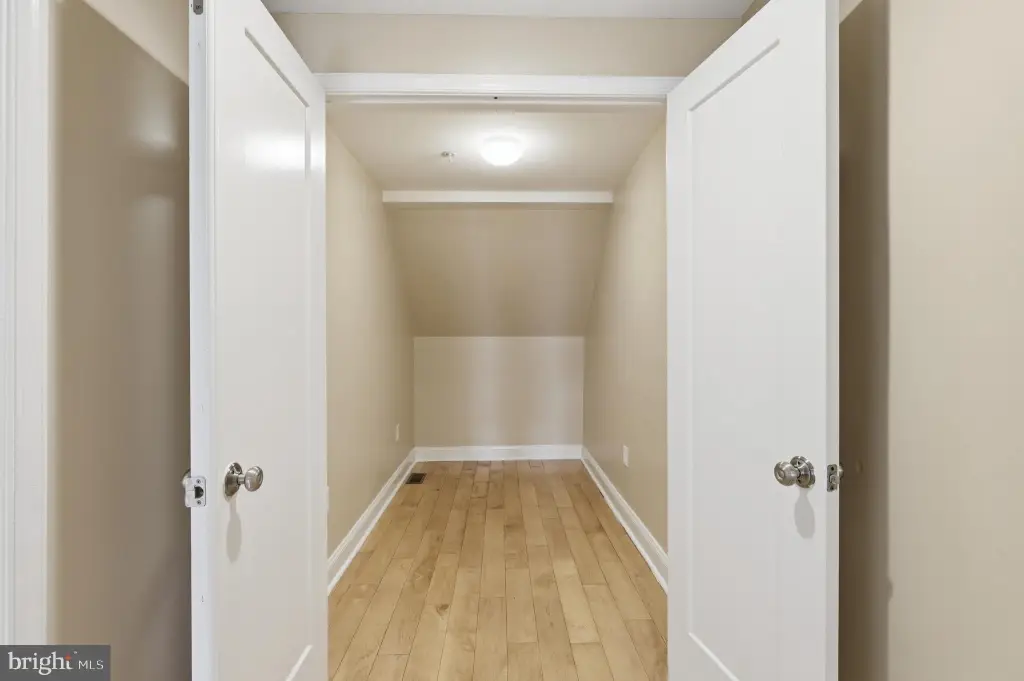
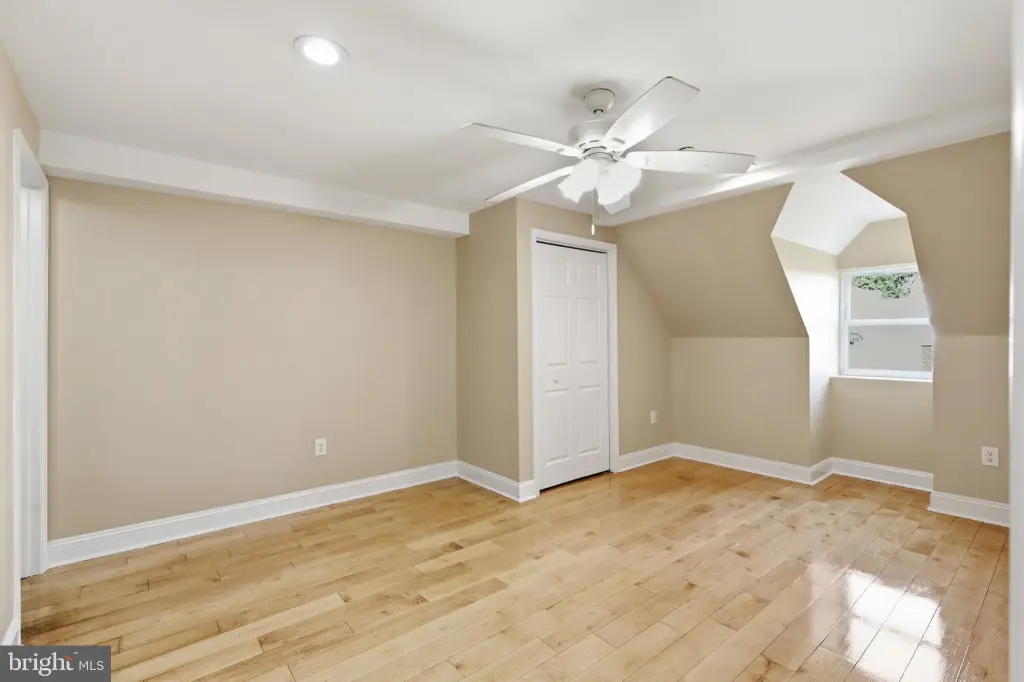
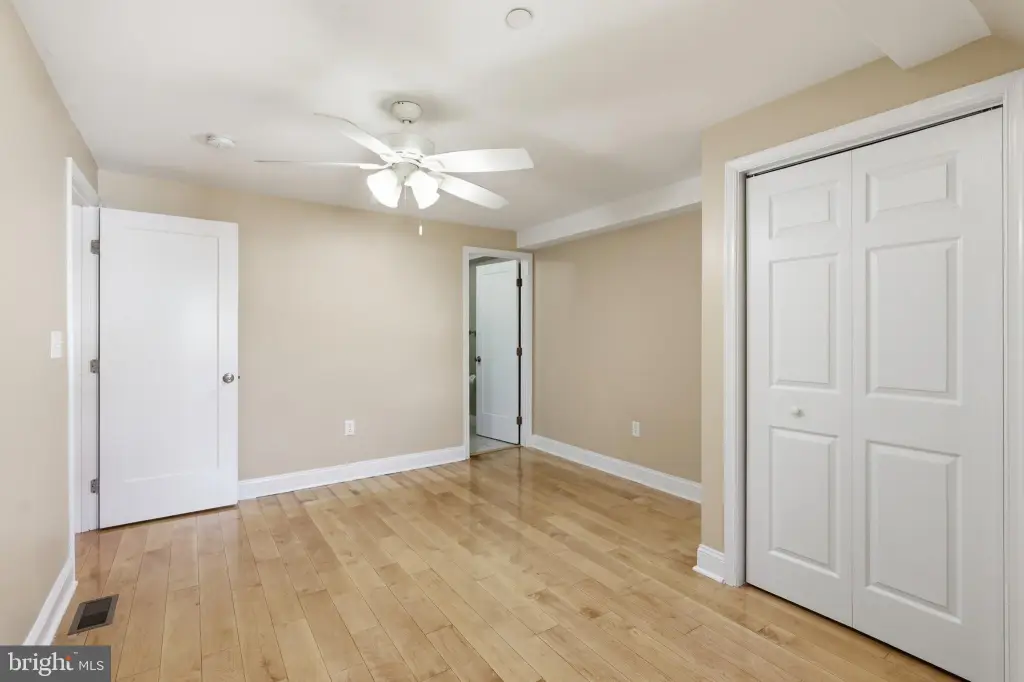
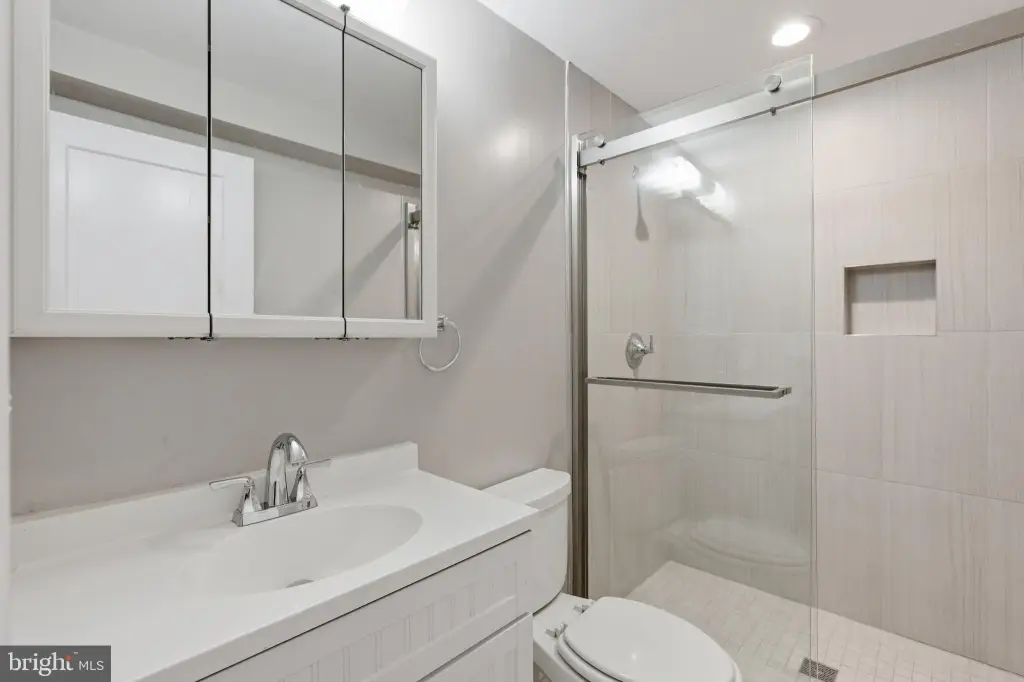
Completed in 2020, this 3,584-square-foot duplex at 206 Morgan Street NW contains two distinct residences totaling 7 bedrooms, 7.5 bathrooms, and 2 dens. The upper unit is vacant and offers 4 bedrooms, 4 full bathrooms, a den, two en-suite bedrooms, separate living and kitchen levels, extensive storage, and private outdoor space. The lower residence includes 3 bedrooms, 3 full bathrooms, a half bath, a den, two en-suite bedrooms, and an open kitchen-living arrangement.
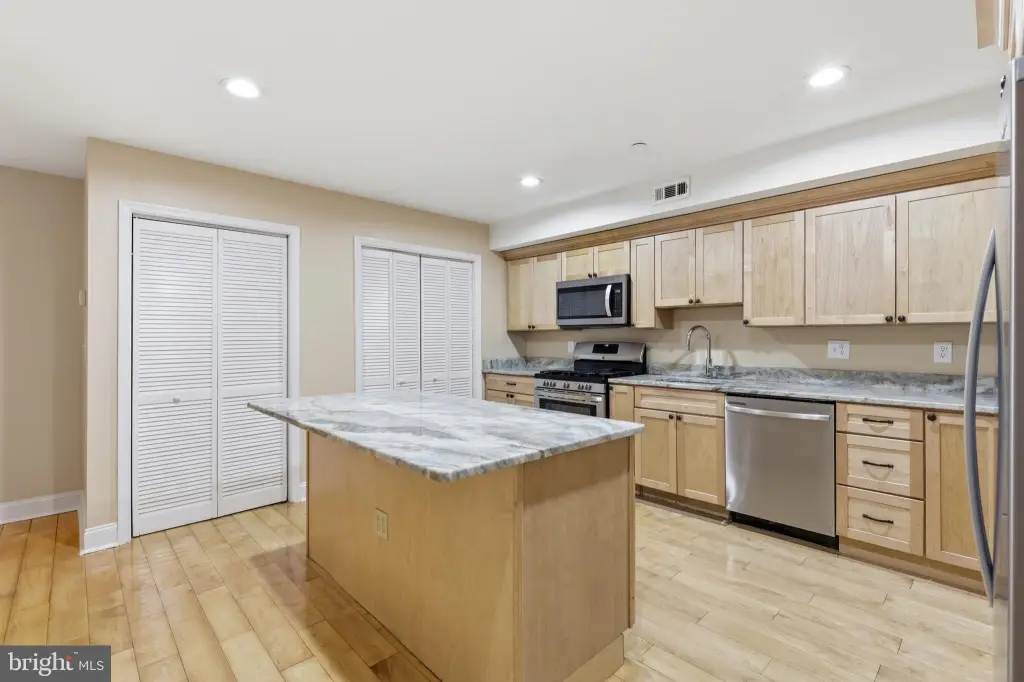
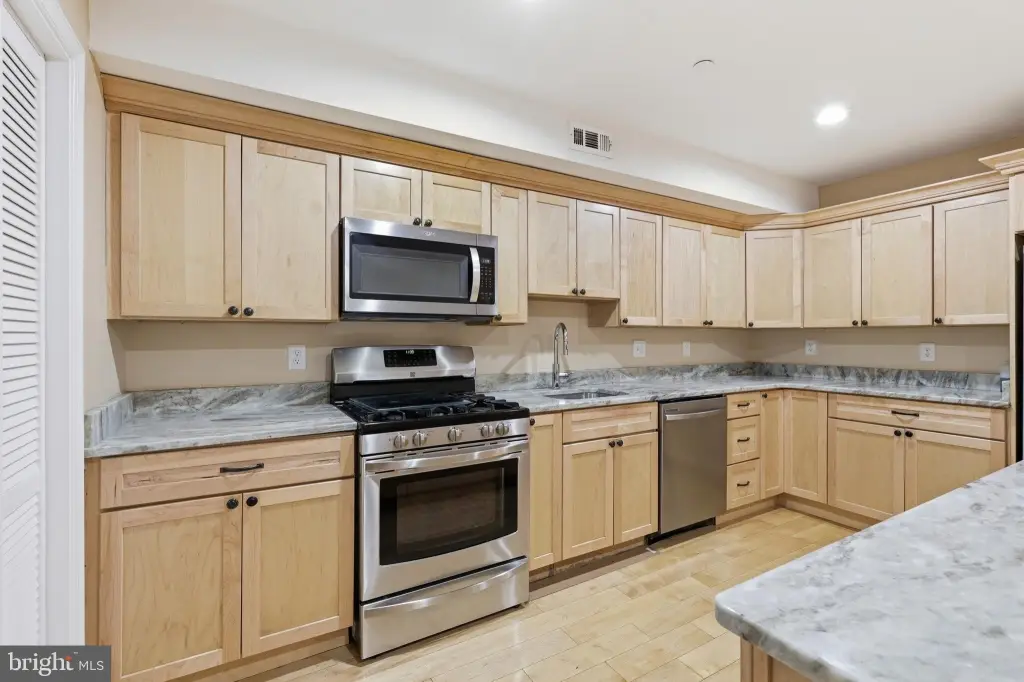
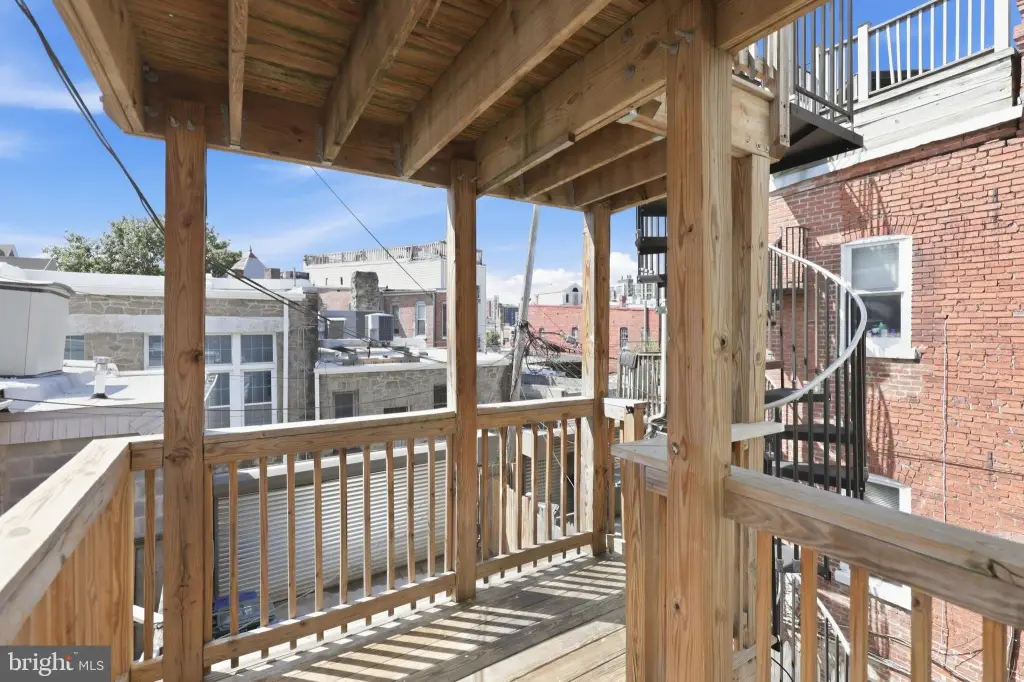
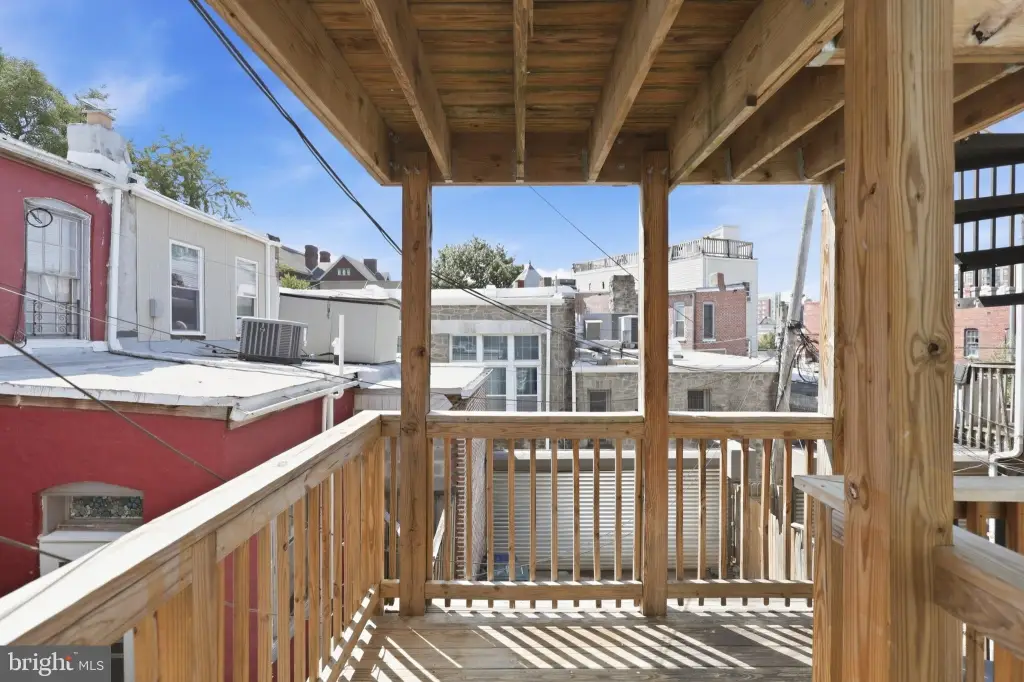
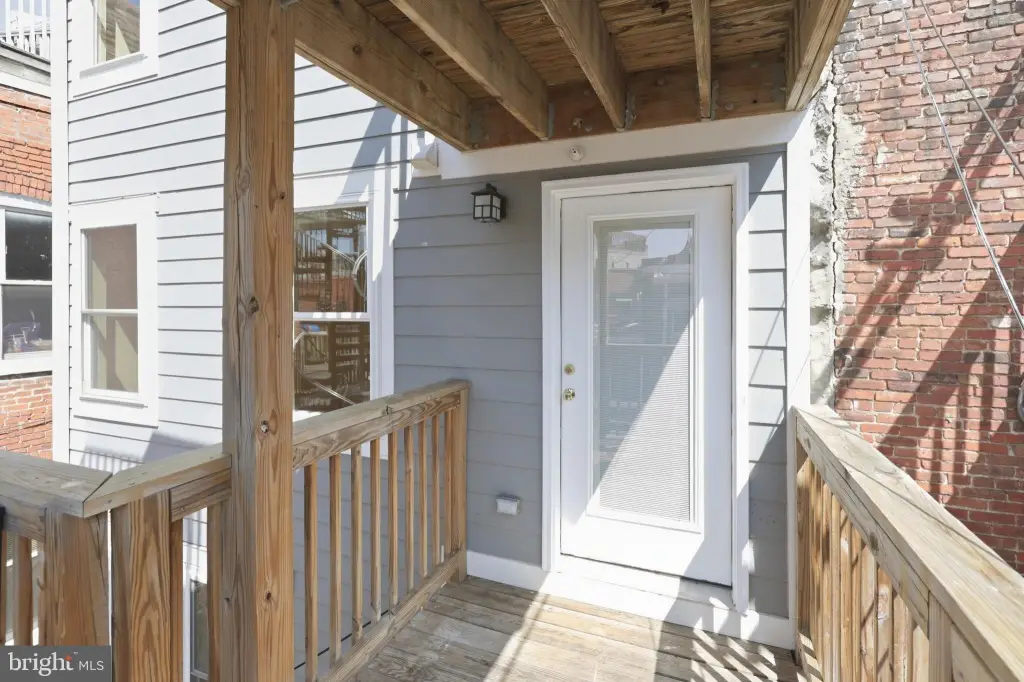
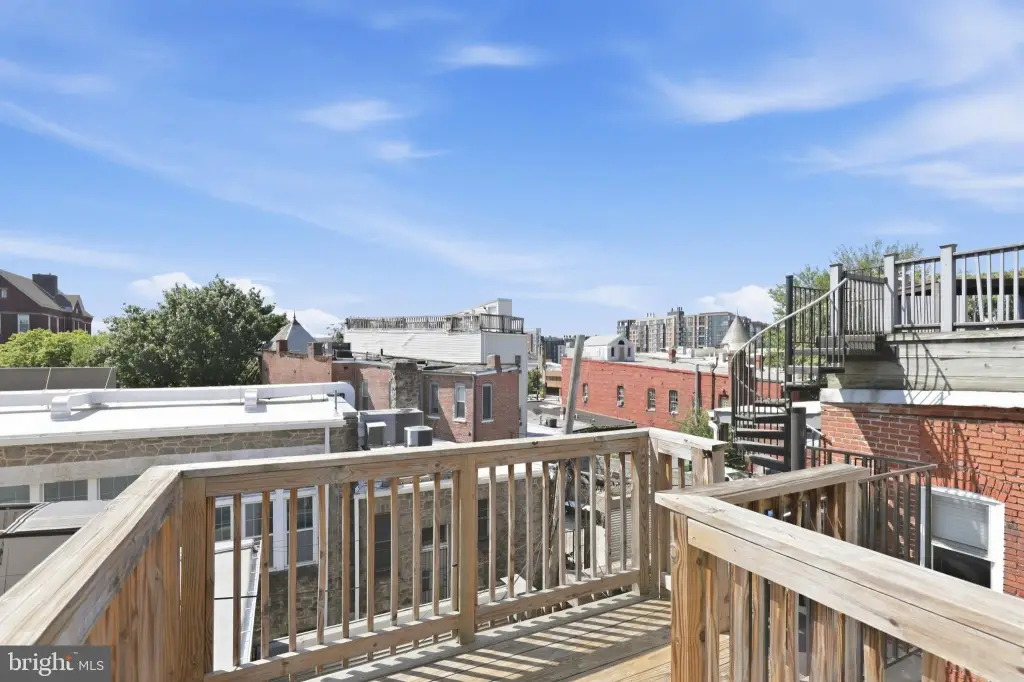
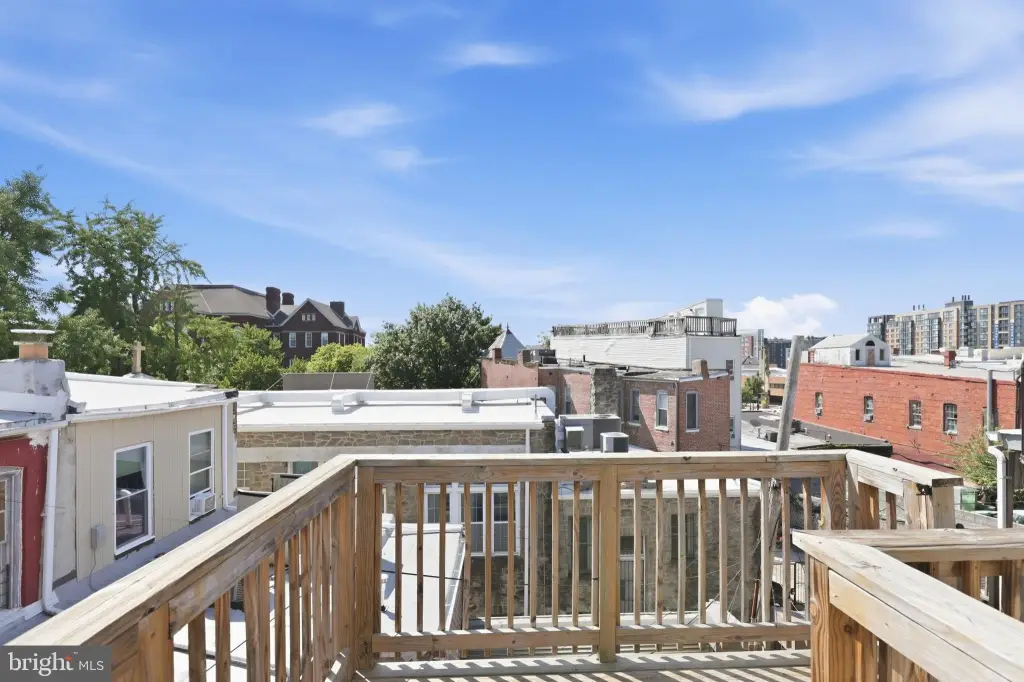
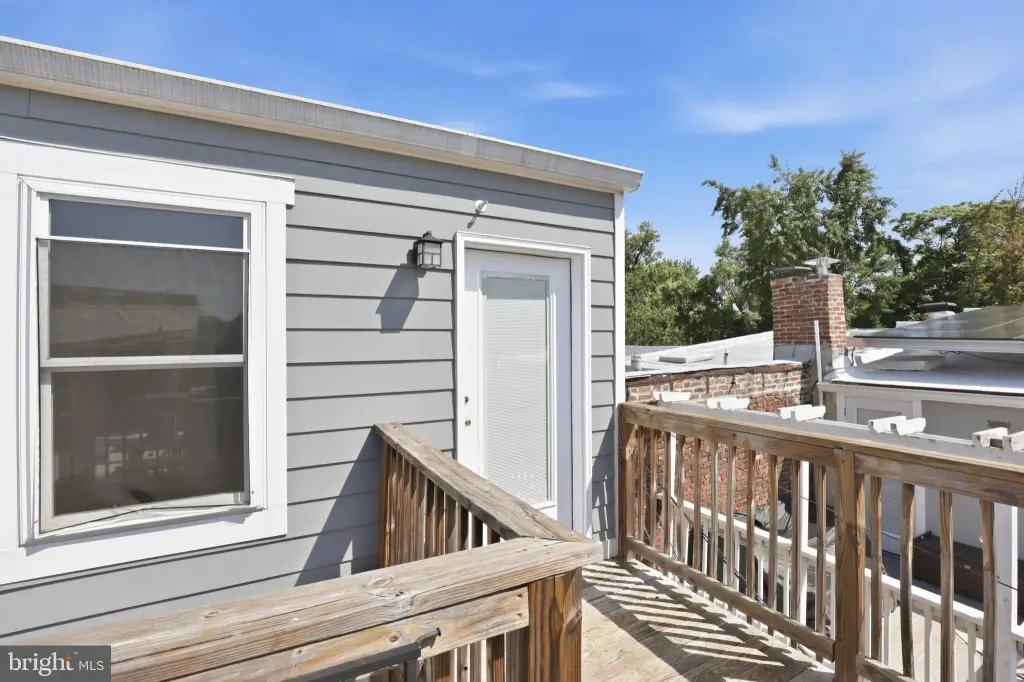
Private rear balconies serve every level, while a fenced rear driveway provides secure two-car parking behind a roll-up garage door. The building includes central heating and cooling, wood floors, upgraded countertops, an island kitchen, brick construction, and a full sprinkler system. It was built to DC Green Energy Code standards and designed for a future rooftop deck.
Morgan Street terminates at a neighborhood park. Metro service on the Red, Green, and Yellow lines is approximately five blocks away, and Harris Teeter, Safeway, and Giant are approximately four blocks away. Georgetown University Law Center, Johns Hopkins SAIS, Union Station, and the U.S. Capitol are among the nearby destinations identified in the listing.
Private rear balconies serve every level, while a fenced rear driveway provides secure two-car parking behind a roll-up garage door. The building includes central heating and cooling, wood floors, upgraded countertops, an island kitchen, brick construction, and a full sprinkler system. It was built to DC Green Energy Code standards and designed for a future rooftop deck.
Morgan Street terminates at a neighborhood park. Metro service on the Red, Green, and Yellow lines is approximately five blocks away, and Harris Teeter, Safeway, and Giant are approximately four blocks away. Georgetown University Law Center, Johns Hopkins SAIS, Union Station, and the U.S. Capitol are among the nearby destinations identified in the listing.
Key Highlights
- 2020‑built duplex with 3,584 square feet of finished property size
- Two units totaling 7 bedrooms, 7.5 baths, and 2 dens
- Upper Unit #2 is vacant with 4 bedrooms, 4 full bathrooms, and a den
Financial Insights
Estimated NOI and Cap Rate
NOI / Yr
$64,215
Cap Rate
4.28%
Suggested Prices Based on Cap Rates
Cap Rate 5%
$1,284,300
$1.3M
Cap Rate 7%
$917,357
$917.4K
Cap Rate 9%
$713,500
$713.5K
Market Conditions
NOI Build-Up for 3,584 SF
Gross rent
$96.8K $27.00/SF
− Vacancy
−$5.0K −$1.40/SF
EGI
$91.7K $25.60/SF
− OpEx
−$27.5K −$7.68/SF
NOI
$64.2K $17.92/SF
Area
Washington, DC
Vacancy
5.20%
Lease Rate
$27.00 /SF/Yr
Expense Ratio
30.00%
Simulate Cap Rate and NOI
Suggested Prices Based on Cap Rates
Cap Rate 5%
$1,284,300
Cap Rate 7%
$917,357
Cap Rate 9%
$713,500
Alternative Uses
Best Use
Multifamily LT 5
$917.4K
$802.7K – $1.07M
NOI $64,215 @ 7.0% cap · market cap 4.28%
Second Best
Apartment 5plus
$850.7K
$744.4K – $992.5K
NOI $59,550 @ 7.0% cap · market cap 3.97%
Theoretical Best
Office A
$1.84M
$1.61M – $2.15M
NOI $129,045 @ 7.0% cap · market cap 8.60%
Zoning and permitted uses should be independently verified with authorities.
How Realmo checks its estimates
Property Analytics
Unlock full access to Insights
Subscribe to Realmo Intelligence
Open Analytics
Current Use
Lease Details
2
Residential units
Yes
Sprinkler system
Location Intelligence
Trade Area within ½ mile
5,864
Businesses Nearby
Explore this area
Business Placement
Demographics for 20001, DC
49,040
Population
26,728
Households
1.8
Avg Household Size
32
Median Age
78%
College-Educated
95%
High-School Grad
2.0 sq mi
ZIP Area
24,520
Density / Sq Mi
$138,730
Median Household Income
$94,675
Median Earnings
$2,464
Median Rent
$844,500
Median Home Value
Check the figures for this property
Cap Rate, Value Estimation, Potential NOI and more
View Realmo Analytics
Market
Vacancy Rate% for Multifamily in South region

Questions? Ask Rey
Realmo’s AI knows this listing — price, zoning, demand, history. Ask anything.



Frequently Asked Questions
What type of property is this?
Duplex - Newer-construction duplex with private balconies, separate living levels, and secure off-street parking in central Washington.
Where is this duplex located?
The property is located at 206 MORGAN Street NW Washington, DC.
What is the asking price?
The asking price for this property is $1,499,900.
What are key features of this property?
This property features: 2020‑built duplex with 3,584 square feet of finished property size; Two units totaling 7 bedrooms, 7.5 baths, and 2 dens; Upper Unit #2 is vacant with 4 bedrooms, 4 full bathrooms, and a den


