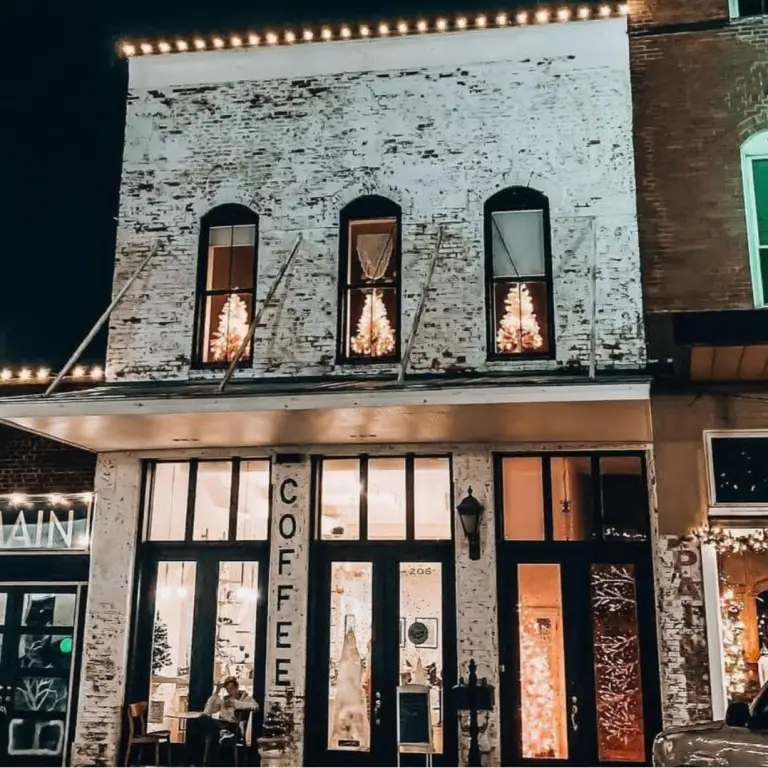
Historic Two-Story Mixed-Use
For Sale
$850,000
206 Mckinney Street, Farmersville, TX 75442
CommercialSale, Farmersville, TX
Property Size4,816 SF
Lot Size0.05 Acres
Price / SF$176.50
Days on Market95
Property Features for 206 Mckinney Street
General Information
Property type
Commercial Sale
Property subtype
Other
Zoning description
Commercial
Parking features
Assigned, On Street
Subdivision
Farmersville Orignial Donation
Lot features
Historic District
Directions
GPS
Standard status
Active
APN
R1045009028B1
Size
4,816 SF
Lot size
0.05 Acres
Utilities
Sewer type
Public Sewer
Heating system
Electric (Heating), Central
Cooling system
Electric, Central Air, Ceiling Fan(s)
Water source
Public
Amenities
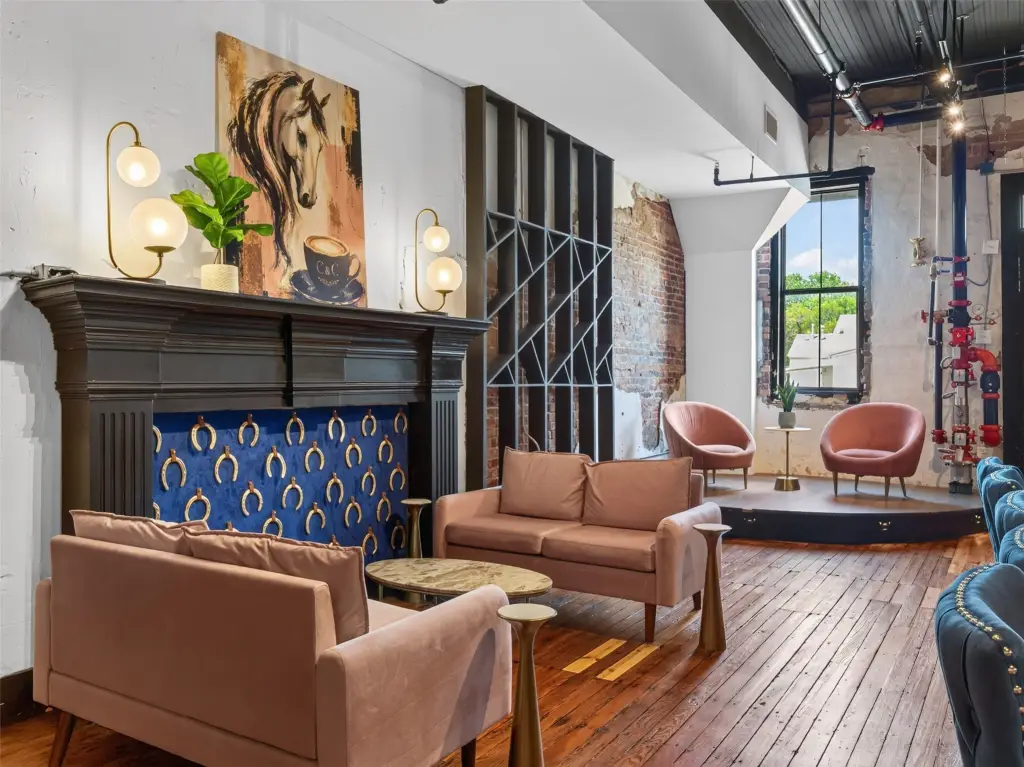
kitchenette
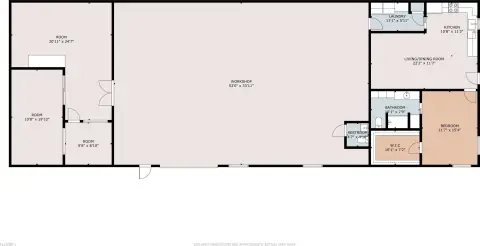
two bedrooms
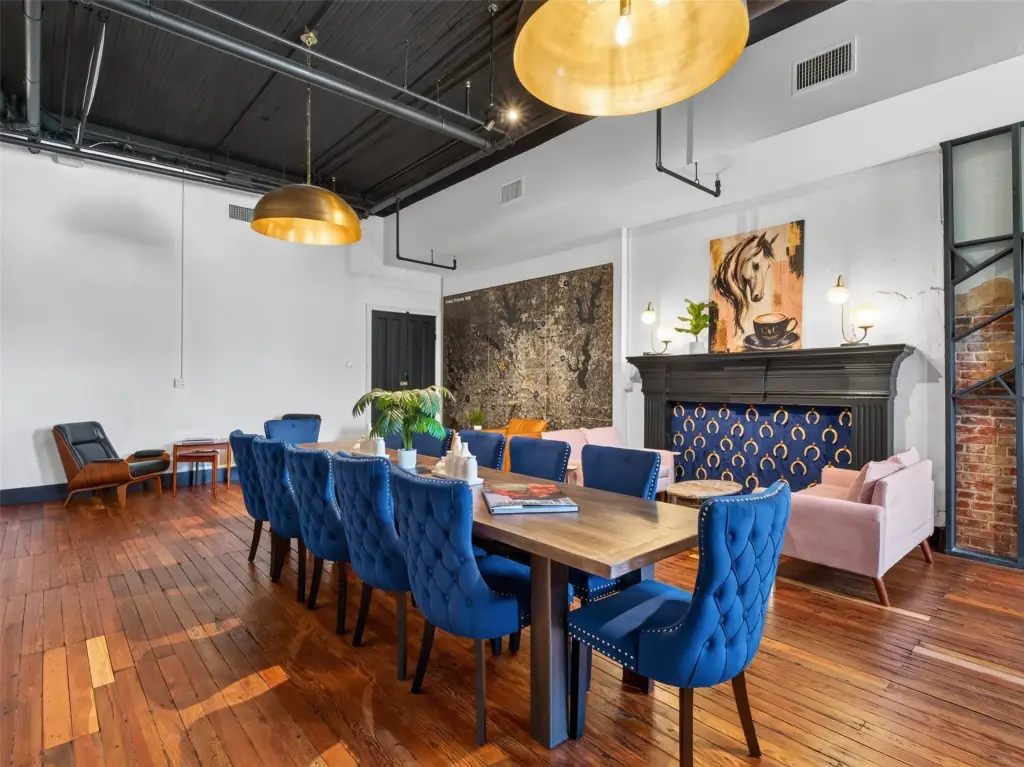
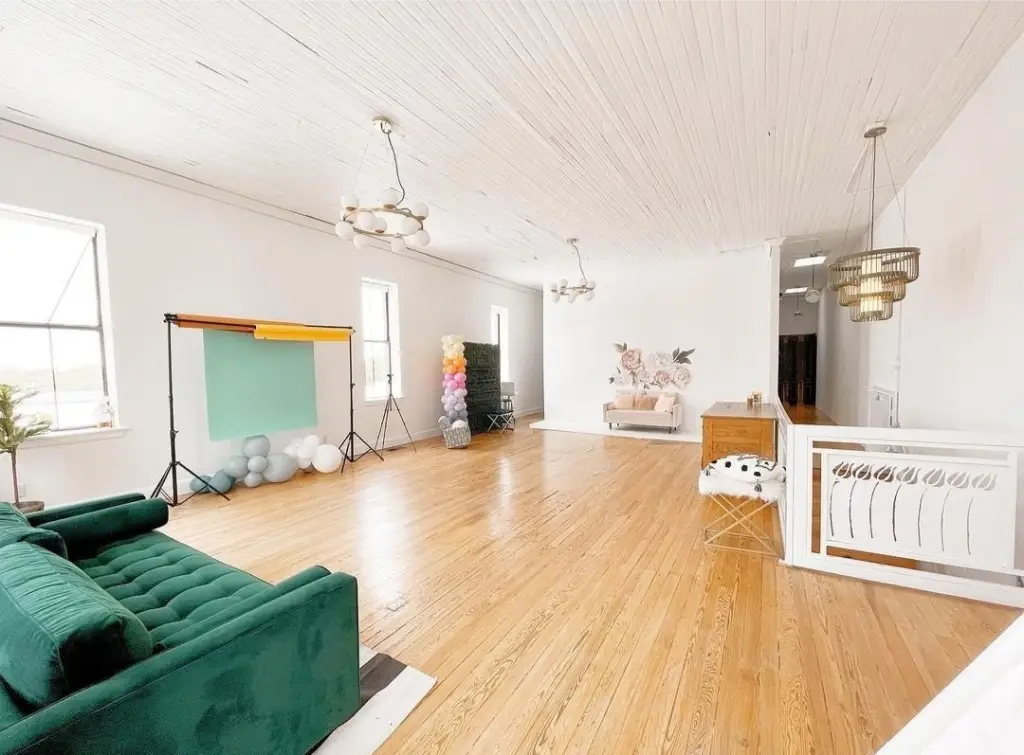
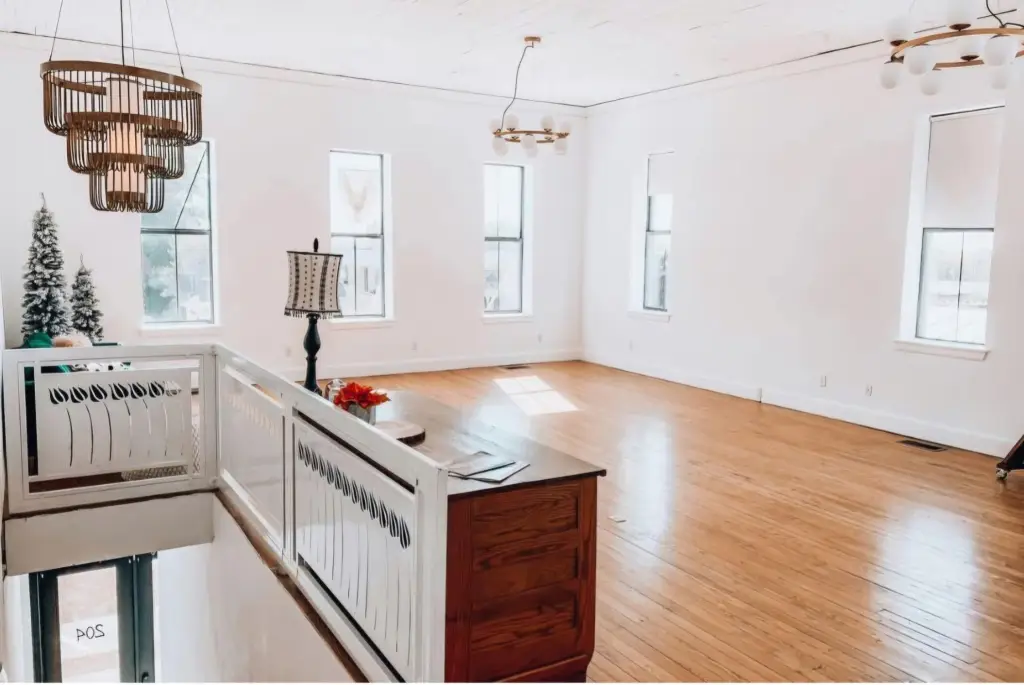
large great room
two full baths
abundant storage
oversized windows
historic architecture
Building Details
Year built
1895
Floors in Building
2
Number of units
2
Flooring type
Wood, Tile
Building materials
Brick, FiberCement
Roof type
Tar/Gravel
Listing Agency:
Keller Williams Prosper Celina · Keller Williams Realty
Listed By:
Jane Mercer
(972) 382-8882
Added: Jul 20
Changed: Oct 18
Last Checked: Oct 22 at 4:06PM
MLS# 21331723
Copyright © 2026 North Texas Real Estate Information Systems, Inc. All rights reserved. All information provided by the listing agent/broker is deemed reliable but is not guaranteed and should be independently verified.

Ask AI about this property
Review the available facts, identify missing information and prepare questions for the agent.
Investment Insights
Based on property information with market context.
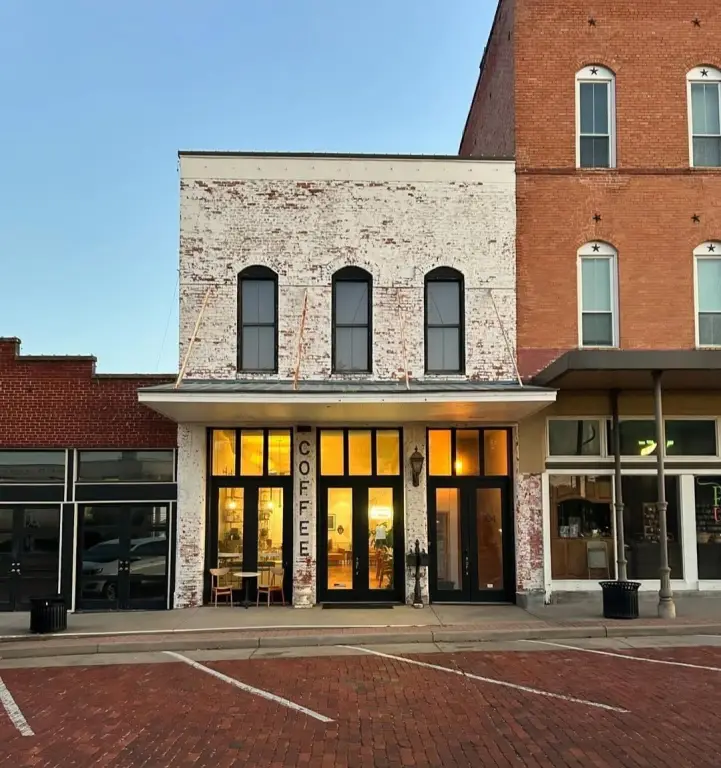
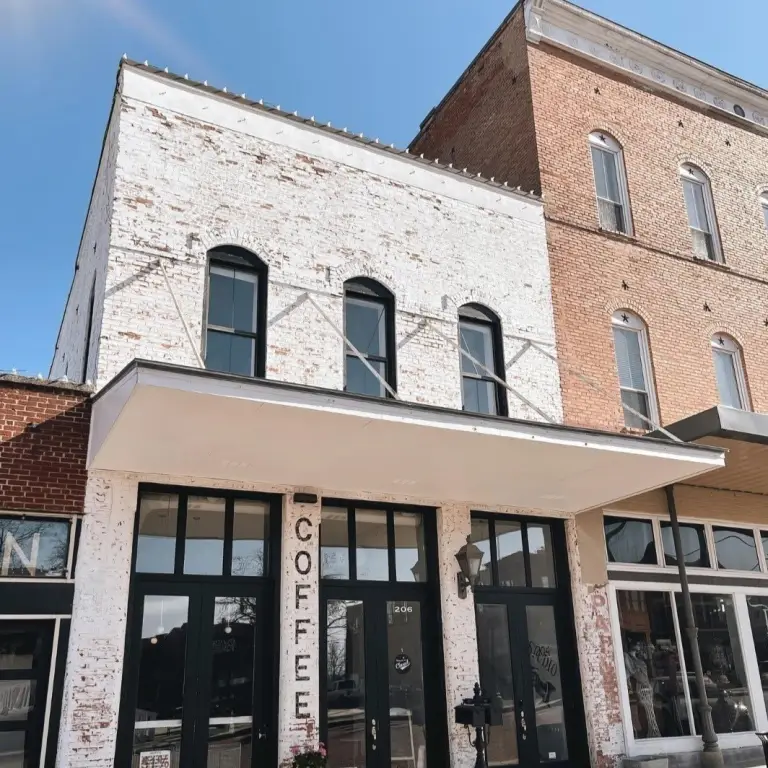
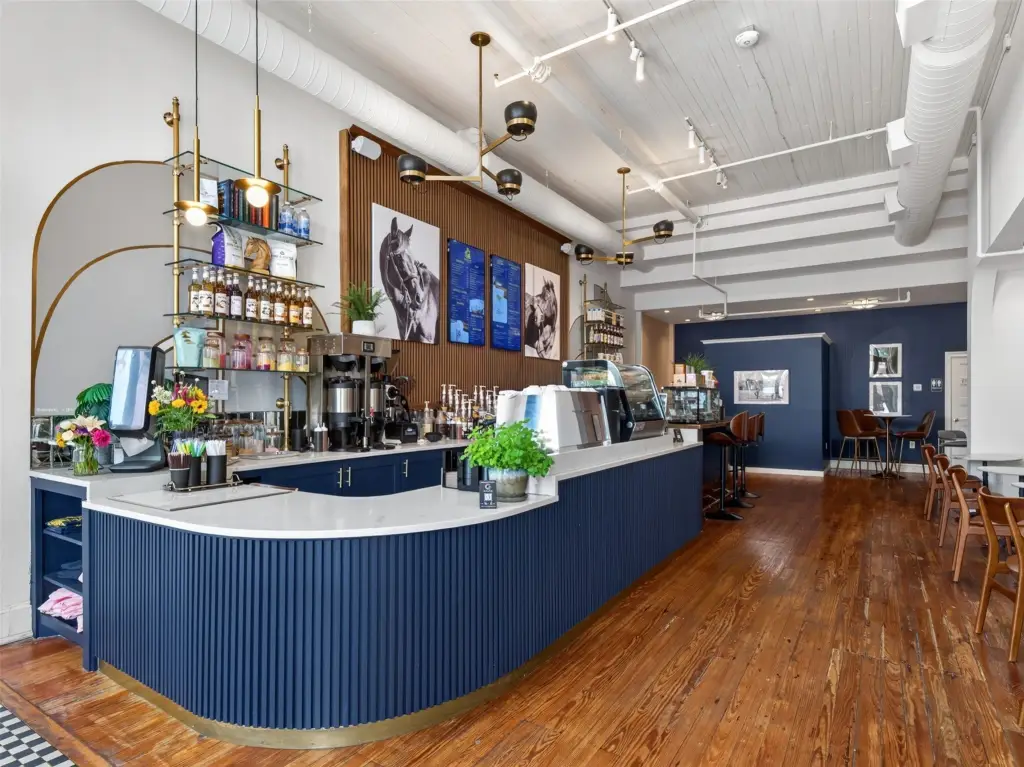
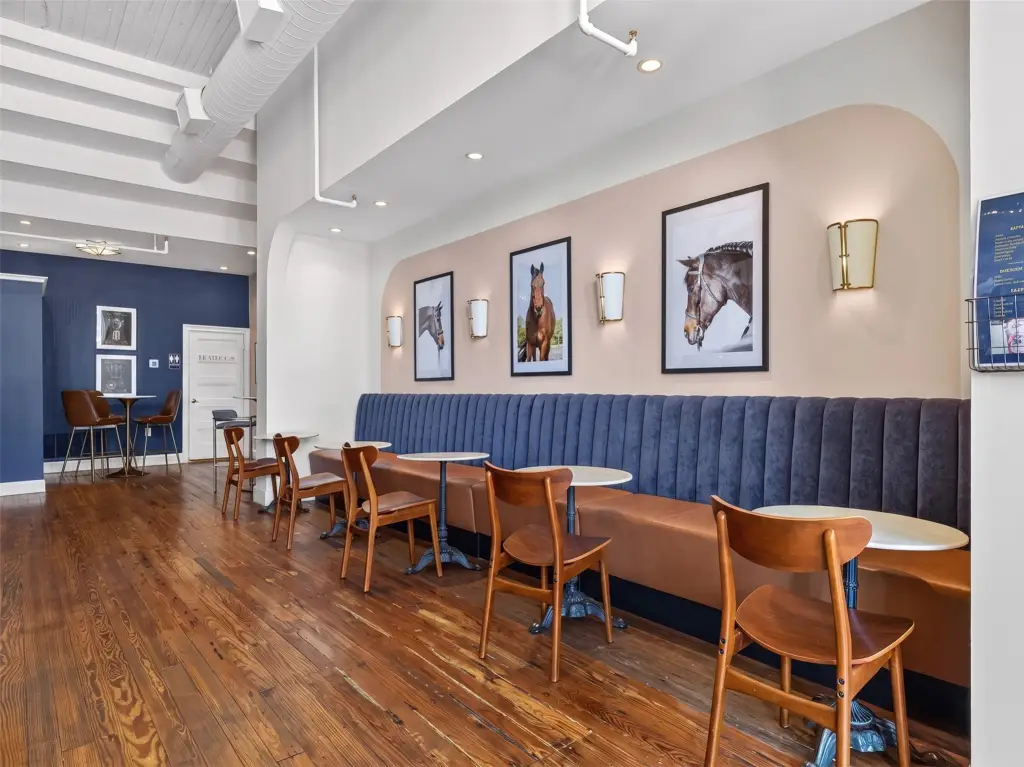
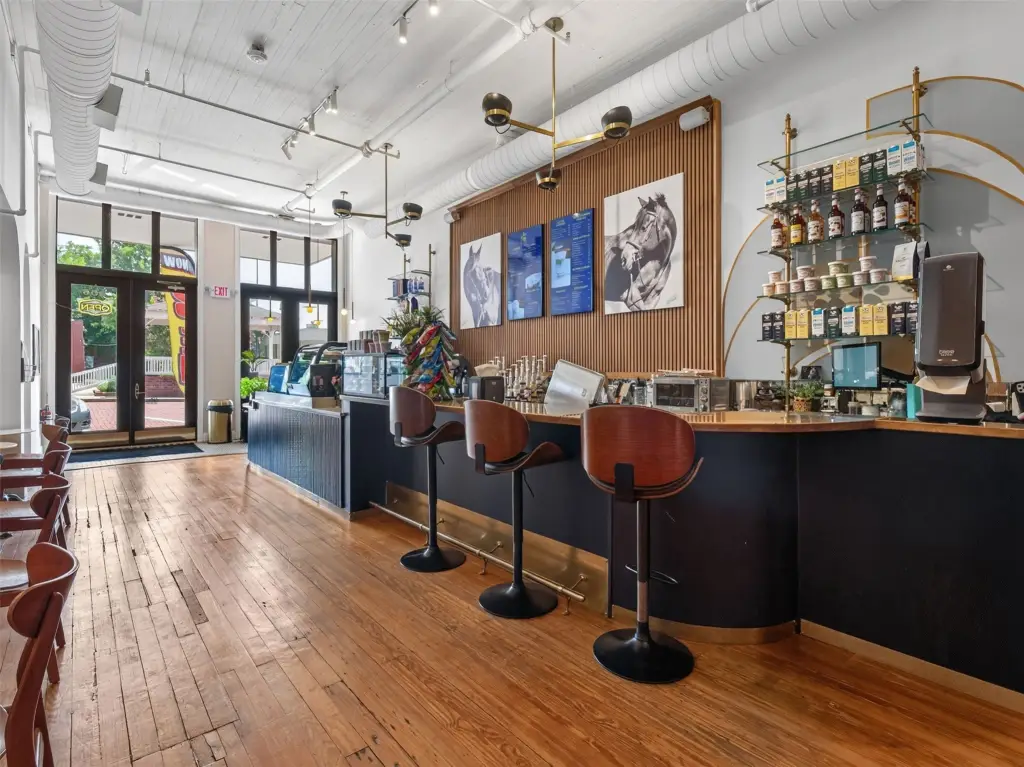
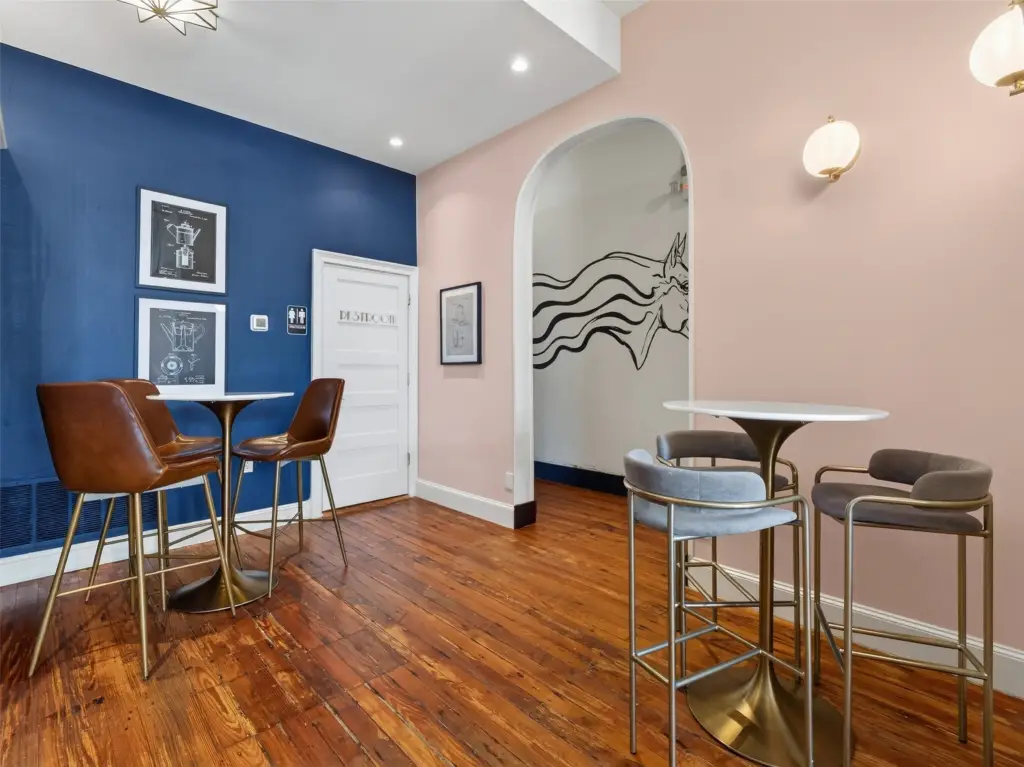
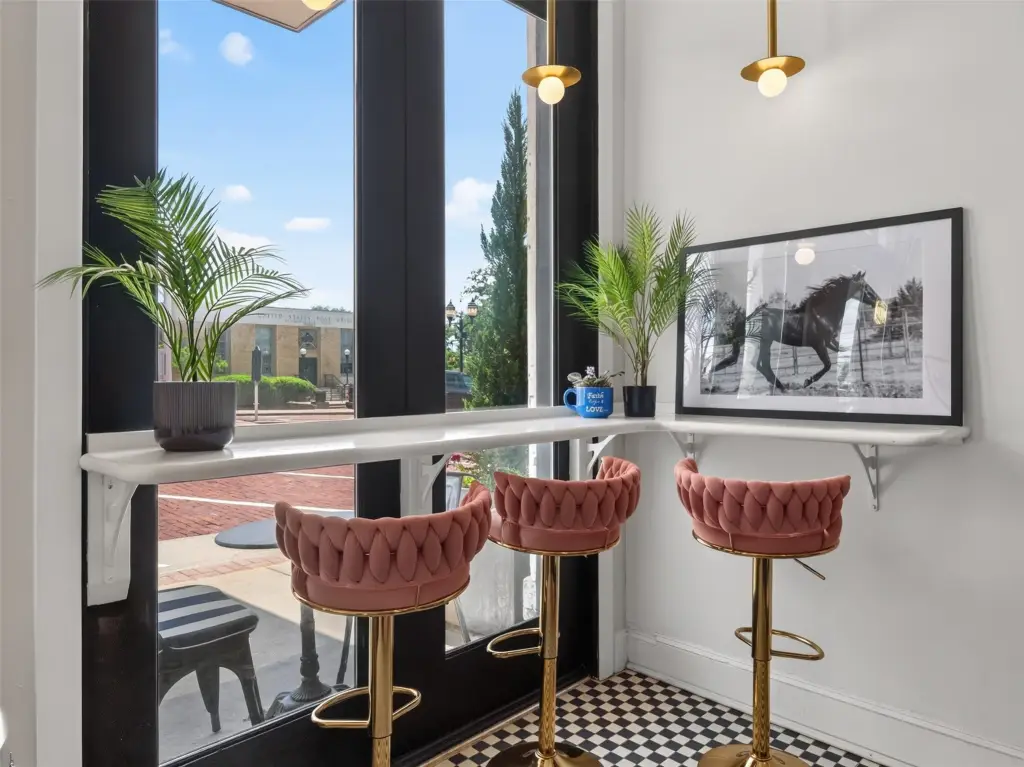
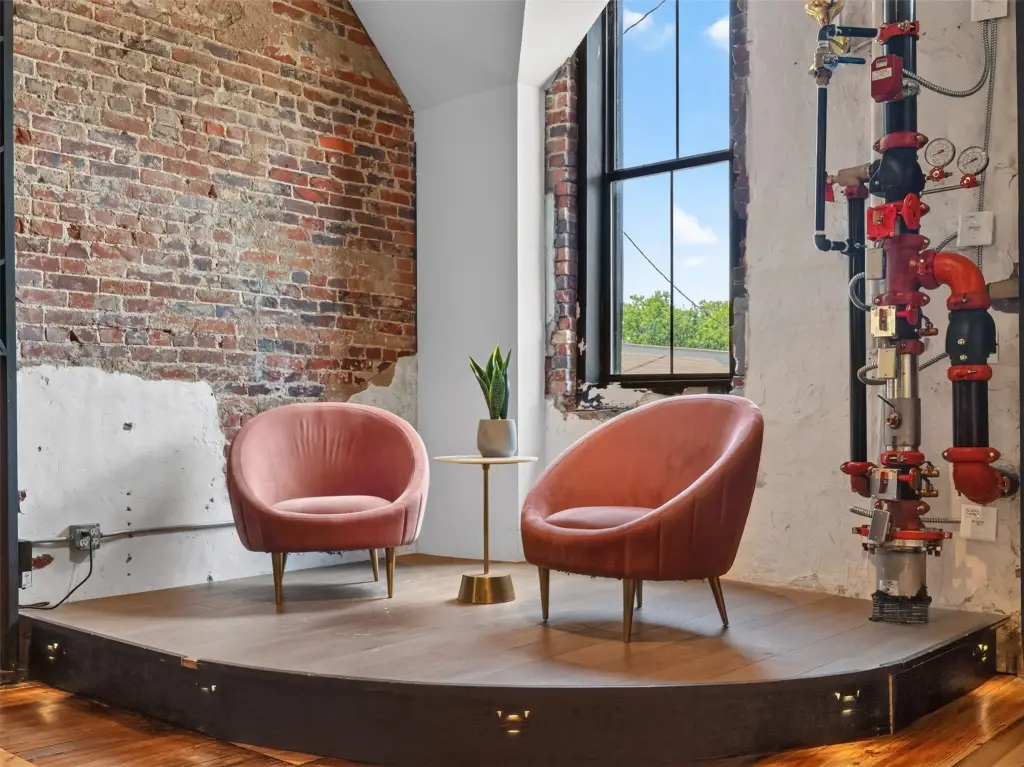
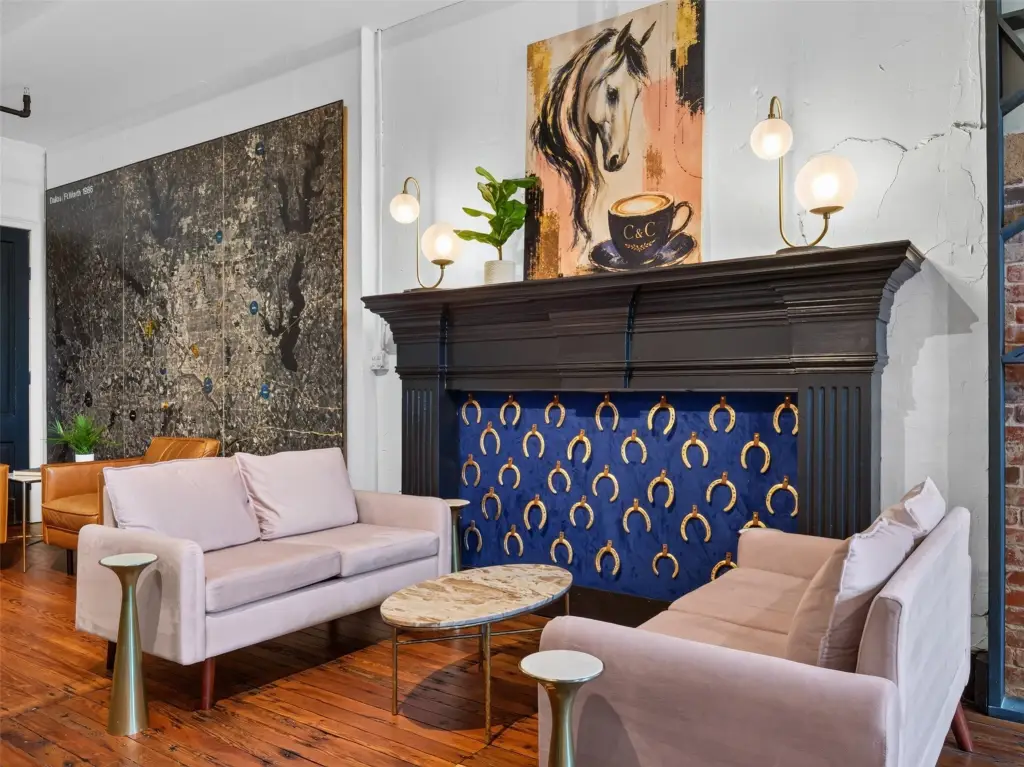
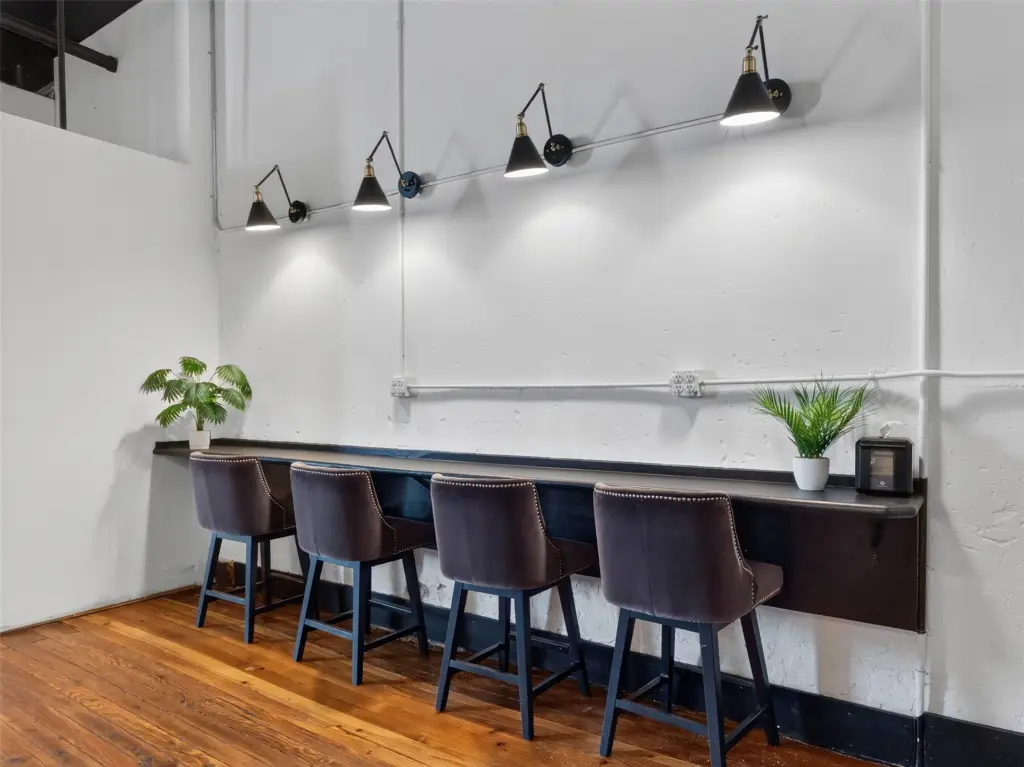
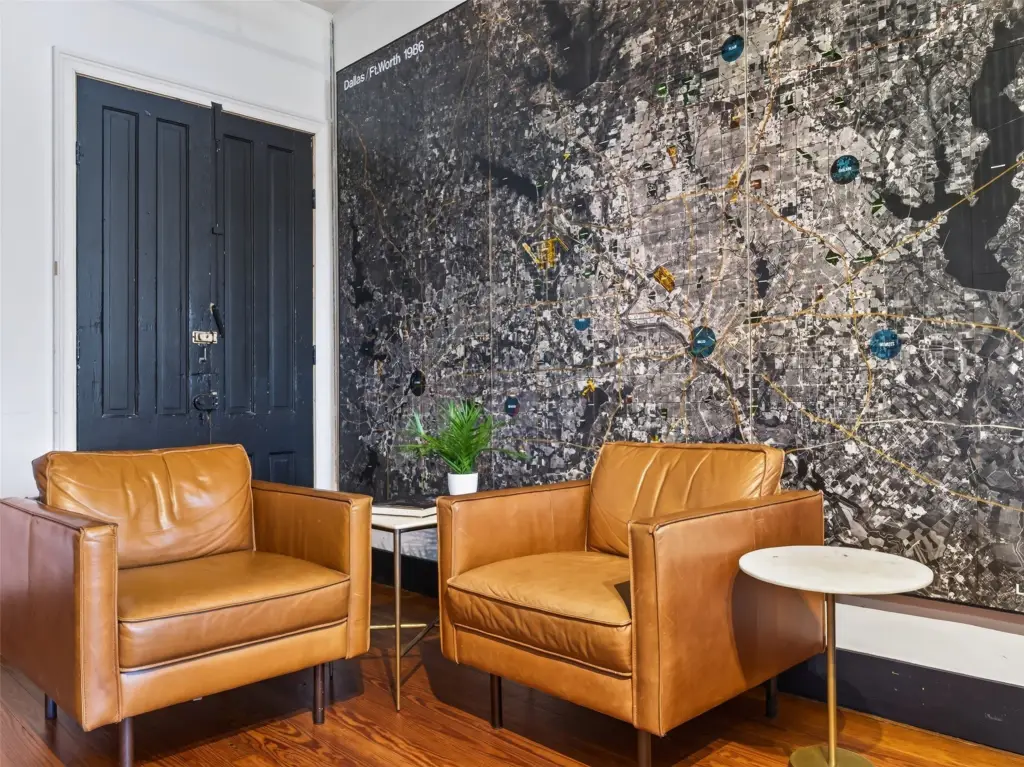
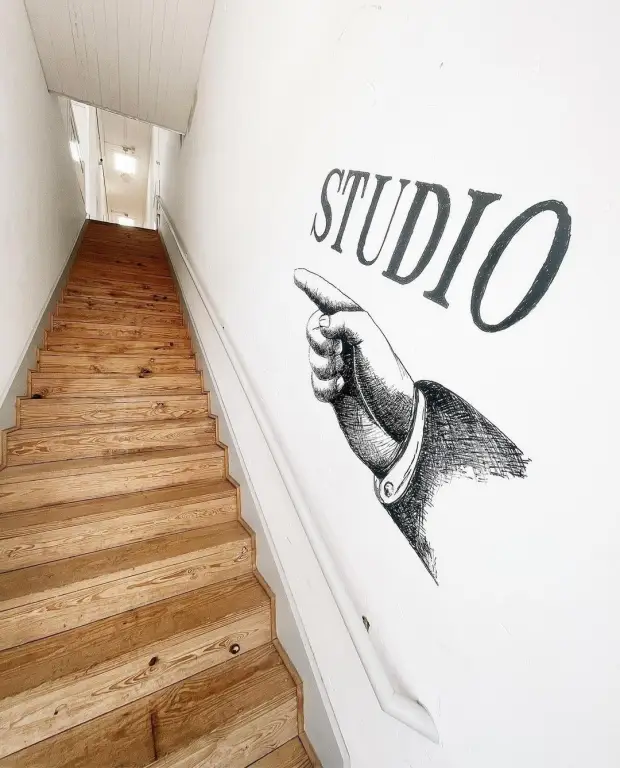
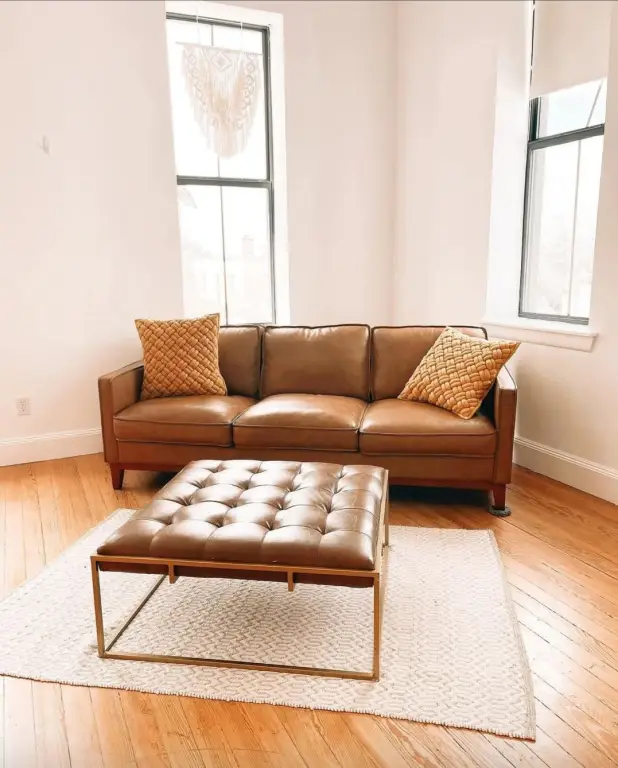
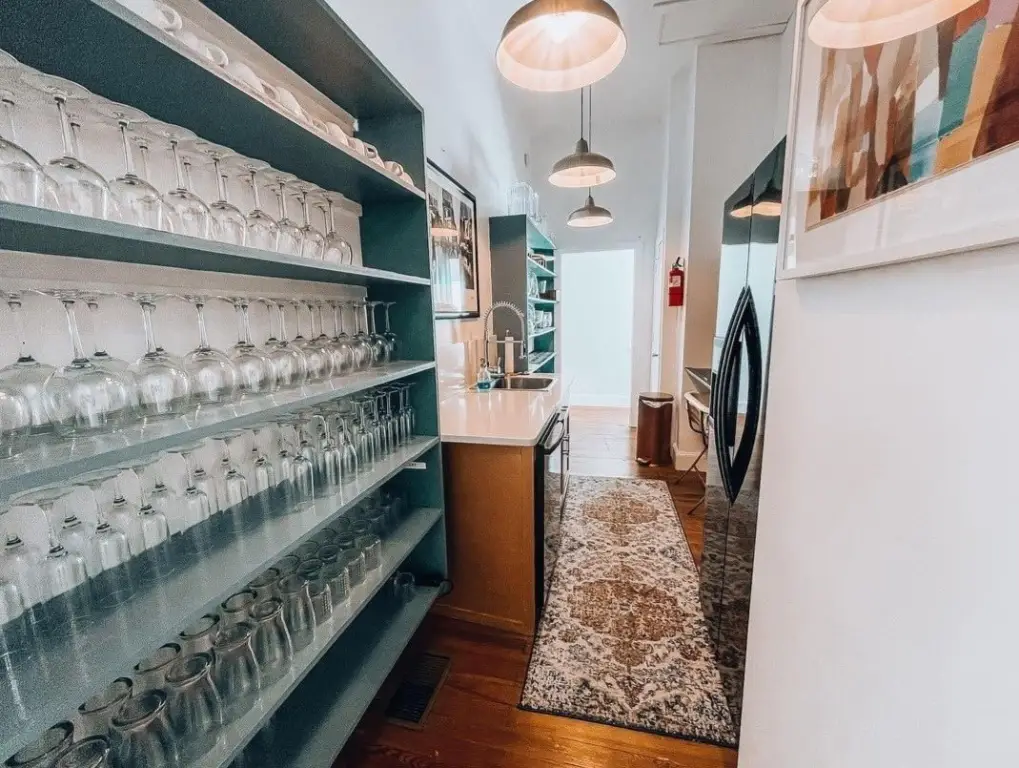
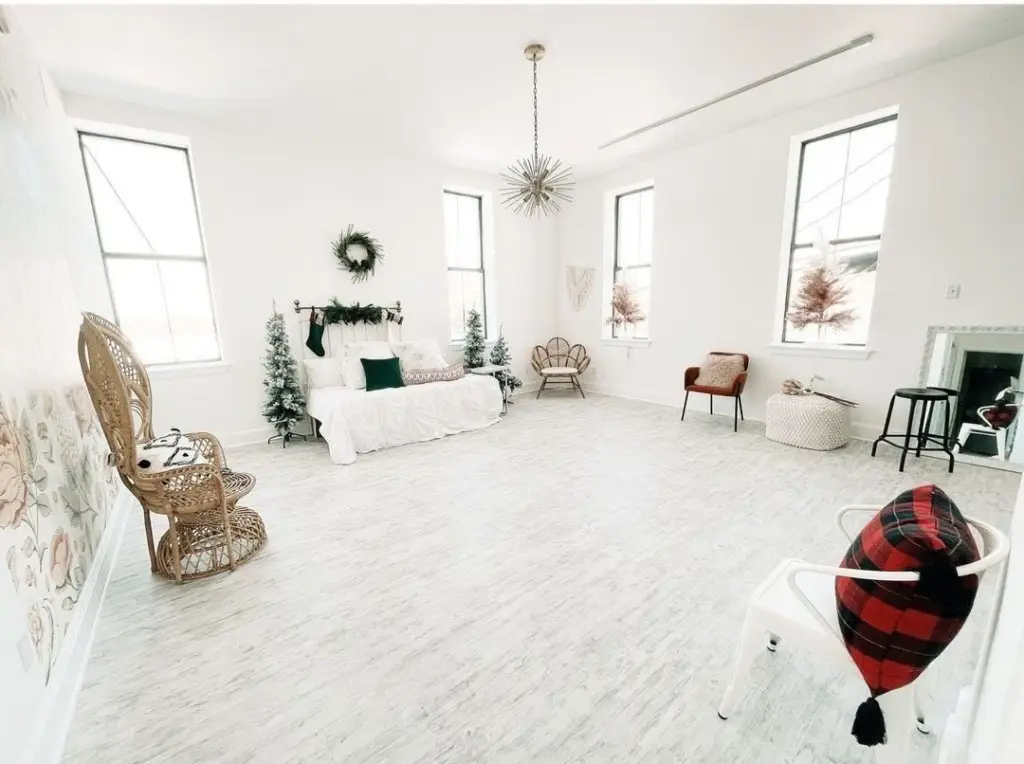
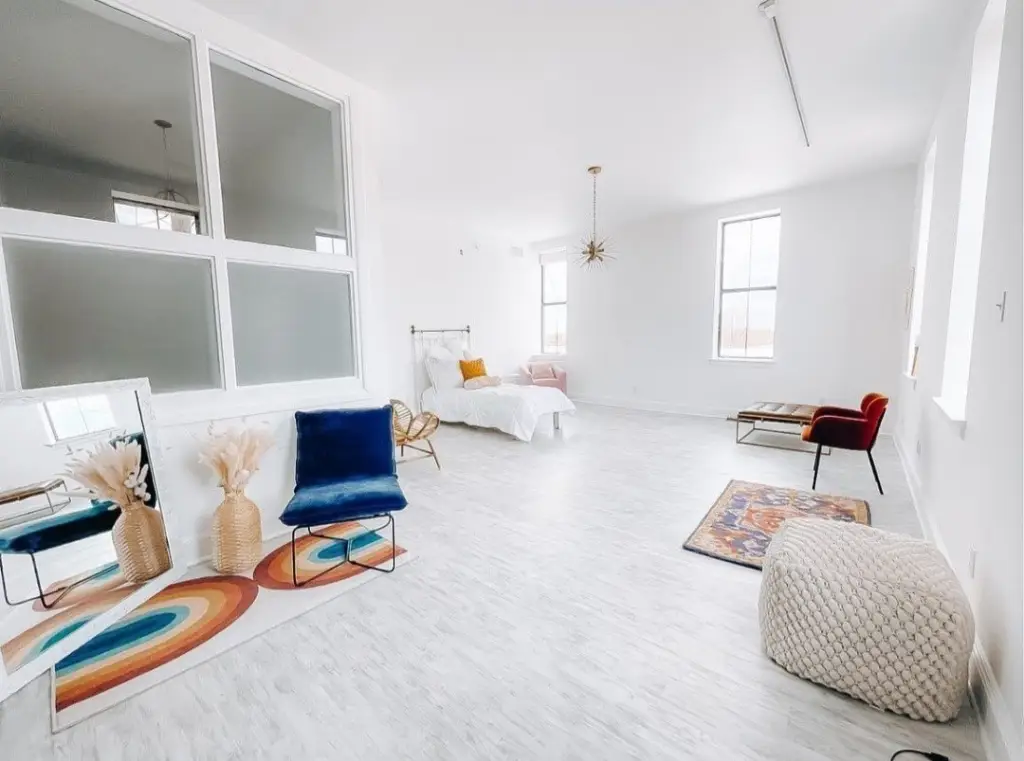
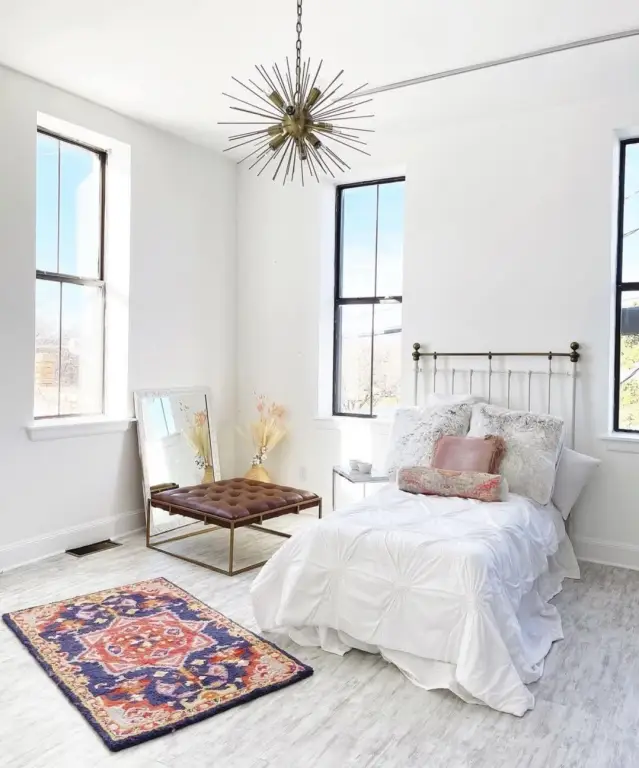
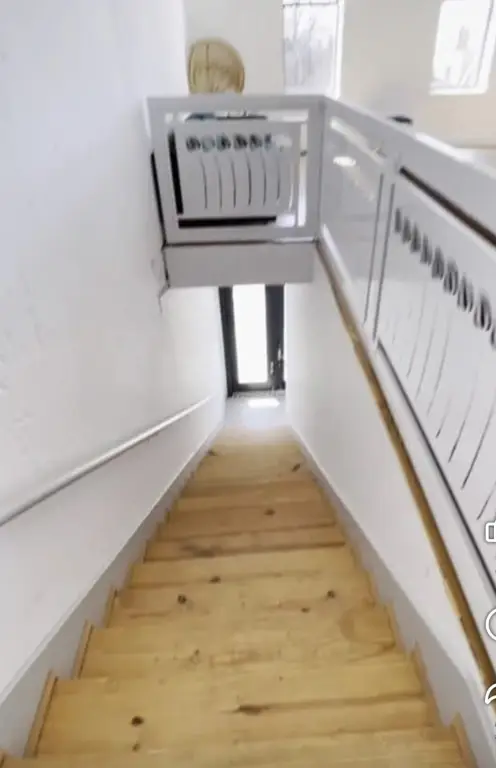
This 4,816-square-foot, two-story mixed-use building dates to 1895 and occupies a 0.0522-acre site at 206 McKinney Street in Farmersville. Brick and fiber-cement exterior materials, tile and wood flooring, central electric heating and cooling, ceiling fans, a tar-and-gravel roof, and public water and sewer combine historic construction with practical building systems. The first floor contains Cup and Canter Coffee House, while the upper level offers a kitchenette, two bedrooms, a great room, two full baths, abundant storage, and oversized windows facing the downtown streetscape.
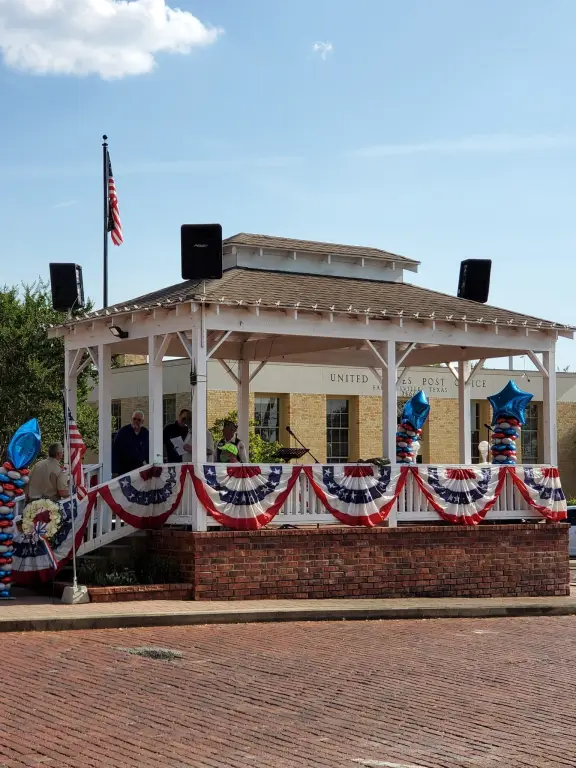
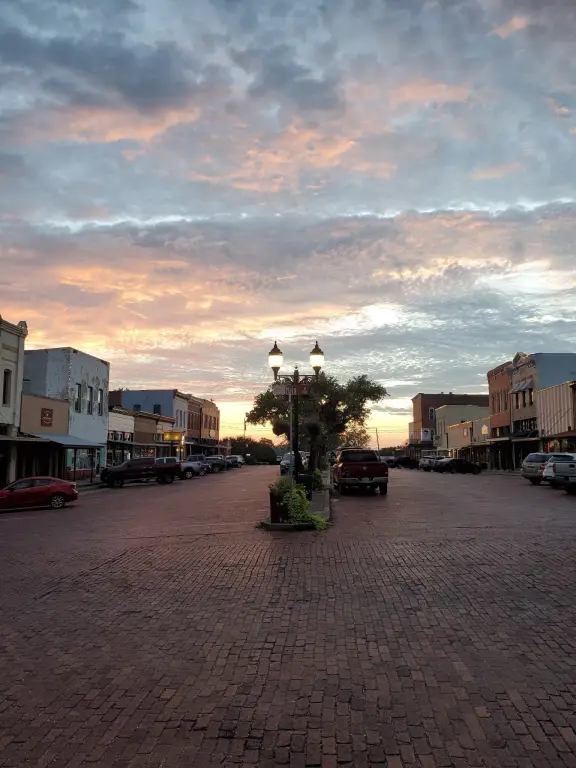
The property is situated in Historic Downtown Farmersville among locally owned shops and restaurants, with year-round community events in the surrounding area. Parking is provided through on-street and assigned spaces. The combination of an established first-floor coffee use and a separately configured upper level provides a distinctive mixed-use layout within the downtown setting.
The property is situated in Historic Downtown Farmersville among locally owned shops and restaurants, with year-round community events in the surrounding area. Parking is provided through on-street and assigned spaces. The combination of an established first-floor coffee use and a separately configured upper level provides a distinctive mixed-use layout within the downtown setting.
Key Highlights
- 4,816 square feet on a 0.0522‑acre site
- Built in 1895 with brick and fiber‑cement exterior materials
- First floor contains Cup and Canter Coffee House
Financial Insights
Estimated NOI and Cap Rate
NOI / Yr
$77,492
Cap Rate
9.12%
Suggested Prices Based on Cap Rates
Cap Rate 5%
$1,549,840
$1.5M
Cap Rate 7%
$1,107,029
$1.1M
Cap Rate 9%
$861,022
$861.0K
Market Conditions
NOI Build-Up for 4,816 SF
Gross rent
$116.2K $24.12/SF
− Vacancy
−$5.5K −$1.13/SF
EGI
$110.7K $22.99/SF
− OpEx
−$33.2K −$6.90/SF
NOI
$77.5K $16.09/SF
Area
Collin County, TX
Vacancy
4.70%
Lease Rate
$24.12 /SF/Yr
Expense Ratio
30.00%
Simulate Cap Rate and NOI
Suggested Prices Based on Cap Rates
Cap Rate 5%
$1,549,840
Cap Rate 7%
$1,107,029
Cap Rate 9%
$861,022
Alternative Uses
Best Use
Specialty Retail
$1.18M
$1.04M – $1.38M
NOI $82,940 @ 7.0% cap · market cap 9.76%
Second Best
Retail
$1.11M
$968.7K – $1.29M
NOI $77,492 @ 7.0% cap · market cap 9.12%
Theoretical Best
Industrial
$4.79M
$4.19M – $5.58M
NOI $334,983 @ 7.0% cap · market cap 39.41%
Zoning and permitted uses should be independently verified with authorities.
How Realmo checks its estimates
Property Analytics
Who owns this building?
See the owner, sales and loan history
Open Analytics
Current Use
Location Intelligence
Trade Area within ½ mile
378
Businesses Nearby
Explore this area
Business Placement
Demographics for 75442, TX
11,241
Population
4,060
Households
2.8
Avg Household Size
39
Median Age
18%
College-Educated
85%
High-School Grad
107.6 sq mi
ZIP Area
104
Density / Sq Mi
$84,591
Median Household Income
$48,482
Median Earnings
$1,501
Median Rent
$330,000
Median Home Value
Check the figures for this property
Cap Rate, Value Estimation, Potential NOI and more
View Realmo Analytics
Market
Vacancy Rate% for Office in South region






Frequently Asked Questions
What type of property is this?
Mixed-use property - Second-floor space includes a kitchenette, two bedrooms, a great room, two full baths, storage, and oversized windows.
Where is this mixed-use property located?
The property is located at 206 Mckinney Street Farmersville, TX.
What is the asking price?
The asking price for this property is $850,000.
What are key features of this property?
This property features: 4,816 square feet on a 0.0522‑acre site; Built in 1895 with brick and fiber‑cement exterior materials; First floor contains Cup and Canter Coffee House


