Gated Residential Income
For Sale
$209,000
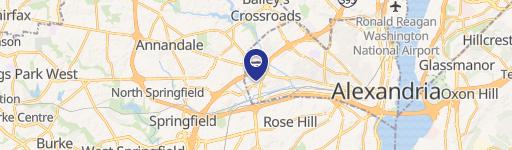
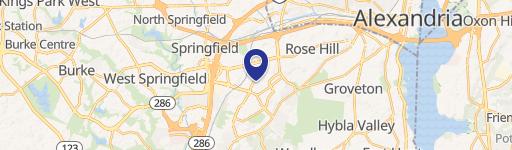
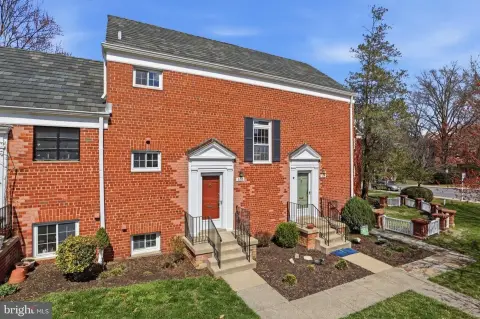
2059 HUNTINGTON AVENUE Unit 304, Alexandria, VA 22303
New LVP flooring, included utilities, and shared amenities create a convenient condominium setting.
Property Size850 SF
Days on Market124
Property Features for 2059 HUNTINGTON AVENUE Unit 304
General Information
Standard status
Active
Size
850 SF
Property subtype
Unit/Flat/Apartment
Site & Location
Highway Access
Yes
Public Transit
Yes
Units
Unit Mix
1 x 1BR/1BA
Multifamily Units
1
Taxes and HOA fees
Annual Taxes
$2,977
Amenities
gated community
concierge service
pool
tennis courts
grilling area
party room
grounds
open parking
Building Details
Building Size
850 SF
Year Built
1972
Listing Agency:
Samson Properties
Listed By:
Carla J Moore · License #0225097130
(703) 994-0508
Source:
Dcmetrorealtyteam
Added: Jun 5
Changed: Oct 6
Last Checked: Oct 5 at 10:24PM
Displayed information is deemed reliable but is not guaranteed and should be independently verified. All listing content including descriptions, pricing, images are the copyrighted material of Samson Properties
Investment Insights
Based on property information with market context.
This residential income condominium is a one-bedroom, one-bath residence at Huntington Creek Club Condominiums. The interior includes new LVP flooring, separate living and dining areas, walk-in closets, and outdoor views. The unit is described as move-in ready, with a layout suited to comfortable residential use.
The community is gated and provides concierge service, a pool, tennis courts, a grilling area, party room, maintained grounds, and open parking for residents and guests. Condominium fees include utilities other than electric. The property is near Huntington Metro, I-495, National Harbor, Old Town Alexandria, Downtown DC, shopping, dining, and entertainment. Built in 1972, the condominium is located at 2059 Huntington Avenue Unit 304 in Alexandria, Virginia.
The community is gated and provides concierge service, a pool, tennis courts, a grilling area, party room, maintained grounds, and open parking for residents and guests. Condominium fees include utilities other than electric. The property is near Huntington Metro, I-495, National Harbor, Old Town Alexandria, Downtown DC, shopping, dining, and entertainment. Built in 1972, the condominium is located at 2059 Huntington Avenue Unit 304 in Alexandria, Virginia.
Key Highlights
- One‑bedroom, one‑bath condominium at 2059 Huntington Avenue Unit 304
- New LVP flooring with separate living and dining areas
- Gated community with concierge service
Financial Insights
Estimated NOI and Cap Rate
NOI / Yr
$13,030
Cap Rate
6.23%
Suggested Prices Based on Cap Rates
Cap Rate 5%
$260,600
$260.6K
Cap Rate 7%
$186,143
$186.1K
Cap Rate 9%
$144,778
$144.8K
Market Conditions
NOI Build-Up for 850 SF
Gross rent
$25.0K $29.40/SF
− Vacancy
−$1.3K −$1.53/SF
EGI
$23.7K $27.87/SF
− OpEx
−$10.7K −$12.54/SF
NOI
$13.0K $15.33/SF
Area
Alexandria, VA
Vacancy
5.20%
Lease Rate
$29.40 /SF/Yr
Expense Ratio
45.00%
Simulate Cap Rate and NOI
Suggested Prices Based on Cap Rates
Cap Rate 5%
$260,600
Cap Rate 7%
$186,143
Cap Rate 9%
$144,778
Alternative Uses
Best Use
Apartment 5plus
$186.1K
$162.9K – $217.2K
NOI $13,030 @ 7.0% cap · market cap 6.23%
Second Best
—
—
no second resolved use
Theoretical Best
Specialty Retail
$472.1K
$413.1K – $550.8K
NOI $33,048 @ 7.0% cap · market cap 15.81%
Zoning and permitted uses should be independently verified with authorities.
Property Analytics
Unlock full access to Insights
Subscribe to Realmo Intelligence
Open Analytics
Current Use
Lease Details
1
Residential units
Yes
Highway access
Location Intelligence
Trade Area within ½ mile
639
Businesses Nearby
Explore this area
Business Placement
Demographics for 22303, VA
16,109
Population
8,669
Households
1.9
Avg Household Size
36
Median Age
61%
College-Educated
92%
High-School Grad
1.9 sq mi
ZIP Area
8,478
Density / Sq Mi
$103,822
Median Household Income
$69,699
Median Earnings
$2,050
Median Rent
$547,300
Median Home Value
Check the figures for this property
Cap Rate, Value Estimation, Potential NOI and more
View Realmo Analytics

Questions? Ask Rey
Realmo’s AI knows this listing — price, zoning, demand, history. Ask anything.






Frequently Asked Questions
What type of property is this?
Residential income property - New LVP flooring, included utilities, and shared amenities create a convenient condominium setting.
Where is this residential income property located?
The property is located at 2059 HUNTINGTON AVENUE Unit 304 Alexandria, VA.
What is the asking price?
The asking price for this property is $209,000.
What are key features of this property?
This property features: One‑bedroom, one‑bath condominium at 2059 Huntington Avenue Unit 304; New LVP flooring with separate living and dining areas; Gated community with concierge service



