Downtown Sanford Mixed-Use
For Sale
Contact for pricing
203 E 3rd St, Sanford, FL 32771
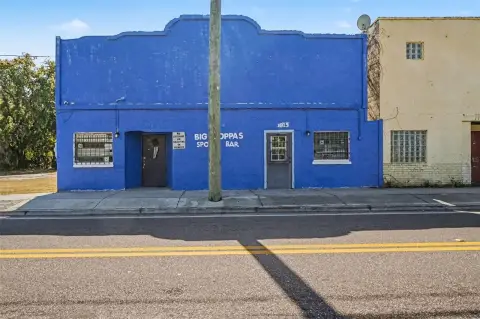
4,930 SF mixed-use building in Downtown Sanford, Florida.
Property Size4,930 SF
Price / SF$303.25
Days on Market240
Property Features for 203 E 3rd St
General Information
Standard status
Active
Size
4,930 SF
Total Parking Spaces
22
Property subtype
Mixed Use
Zoning
SC-3
Occupancy
100%
Investment Type
Stabilized
Building Details
Year Built
1974
Buildings
1
Stories
2
Units
8
Tenancy
Multi
Listing Agency:
Collison Capital
Listed By:
Carter Collison · License #BK3199690
Source:
Crexi
Added: Feb 17
Changed: Oct 11
Last Checked: Oct 14 at 11:50PM
Displayed information is deemed reliable but is not guaranteed and should be independently verified. All listing content including descriptions, pricing, images are the copyrighted material of Collison Capital

Ask AI about this property
Review the available facts, identify missing information and prepare questions for the agent.
Investment Insights
Based on property information with market context.
The Westerfield Building is a 4,930 SF mixed-use building located in Downtown Sanford, Florida, situated in the submarket's most desirable retail and dining area. The property is currently 100% leased to a diverse mix of six retail and office tenants, presenting a unique investment opportunity in the Sanford / Lake Mary market. It features SC-3 zoning (2.0 FAR) within the special Waterfront Downtown Business District (WDBD), designed to encourage higher density commercial development in Sanford's downtown core. Each of the eight office / retail suites offers private exterior entries, eliminating internal common hallways. Individual restrooms, with some units including full shower facilities, are available. The suites also feature direct frontage onto East 3rd Street and ample on-site parking, providing a leasing advantage over comparable mixed-use properties. This combination of on-site amenities in Downtown Sanford has resulted in significant tenant demand and 100% property occupancy.
Key Highlights
- Located in the highly desirable Downtown Sanford retail and dining neighborhood.
- 100% leased to a diverse mix of retail and office tenants.
- Unique investment opportunity in the Sanford / Lake Mary market.
Financial Insights
Estimated NOI and Cap Rate
NOI / Yr
$65,076
Cap Rate
4.35%
Suggested Prices Based on Cap Rates
Cap Rate 5%
$1,301,520
$1.3M
Cap Rate 7%
$929,657
$929.7K
Cap Rate 9%
$723,067
$723.1K
Market Conditions
NOI Build-Up for 4,930 SF
Gross rent
$118.3K $24.00/SF
− Vacancy
−$14.2K −$2.88/SF
EGI
$104.1K $21.12/SF
− OpEx
−$39.0K −$7.92/SF
NOI
$65.1K $13.20/SF
Area
Seminole County, FL
Vacancy
12.00%
Lease Rate
$24.00 /SF/Yr
Expense Ratio
37.50%
Simulate Cap Rate and NOI
Suggested Prices Based on Cap Rates
Cap Rate 5%
$1,301,520
Cap Rate 7%
$929,657
Cap Rate 9%
$723,067
Alternative Uses
Best Use
Mixed Use
$929.7K
$813.5K – $1.08M
NOI $65,076 @ 7.0% cap · market cap 4.35%
Second Best
—
—
no second resolved use
Theoretical Best
Office A
$1.40M
$1.23M – $1.64M
NOI $98,206 @ 7.0% cap · market cap 6.57%
Zoning and permitted uses should be independently verified with authorities.
How Realmo checks its estimates
Property Analytics
Unlock full access to Insights
Subscribe to Realmo Intelligence
Open Analytics
Current Use
Location Intelligence
Trade Area within ½ mile
1,427
Businesses Nearby
Explore this area
Business Placement
Demographics for 32771, FL
57,178
Population
24,062
Households
2.4
Avg Household Size
37
Median Age
35%
College-Educated
91%
High-School Grad
37.5 sq mi
ZIP Area
1,525
Density / Sq Mi
$74,520
Median Household Income
$43,321
Median Earnings
$1,584
Median Rent
$332,500
Median Home Value
Check the figures for this property
Cap Rate, Value Estimation, Potential NOI and more
View Realmo Analytics




Frequently Asked Questions
What type of property is this?
Mixed-use property - 4,930 SF mixed-use building in Downtown Sanford, Florida.
Where is this mixed-use property located?
The property is located at 203 E 3rd St Sanford, FL.
What is the asking price?
The asking price for this property is $1,495,000.
What are key features of this property?
This property features: Located in the highly desirable Downtown Sanford retail and dining neighborhood.; 100% leased to a diverse mix of retail and office tenants.; Unique investment opportunity in the Sanford / Lake Mary market.


