10th-Floor Office Suite with
For Sale
$615,000
20200 W Dixie Highway Unit 903, Miami, FL 33180
Brand-new office suite with floor-to-ceiling windows, glass dividers, and direct elevator access from a covered parking garage.
Property Size988 SF
Price / SF$622.47
Days on Market128
Property Features for 20200 W Dixie Highway Unit 903
General Information
Standard status
Active
Size
988 SF
Property subtype
Commercial
Lease Term
[]
Additional Details
Highway Access
Yes
Building Details
Year Built
2016
Listing Agency:
One Sotheby's International Realty
Listed By:
Richard Toledano · License #A12056458
(786) 255-5222
Source:
Onesothebysrealty
Added: Jun 15
Changed: Oct 13
Last Checked: Oct 19 at 8:59AM
Displayed information is deemed reliable but is not guaranteed and should be independently verified. All listing content including descriptions, pricing, images are the copyrighted material of One Sotheby's International Realty

Ask AI about this property
Review the available facts, identify missing information and prepare questions for the agent.
Investment Insights
Based on property information with market context.
This brand-new office building offers a premium, move-in-ready workspace located on the 10th floor. The suite features elegant glass dividers and an expansive open area. Interior finishes include marble floors throughout, with floor-to-ceiling windows and city views. The space also includes built-in conveniences such as a microwave, coffee maker, and refrigerator, along with a sleek white wall unit.
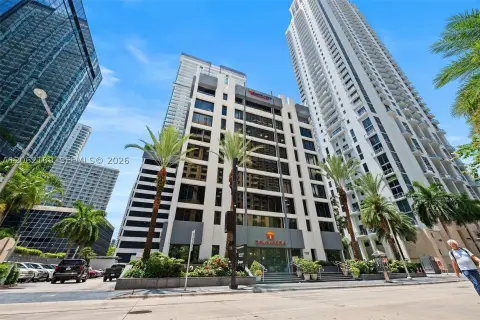
The building is described as being in the heart of Aventura, near major roads and Aventura Mall. The property is located between Dixie Hwy and Ives Dairy Road, with access to nearby commercial and institutional uses. The parking garage is equipped with covered parking and direct elevator access from the parking area.
This suite is well suited for professional users who value a modern, light-filled office layout and controlled access parking. The presence of motorized curtains with remote control can help manage daylight and privacy, while the open floor plan and glass dividers support flexible tenant layouts. With these features and a direct connection from covered parking via the elevator, the space is designed to support day-to-day operations for office-based teams.
The building is described as being in the heart of Aventura, near major roads and Aventura Mall. The property is located between Dixie Hwy and Ives Dairy Road, with access to nearby commercial and institutional uses. The parking garage is equipped with covered parking and direct elevator access from the parking area.
This suite is well suited for professional users who value a modern, light-filled office layout and controlled access parking. The presence of motorized curtains with remote control can help manage daylight and privacy, while the open floor plan and glass dividers support flexible tenant layouts. With these features and a direct connection from covered parking via the elevator, the space is designed to support day-to-day operations for office-based teams.
Key Highlights
- Brand‑new office building/Suite, year built 2016, in the heart of Aventura
- 10th‑floor office with 1,926 sq. ft. interior space and stunning city views
- Floor‑to‑ceiling windows with motorized curtains (remote control)
Financial Insights
Estimated NOI and Cap Rate
NOI / Yr
$28,343
Cap Rate
4.61%
Suggested Prices Based on Cap Rates
Cap Rate 5%
$566,860
$566.9K
Cap Rate 7%
$404,900
$404.9K
Cap Rate 9%
$314,922
$314.9K
Market Conditions
NOI Build-Up for 988 SF
Gross rent
$44.5K $45.00/SF
− Vacancy
−$6.7K −$6.75/SF
EGI
$37.8K $38.25/SF
− OpEx
−$9.4K −$9.56/SF
NOI
$28.3K $28.69/SF
Area
Miami, FL
Vacancy
15.00%
Lease Rate
$45.00 /SF/Yr
Expense Ratio
25.00%
Simulate Cap Rate and NOI
Suggested Prices Based on Cap Rates
Cap Rate 5%
$566,860
Cap Rate 7%
$404,900
Cap Rate 9%
$314,922
Alternative Uses
Best Use
Office B
$404.9K
$354.3K – $472.4K
NOI $28,343 @ 7.0% cap · market cap 4.61%
Second Best
—
—
no second resolved use
Theoretical Best
Specialty Retail
$666.9K
$583.5K – $778.1K
NOI $46,683 @ 7.0% cap · market cap 7.59%
Zoning and permitted uses should be independently verified with authorities.
How Realmo checks its estimates
Property Analytics
Unlock full access to Insights
Subscribe to Realmo Intelligence
Open Analytics
Current Use
Lease Details
Yes
Highway access
Location Intelligence
Trade Area within ½ mile
4,798
Businesses Nearby
Explore this area
Business Placement
Demographics for 33180, FL
35,062
Population
21,112
Households
1.7
Avg Household Size
45
Median Age
55%
College-Educated
95%
High-School Grad
3.3 sq mi
ZIP Area
10,625
Density / Sq Mi
$88,613
Median Household Income
$51,612
Median Earnings
$2,480
Median Rent
$471,400
Median Home Value
Check the figures for this property
Cap Rate, Value Estimation, Potential NOI and more
View Realmo Analytics
Market
Vacancy Rate% for Office in Miami, FL


Frequently Asked Questions
What type of property is this?
Office unit - Brand-new office suite with floor-to-ceiling windows, glass dividers, and direct elevator access from a covered parking garage.
Where is this office unit located?
The property is located at 20200 W Dixie Highway Unit 903 Miami, FL.
What is the asking price?
The asking price for this property is $615,000.
What are key features of this property?
This property features: Brand‑new office building/Suite, year built 2016, in the heart of Aventura; 10th‑floor office with 1,926 sq. ft. interior space and stunning city views; Floor‑to‑ceiling windows with motorized curtains (remote control)


