Turnkey Restaurant
For Sale
Contact for pricing
2010 North Main Street, Gainesville, FL 32609
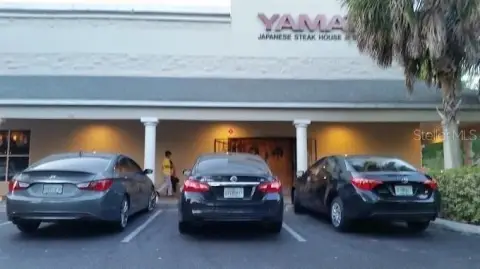
Second-generation restaurant space with extensive built-in kitchen equipment and a ready-to-operate layout for qualified operators.
Property Size3,170 SF
Price / SF$313.88
Days on Market132
Property Features for 2010 North Main Street
General Information
Standard status
Active
Size
3,170 SF
Class
B
Property subtype
Retail
Zoning
BA
Additional Details
Business Included
Yes
Commercial Hood
Yes
Building Details
Year Built
1980
Listing Agency:
Lee & Associates Gainesville
Listed By:
Ken Mears · License #FL SL3273401
(352) 505-9597
Source:
Crexi
Added: May 29
Changed: Oct 6
Last Checked: Oct 7 at 9:40AM
Displayed information is deemed reliable but is not guaranteed and should be independently verified. All listing content including descriptions, pricing, images are the copyrighted material of Lee & Associates Gainesville
Investment Insights
Based on property information with market context.
This 3,710± SF Class B restaurant property features a turnkey second-generation kitchen layout designed for immediate restaurant use. The existing infrastructure includes walk-in cooler and freezer units (each approximately 11’ x 7’), three (3) hood systems, three (3) flat tops, a six (6) burner stove top, four (4) additional burners, and two (2) fryers. The installed equipment and layout are intended to support operational functionality while helping reduce upfront buildout needs for the next user.
Located at 2010 North Main Street in Gainesville, FL 32609, the property is positioned for operators seeking a purpose-built restaurant configuration in an established commercial setting. The asset is described as Class B and includes a full FF&E inventory and property photos available upon execution of a confidentiality agreement.
Zoned BA, the building is suited for restaurant operators and restaurant-adjacent concepts that can utilize the existing commercial kitchen systems. For buyers or tenants evaluating a new location or an additional site, the combination of an operational kitchen design and current cooking and ventilation equipment may support faster transition than a ground-up renovation. Please note that detailed equipment specifics are available through the offered FF&E inventory and photo package under NDA.
Located at 2010 North Main Street in Gainesville, FL 32609, the property is positioned for operators seeking a purpose-built restaurant configuration in an established commercial setting. The asset is described as Class B and includes a full FF&E inventory and property photos available upon execution of a confidentiality agreement.
Zoned BA, the building is suited for restaurant operators and restaurant-adjacent concepts that can utilize the existing commercial kitchen systems. For buyers or tenants evaluating a new location or an additional site, the combination of an operational kitchen design and current cooking and ventilation equipment may support faster transition than a ground-up renovation. Please note that detailed equipment specifics are available through the offered FF&E inventory and photo package under NDA.
Key Highlights
- 3,710± SF Class B restaurant property built in 1980 with an existing second‑generation kitchen layout
- Equipped with walk‑in cooler and freezer units, each approximately 11’ x 7’
- Kitchen includes three (3) hood systems, three (3) flat tops, a six (6) burner stove top, four (4) additional burners, and two (2) fryers
Financial Insights
Estimated NOI and Cap Rate
NOI / Yr
$37,745
Cap Rate
3.79%
Suggested Prices Based on Cap Rates
Cap Rate 5%
$754,900
$754.9K
Cap Rate 7%
$539,214
$539.2K
Cap Rate 9%
$419,389
$419.4K
Market Conditions
NOI Build-Up for 3,170 SF
Gross rent
$53.3K $16.80/SF
− Vacancy
−$2.9K −$0.92/SF
EGI
$50.3K $15.88/SF
− OpEx
−$12.6K −$3.97/SF
NOI
$37.7K $11.91/SF
Area
Gainesville, FL
Vacancy
5.50%
Lease Rate
$16.80 /SF/Yr
Expense Ratio
25.00%
Simulate Cap Rate and NOI
Suggested Prices Based on Cap Rates
Cap Rate 5%
$754,900
Cap Rate 7%
$539,214
Cap Rate 9%
$419,389
Alternative Uses
Best Use
Specialty Retail
$539.2K
$471.8K – $629.1K
NOI $37,745 @ 7.0% cap · market cap 3.79%
Second Best
Industrial
$307.2K
$268.8K – $358.4K
NOI $21,502 @ 7.0% cap · market cap 2.16%
Theoretical Best
Office A
$785.1K
$687.0K – $916.0K
NOI $54,960 @ 7.0% cap · market cap 5.52%
Zoning and permitted uses should be independently verified with authorities.
Property Analytics
Unlock full access to Insights
Subscribe to Realmo Intelligence
Open Analytics
Current Use
Lease Details
Turnkey business
Opportunity
Yes
Commercial hood
Location Intelligence
Trade Area within ½ mile
997
Businesses Nearby
112k
Monthly Visits Nearby
Under-served
Demand for This Use
Explore this area
Business Placement
Foot Traffic Nearby
Shops & Services 50%
Dining 44%
Electronics 3%
Beauty & Spa 2%
Circle K
Shops & Services
18,580 visits/mo
0.4 miles
Ollie's Bargain Outlet
Shops & Services
16,436 visits/mo
0.2 miles
Wendy's
Dining
15,258 visits/mo
0.3 miles
Burger King
Dining
13,417 visits/mo
0.4 miles
Popeyes Louisiana Kitchen
Dining
10,795 visits/mo
0.5 miles
Demographics for 32609, FL
18,322
Population
8,515
Households
2.2
Avg Household Size
38
Median Age
27%
College-Educated
87%
High-School Grad
117.5 sq mi
ZIP Area
156
Density / Sq Mi
$48,121
Median Household Income
$34,041
Median Earnings
$1,159
Median Rent
$174,500
Median Home Value
Check the figures for this property
Cap Rate, Value Estimation, Potential NOI and more
View Realmo Analytics
Market
Vacancy Rate% for Retail in South region

Questions? Ask Rey
Realmo’s AI knows this listing — price, zoning, demand, history. Ask anything.






Frequently Asked Questions
What type of property is this?
Conventional restaurant - Second-generation restaurant space with extensive built-in kitchen equipment and a ready-to-operate layout for qualified operators.
Where is this conventional restaurant located?
The property is located at 2010 North Main Street Gainesville, FL.
What is the asking price?
The asking price for this property is $995,000.
What are key features of this property?
This property features: 3,710± SF Class B restaurant property built in 1980 with an existing second‑generation kitchen layout; Equipped with walk‑in cooler and freezer units, each approximately 11’ x 7’; Kitchen includes three (3) hood systems, three (3) flat tops, a six (6) burner stove top, four (4) additional burners, and two (2) fryers



