Two-Story Live-Work
For Sale
$575,000
201 N Birch St, Coquille, OR 97423
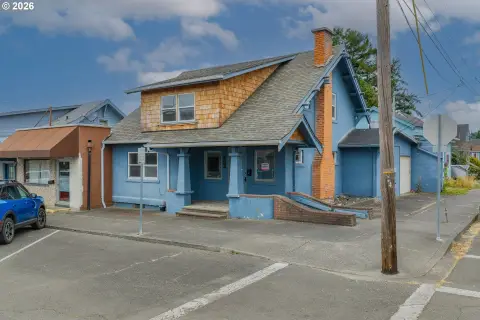
Separate utilities serve the upper and lower levels for combined residential and business use.
Property Size4,000 SF
Price / SF$143.75
Days on Market75
Property Features for 201 N Birch St
General Information
Standard status
Active
Size
4,000 SF
Total Parking Spaces
4
Additional Details
Utilities to Site
Yes
Building Details
Year Built
1932
Stories
2
Listing Agency:
Coldwell Banker Coast Real Est
Listed By:
Randy Paredes · License #201222891
(541) 997-7777
Source:
Wisser
Added: Aug 1
Changed: Sep 14
Last Checked: Oct 5 at 9:57PM
Displayed information is deemed reliable but is not guaranteed and should be independently verified. All listing content including descriptions, pricing, images are the copyrighted material of Coldwell Banker Coast Real Est
Investment Insights
Based on property information with market context.
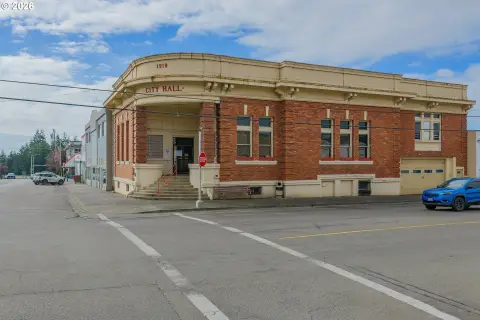
This 4,000 SF live-work property includes two levels of livable and workable space, supporting a combined home and business arrangement or multiple business operations. Separate utilities serve the upstairs and downstairs areas. The property also includes a 575 SF Art Studio built March 2026, a large 4-car garage for supplies and materials, and an 800 SF unfinished basement that adds substantial storage or future buildout space. Originally built in 1932, the property offers a varied configuration for work, living, studio, and storage functions.
Located at 201 N Birch St in Coquille, the property sits in the center of town. On-site parking is also provided.
Located at 201 N Birch St in Coquille, the property sits in the center of town. On-site parking is also provided.
Key Highlights
- Two‑story live‑work property with separate utilities for the upstairs and downstairs
- 4,000 SF of livable and workable space
- 575 SF Art Studio built March 2026
Financial Insights
Estimated NOI and Cap Rate
NOI / Yr
$37,152
Cap Rate
6.46%
Suggested Prices Based on Cap Rates
Cap Rate 5%
$743,040
$743.0K
Cap Rate 7%
$530,743
$530.7K
Cap Rate 9%
$412,800
$412.8K
Market Conditions
NOI Build-Up for 4,000 SF
Gross rent
$57.6K $14.40/SF
− Vacancy
−$8.1K −$2.02/SF
EGI
$49.5K $12.38/SF
− OpEx
−$12.4K −$3.10/SF
NOI
$37.2K $9.29/SF
Area
Coos County, OR
Vacancy
14.00%
Lease Rate
$14.40 /SF/Yr
Expense Ratio
25.00%
Simulate Cap Rate and NOI
Suggested Prices Based on Cap Rates
Cap Rate 5%
$743,040
Cap Rate 7%
$530,743
Cap Rate 9%
$412,800
Alternative Uses
Best Use
Office B
$530.7K
$464.4K – $619.2K
NOI $37,152 @ 7.0% cap · market cap 6.46%
Second Best
Mixed Use
$512.6K
$448.5K – $598.0K
NOI $35,880 @ 7.0% cap · market cap 6.24%
Theoretical Best
Office A
$724.1K
$633.6K – $844.8K
NOI $50,688 @ 7.0% cap · market cap 8.82%
Zoning and permitted uses should be independently verified with authorities.
How Realmo checks its estimates
Property Analytics
Unlock full access to Insights
Subscribe to Realmo Intelligence
Open Analytics
Current Use
Lease Details
Yes
Utilities to site
Location Intelligence
Trade Area within ½ mile
317
Businesses Nearby
Explore this area
Business Placement
Demographics for 97423, OR
6,986
Population
2,835
Households
2.5
Avg Household Size
49
Median Age
19%
College-Educated
91%
High-School Grad
126.6 sq mi
ZIP Area
55
Density / Sq Mi
$57,665
Median Household Income
$36,250
Median Earnings
$1,150
Median Rent
$266,200
Median Home Value
Check the figures for this property
Cap Rate, Value Estimation, Potential NOI and more
View Realmo Analytics
Market
Vacancy Rate% for Office in West region

Questions? Ask Rey
Realmo’s AI knows this listing — price, zoning, demand, history. Ask anything.





Frequently Asked Questions
What type of property is this?
Live-work space - Separate utilities serve the upper and lower levels for combined residential and business use.
Where is this live-work space located?
The property is located at 201 N Birch St Coquille, OR.
What is the asking price?
The asking price for this property is $575,000.
What are key features of this property?
This property features: Two‑story live‑work property with separate utilities for the upstairs and downstairs; 4,000 SF of livable and workable space; 575 SF Art Studio built March 2026


